The Covid-19 pandemic since it hit the world early 2020 and exacerbated in subsequent months has led to numerous unprecedented impacts on various industries. The orthopedic implants manufacturing also witnessed snags due to the unavailability of raw materials and gradually increase in labor shortage. Closing of international trade due to Covid-19 led closures and lockdowns at the national level has put substantial pressures on manufacturing units. Further, end-consumer demand in the veterinary orthopedic implant market also suffered in key economies, forcing industries in the value chain realign their strategies at attain resiliency. This might help in recovery of demand in various developing and developed economies in the other half of the forecast period.
Governments in various countries are extending financial supports and framing favorable policies for veterinary care. On the other hand, research and development in recent years have tested novel implant materials. Also, livestock owners have become more aware of the care of animals. On the research front, new animal models have been incorporated in such research in the veterinary orthopedic implant market. Rising investment by pet owners, notably dog owners, has also fueled the prospect in the veterinary orthopedic implants. Adoption of better radiology devices in veterinary care has also favorably influenced the demand. However, the concern of osteomyelitis has made pet owners slightly skeptical of the current implantation procedures. Some of the common complications post implantation can be infection, fistula, and inflammatory reaction. The growing number of orthopedic implant surgeries for dogs has focused on lowering the risk of surgical site infections (SSI). In this regard, postoperative antimicrobials played a crucial role in several of the randomized studies involving veterinary orthopedic implants in dogs, where these are administered in perioperative period. The adoption of multivariable logistic regression has benefitted research teams in such studies. In coming years, more pet owners will seek safer and effective options for bone problems, thus expanding the avenue in the veterinary orthopedic implant market.
The veterinary orthopedic implant market expects to churn good growth during the forecast period of 2018-2026 due to the rising demand for effective animal care. Other factors include the multiplying of animal hospitals and veterinary doctors. In addition, the availability of a plethora of treatment and surgery options is also increasing the growth rate of the veterinary orthopedic implant market.
Based on product, the veterinary orthopedic implant market can be segmented into veterinary plates and screws, hip replacement implants, knee replacement implants, joint replacement implants, and others.
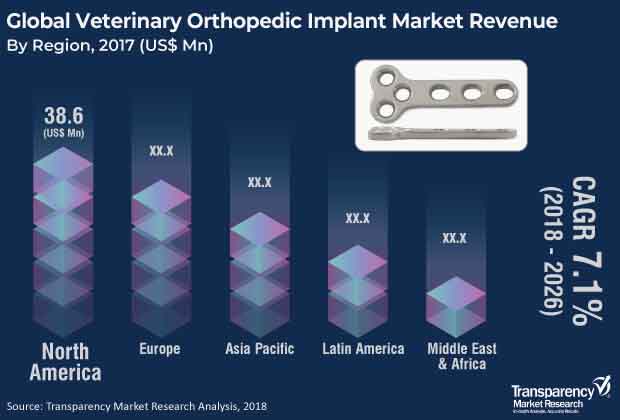
Various orthopedic implants are required during injuries for bones and joints. Injuries occur due to sports, accidents, diseases, etc.. Availability of veterinary implants and joint replacement for the treatment of various diseases and injuries among companion animals is highly valued by pet owners. Pet owners across the globe spend billions of dollars every year for the diagnosis and treatment of diseases affecting their beloved pets. Increase in expenditure on animal health is expected to boost market growth in the next few years. The global veterinary orthopedic implant market was valued at US$ 86.3 Mn in 2017. It is projected to expand at a CAGR of 7.1% from 2018 to 2026.
The global veterinary orthopedic implant market has been segmented based on product type, end-user, and region. In terms of product type, the global market has been classified into veterinary plates & screws, joint replacement implants, and others. The joint replacement implants segment has been further classified into hip replacement implants, knee replacement implants, and others. The veterinary plates & screws segment is anticipated to account for a leading share of the global market during the forecast period, owing to high consumption of these veterinary plates & screws during veterinary orthopedic processes. In terms of end-user, the global market has been bifurcated into veterinary hospitals & clinics and research institutes. The veterinary hospitals & clinics segment is expected to account for a significant share of the global market during the forecast period, due to a rise in the number of private clinical practices.
In terms of region, the global veterinary orthopedic implant market has been segmented into North America, Europe, Asia Pacific, Latin America, and Middle East & Africa. North America and Europe accounted for a major share of the global market in 2017. High pet ownership and increase in spending on animal health drive the veterinary orthopedic implant market in these regions. The market in Asia Pacific is likely to expand at a significant CAGR during the forecast period. Rise in the population of livestock animals and increase in pet adoption are projected to propel the market in the region in the next few years.
Key players operating in the global veterinary orthopedic implant market include B. Braun Melsungen AG, Johnson & Johnson, Veterinary Orthopedic Implants, Inc., BioMedtrix, LLC, KYON Veterinary Surgical Products, IMEX Veterinary, Inc., Orthomed (UK) Ltd, and Securos Surgical. These companies have a broad product portfolio of veterinary orthopedic implants along with a strong distribution system across the globe.
1. Preface
1.1. Market Definition and Scope
1.2. Market Segmentation
1.3. Key Research Objectives
1.4. Research Highlights
2. Assumptions and Research Methodology
3. Executive Summary : Global Veterinary Orthopedic Implant Market
4. Market Overview
4.1. Introduction
4.1.1. Product Definition
4.2. Overview
4.3. Market Dynamics
4.3.1. Drivers
4.3.2. Restraints
4.3.3. Opportunities
4.4. Global Veterinary Orthopedic Implant Market Analysis and Forecasts, 2016–2026
4.4.1. Market Revenue Projections (US$ Mn)
5. Market Outlook
5.1. Animal Population (Mn), by Key Country, in 2017
5.2. Pet ownership (%), by Key Country, 2016
5.3. Regulatory Scenario
6. Global Veterinary Orthopedic Implant Market Analysis and Forecasts, by Product
6.1. Introduction & Definition
6.2. Key Findings / Developments
6.3. Market Value Forecast, by Product, 2016–2026
6.3.1. Veterinary Plates & Screws
6.3.2. Joint Replacement Implants
6.3.2.1. Hip Replacement Implants
6.3.2.2. Knee Replacement Implants
6.3.2.3. Others
6.3.3. Others
6.4. Market Attractiveness, by Product
7. Global Veterinary Orthopedic Implant Market Analysis and Forecasts, by End-user
7.1. Introduction & Definition
7.2. Key Findings/Developments
7.3. Market Value Forecast, by End-user, 2016–2026
7.3.1. Veterinary Hospitals & Clinics
7.3.2. Research Institutes
7.4. Market Attractiveness, by End-user
8. Global Veterinary Orthopedic Implant Market Analysis and Forecasts, by Region
8.1. Key Findings
8.2. Market Value Forecast, by Region
8.2.1. North America
8.2.2. Europe
8.2.3. Asia Pacific
8.2.4. Latin America
8.2.5. Middle East & Africa
8.3. Market Attractiveness, by Country/Region
9. North America Veterinary Orthopedic Implant Market Analysis and Forecast
9.1. Introduction
9.1.1. Key Findings
9.2. Market Value Forecast, by Product, 2016–2026
9.2.1. Veterinary Plates & Screws
9.2.2. Joint Replacement Implants
9.2.2.1. Hip Replacement Implants
9.2.2.2. Knee Replacement Implants
9.2.2.3. Others
9.2.3. Others
9.3. Market Value Forecast, by End-user, 2016–2026
9.3.1. Veterinary Hospitals & Clinics
9.3.2. Research Institutes
9.4. Market Value Forecast, by Country, 2016–2026
9.4.1. U.S.
9.4.2. Canada
9.5. Market Attractiveness Analysis
9.5.1. By Product
9.5.2. By End-user
9.5.3. By Country
10. Europe Veterinary Orthopedic Implant Market Analysis and Forecast
10.1. Introduction
10.1.1. Key Findings
10.2. Market Value Forecast, by Product, 2016–2026
10.2.1. Veterinary Plates & Screws
10.2.2. Joint Replacement Implants
10.2.2.1. Hip Replacement Implants
10.2.2.2. Knee Replacement Implants
10.2.2.3. Others
10.2.3. Others
10.3. Market Value Forecast, by End-user, 2016–2026
10.3.1. Veterinary Hospitals & Clinics
10.3.2. Research Institutes
10.4. Market Value Forecast, by Country, 2016–2026
10.4.1. Germany
10.4.2. U.K.
10.4.3. France
10.4.4. Spain
10.4.5. Italy
10.4.6. Rest of Europe
10.5. Market Attractiveness Analysis
10.5.1. By Product
10.5.2. By End-user
10.5.3. By Country
11. Asia Pacific Veterinary Orthopedic Implant Market Analysis and Forecast
11.1. Introduction
11.1.1. Key Findings
11.2. Market Value Forecast by Product, 2016–2026
11.2.1. Veterinary Plates & Screws
11.2.2. Joint Replacement Implants
11.2.2.1. Hip Replacement Implants
11.2.2.2. Knee Replacement Implants
11.2.2.3. Others
11.2.3. Others
11.3. Market Value Forecast by End-user, 2016–2026
11.3.1. Veterinary Hospitals & Clinics
11.3.2. Research Institutes
11.4. Market Value Forecast by Country, 2016–2026
11.4.1. China
11.4.2. Japan
11.4.3. India
11.4.4. Australia & New Zealand
11.4.5. Rest of Asia Pacific
11.5. Market Attractiveness Analysis
11.5.1. By Product
11.5.2. By End-user
11.5.3. By Country
12. Latin America Veterinary Orthopedic Implant Market Analysis and Forecast
12.1. Introduction
12.1.1. Key Findings
12.2. Market Value Forecast, by Product, 2016–2026
12.2.1. Veterinary Plates & Screws
12.2.2. Joint Replacement Implants
12.2.2.1. Hip Replacement Implants
12.2.2.2. Knee Replacement Implants
12.2.2.3. Others
12.2.3. Others
12.3. Market Value Forecast, by End-user, 2016–2026
12.3.1. Veterinary Hospitals & Clinics
12.3.2. Research Institutes
12.4. Market Value Forecast, by Country, 2016–2026
12.4.1. Brazil
12.4.2. Mexico
12.4.3. Rest of Latin America
12.5. Market Attractiveness Analysis
12.5.1. By Product
12.5.2. By End-user
12.5.3. By Country
13. Middle East & Africa Veterinary Orthopedic Implant Market Analysis and Forecast
13.1. Introduction
13.1.1. Key Findings
13.2. Market Value Forecast, by Product, 2016–2026
13.2.1. Veterinary Plates & Screws
13.2.2. Joint Replacement Implants
13.2.2.1. Hip Replacement Implants
13.2.2.2. Knee Replacement Implants
13.2.2.3. Others
13.2.3. Others
13.3. Market Value Forecast, by End-user, 2016–2026
13.3.1. Veterinary Hospitals & Clinics
13.3.2. Research Institutes
13.4. Market Value Forecast, by Country, 2016–2026
13.4.1. GCC Countries
13.4.2. South Africa
13.4.3. Rest of Middle East & Africa
13.5. Market Attractiveness Analysis
13.5.1. By Product
13.5.2. By End-user
13.5.3. By Country
14. Competition Landscape
14.1. Company Profiles
14.1.1. B. Braun Melsungen AG
14.1.2. Johnson & Johnson
14.1.3. Veterinary Orthopedic Implants, Inc.
14.1.4. BioMedtrix, LLC
14.1.5. KYON Veterinary Surgical Products
14.1.6. IMEX Veterinary, Inc.
14.1.7. Orthomed (UK) Ltd
14.1.8. Securos Surgical
Table 01: Animal Population (Mn), by Key Country, in 2017
Table 02: Global Veterinary Orthopedic Implant Market Value (US$ Mn) Forecast, by Product, 2016–2026
Table 03: Global Veterinary Orthopedic Implant Market Value (US$ Mn) Forecast, by Joint Replacement Implants, 2016–2026
Table 04: Global Veterinary Orthopedic Implant Market Revenue (US$ Mn) Forecast, by End-user, 2016–2026
Table 05: Global Veterinary Orthopedic Implant Market Revenue (US$ Mn) Forecast, by Region, 2016–2026
Table 06: North America Veterinary Orthopedic Implant Market Value (US$ Mn) Forecast, by Country, 2016–2026
Table 07: North America Veterinary Orthopedic Implant Market Value (US$ Mn) Forecast, by Product, 2016–2026
Table 08: North America Veterinary Orthopedic Implant Market Value (US$ Mn) Forecast, by Joint Replacement Implants, 2016–2026
Table 09: North America Veterinary Orthopedic Implant Market Value (US$ Mn) Forecast, by End-user, 2016–2026
Table 10: Europe Veterinary Orthopedic Implant Market Value (US$ Mn) Forecast, by Country, 2016–2026
Table 11: Europe Veterinary Orthopedic Implant Market Value (US$ Mn) Forecast, by Product, 2016–2026
Table 12: Europe Veterinary Orthopedic Implant Market Value (US$ Mn) Forecast, by Joint Replacement Implants, 2016–2026
Table 13: Europe Veterinary Orthopedic Implant Market Value (US$ Mn) Forecast, by End-user, 2016–2026
Table 14: Asia Pacific Veterinary Orthopedic Implant Market Value (US$ Mn) Forecast, by Country, 2016–2026
Table 15: Asia Pacific Veterinary Orthopedic Implant Market Value (US$ Mn) Forecast, by Product, 2016–2026
Table 16: Asia Pacific Veterinary Orthopedic Implant Market Value (US$ Mn) Forecast, by Joint Replacement Implants, 2016–2026
Table 17: Asia Pacific Veterinary Orthopedic Implant Market Value (US$ Mn) Forecast, by End-user, 2016–2026
Table 18: Latin America Veterinary Orthopedic Implant Market Value (US$ Mn) Forecast, by Country, 2016–2026
Table 19: Latin America Veterinary Orthopedic Implant Market Value (US$ Mn) Forecast, by Product, 2016–2026
Table 20: Latin America Veterinary Orthopedic Implant Market Value (US$ Mn) Forecast, by Joint Replacement Implants, 2016–2026
Table 21: Latin America Veterinary Orthopedic Implant Market Value (US$ Mn) Forecast, by End-user, 2016–2026
Table 22: Middle East & Africa Veterinary Orthopedic Implant Market Value (US$ Mn) Forecast, by Country, 2016–2026
Table 23: Middle East & Africa Veterinary Orthopedic Implant Market Value (US$ Mn) Forecast, by Product, 2016–2026
Table 24: Middle East & Africa Veterinary Orthopedic Implant Market Value (US$ Mn) Forecast, by Joint Replacement Implants, 2016–2026
Table 25: Middle East & Africa Veterinary Orthopedic Implant Market Value (US$ Mn) Forecast, by End-user, 2016–2026
Figure 01: Global Veterinary Orthopedic Implant Market Snapshot
Figure 02: Global Veterinary Orthopedic Implant Market Revenue (%), by Region, 2017 (A)
Figure 03: Global Veterinary Orthopedic Implant Market Value (US$ Mn) Forecast and Y-o-Y Growth (%), 2016–2026
Figure 04: Market Value Share, by Product (2017)
Figure 05: Market Value Share, by End-user (2017)
Figure 06: Market Value Share, by Region (2017)
Figure 07: Global Veterinary Orthopedic Implant Market Value Share Analysis, by Product, 2017 and 2026
Figure 08: Global Veterinary Orthopedic Implant Market Revenue (US$ Mn) Forecast and Y-o-Y Growth (%) Projection, Veterinary Plates & Screws, by 2016–2026
Figure 09: Global Veterinary Orthopedic Implant Market Revenue (US$ Mn) Forecast and Y-o-Y Growth (%) Projection, Joint Replacement Implants, by 2016–2026
Figure 10: Global Veterinary Orthopedic Implant Market Revenue (US$ Mn) Forecast and Y-o-Y Growth (%) Projection, Others, by 2016–2026
Figure 11: Global Veterinary Orthopedic Implant Market Revenue (US$ Mn) Forecast and Y-o-Y Growth (%) Projection, Hip Replacement Implants, by 2016–2026
Figure 12: Global Veterinary Orthopedic Implant Market Revenue (US$ Mn) Forecast and Y-o-Y Growth (%) Projection, Knee Replacement Implants, by 2016–2026
Figure 13: Global Veterinary Orthopedic Implant Market Revenue (US$ Mn) Forecast and Y-o-Y Growth (%) Projection, Others, by 2016–2026
Figure 14: Global Veterinary Orthopedic Implant Market Attractiveness Analysis, by Product
Figure 15: Global Veterinary Orthopedic Implant Market Value Share (%), by End-user, 2017 and 2026
Figure 16: Global Veterinary Orthopedic Implant Market Revenue (US$ Mn) Forecast and Y-o-Y Growth (%) Projection, by Veterinary Hospitals & Clinics, 2016–2026
Figure 17: Global Veterinary Orthopedic Implant Market Revenue (US$ Mn) Forecast and Y-o-Y Growth (%) Projection, by Research Institutes, 2016–2026
Figure 18: Global Veterinary Orthopedic Implant Market Attractiveness, by End-user, 2018–2026
Figure 19: Global Market Scenario
Figure 20: Global Veterinary Orthopedic Implant Market Value Share (%), by Region, 2018 and 2026
Figure 21: Global Veterinary Orthopedic Implant Market Attractiveness, by Region, 2018–2026
Figure 23: North America Veterinary Orthopedic Implant Market Value (US$ Mn) Forecast and Y-o-Y Growth (%) Projection, 2016–2026
Figure 24: North America Veterinary Orthopedic Implant Market Value Share (%), by Country, 2017 and 2026
Figure 25: North America Veterinary Orthopedic Implant Market Attractiveness, by Country, 2018–2026
Figure 26: North America Veterinary Orthopedic Implant Market Value Share (%), by Product, 2017 and 2026
Figure 27: North America Veterinary Orthopedic Implant Market Attractiveness, by Product, 2018–2026
Figure 28: North America Veterinary Orthopedic Implant Market Value Share (%), by Joint Replacement Implants, 2017 and 2026
Figure 29: North America Veterinary Orthopedic Implant Market Attractiveness, by Joint Replacement Implants, 2018–2026
Figure 30: North America Veterinary Orthopedic Implant Market Value Share (%), by End-user, 2017 and 2026
Figure 31: North America Veterinary Orthopedic Implant Market Attractiveness, by End-user, 2018–2026
Figure 32: Europe Veterinary Orthopedic Implant Market Value (US$ Mn) Forecast and Y-o-Y Growth (%) Projection, 2016–2026
Figure 33: Europe Veterinary Orthopedic Implant Market Value Share (%), by Country, 2017 and 2026
Figure 34: Europe Veterinary Orthopedic Implant Market Attractiveness, by Country, 2018–2026
Figure 35: Europe Veterinary Orthopedic Implant Market Value Share (%), by Product, 2017 and 2026
Figure 36: Europe Veterinary Orthopedic Implant Market Attractiveness, by Product, 2018–2026
Figure 37: Europe Veterinary Orthopedic Implant Market Value Share (%), by Joint Replacement Implants, 2017 and 2026
Figure 38: Europe Veterinary Orthopedic Implant Market Attractiveness, by Joint Replacement Implants, 2018–2026
Figure 39: Europe Veterinary Orthopedic Implant Market Value Share (%), by End-user, 2017 and 2026
Figure 40: Europe Veterinary Orthopedic Implant Market Attractiveness, by End-user, 2018–2026
Figure 41: Asia Pacific Veterinary Orthopedic Implant Market Value (US$ Mn) Forecast and Y-o-Y Growth (%) Projection, 2016–2026
Figure 42: Asia Pacific Veterinary Orthopedic Implant Market Value Share (%), by Country, 2017 and 2026
Figure 43: Asia Pacific Veterinary Orthopedic Implant Market Attractiveness, by Country, 2018–2026
Figure 44: Asia Pacific Veterinary Orthopedic Implant Market Value Share (%), by Product, 2017 and 2026
Figure 45: Asia Pacific Veterinary Orthopedic Implant Market Attractiveness, by Product, 2018–2026
Figure 46: Asia Pacific Veterinary Orthopedic Implant Market Value Share (%), by Joint Replacement Implants, 2017 and 2026
Figure 47: Asia Pacific Veterinary Orthopedic Implant Market Attractiveness, by Joint Replacement Implants, 2018–2026
Figure 48: Asia Pacific Veterinary Orthopedic Implant Market Value Share (%), by End-user, 2017 and 2026
Figure 49: Asia Pacific Veterinary Orthopedic Implant Market Attractiveness, by End-user, 2018–2026
Figure 50: Latin America Veterinary Orthopedic Implant Market Value (US$ Mn) Forecast and Y-o-Y Growth (%) Projection, 2016–2026
Figure 51: Latin America Veterinary Orthopedic Implant Market Value Share (%), by Country, 2017 and 2026
Figure 52: Latin America Veterinary Orthopedic Implant Market Attractiveness, by Country, 2018–2026
Figure 53: Latin America Veterinary Orthopedic Implant Market Value Share (%), by Product, 2017 and 2026
Figure 54: Latin America Veterinary Orthopedic Implant Market Attractiveness, by Product, 2018–2026
Figure 55: Latin America Veterinary Orthopedic Implant Market Value Share (%), by Joint Replacement Implants, 2017 and 2026
Figure 56: Latin America Veterinary Orthopedic Implant Market Attractiveness, by Joint Replacement Implants, 2018–2026
Figure 57: Latin America Veterinary Orthopedic Implant Market Value Share (%), by End-user, 2017 and 2026
Figure 58: Latin America Veterinary Orthopedic Implant Market Attractiveness, by End-user, 2018–2026
Figure 59: Middle East & Africa Veterinary Orthopedic Implant Market Value (US$ Mn) Forecast and Y-o-Y Growth (%) Projection, 2016–2026
Figure 60: Middle East & Africa Veterinary Orthopedic Implant Market Value Share (%), by Country, 2017 and 2026
Figure 61: Middle East & Africa Veterinary Orthopedic Implant Market Attractiveness, by Country, 2018–2026
Figure 62: Middle East & Africa Veterinary Orthopedic Implant Market Value Share (%), by Product, 2017 and 2026
Figure 63: Middle East & Africa Veterinary Orthopedic Implant Market Attractiveness, by Product, 2018–2026
Figure 64: Middle East & Africa Veterinary Orthopedic Implant Market Value Share (%), by Joint Replacement Implants, 2017 and 2026
Figure 65: Middle East & Africa Veterinary Orthopedic Implant Market Attractiveness, by Joint Replacement Implants, 2018–2026
Figure 66: Middle East & Africa Veterinary Orthopedic Implant Market Value Share (%), by End-user, 2017 and 2026
Figure 67: Middle East & Africa Veterinary Orthopedic Implant Market Attractiveness, by End-user, 2018–2026
Figure 68: B. Braun Melsungen AG Revenue (US$ Mn) and Y-o-Y Growth (%), 2014–2017
Figure 69: B. Braun Melsungen AG Breakdown of Net Sales (%), by Region/Country, 2017
Figure 70: B. Braun Melsungen AG Breakdown of Net Sales (%), by Business Segment, 2017
Figure 71: B. Braun Melsungen AG R&D Expenses (US$ Mn) and Y-o-Y Growth (%), 2013–2017
Figure 72: Johnson & Johnson Revenue (US$ Bn) & Y-o-Y Growth (%), 2014–2017
Figure 73: Johnson & Johnson Breakdown of Net Sales of Medical Devices Segment, by Region, 2017
Figure 74: Johnson & Johnson Breakdown of Net Sales, by Business Segment, 2017
Figure 75: Johnson & Johnson Research & Development Cost, 2015 – 2017 (US$ Bn)
Copyright © Transparency Market Research, Inc. All Rights reserved
Trust Online

Veterinary Orthopedic Implant Market
