Vascular diseases have high worldwide mortality, propelling advances in endovascular surgeries. Developing effective and long-term revascularization solutions has gathered immense attention among healthcare providers. Autologous arteries or veins as well as synthetic grafts have gained acceptance in the vascular grafts market. A key aim is to improve patency rates in such procedures. In this light, tissue-engineered vascular grafts are attracting attention and research interest among industry players. Though synthetic vascular prostheses have gained significant acceptance among the patient populations, some glaring limitations have hindered the commercialization scope of respective implant developers. Particularly, the marketplace hasn’t been so promising in regard to developing grafts for small-diameter vessels, which is less than 6 mm.
Autologous arteries or veins have emerged as the gold standards, but the failure rates in the last five years have alarmed researchers and proponents for tissue engineering. This has kicked in demand for in situ tissue engineering approaches. For such approaches to enter mainstream, the regulatory burden for clinical translation should be low. In this regard, cell-free scaffolds are showing some clinical potential. There are, however, several things to keep in focus for an adequate success rate, notably implant materials and subsequently the fabrication methods. Some of the common endpoints are hemocompatibility, an adequate microenvironment for tissue generation, and a good combination of elasticity and strength of the biomaterials. Perhaps the most important endpoint, which many players in the vascular grafts market have been pursuing, is overcoming compliance mismatch. In this regard, electrospinning is one of the widely used techniques of obtaining the graft. Several new approaches will shape the prospects of the market in coming months.
Though the body of research has been hindered by Covid-19 pandemic, which is still emerging, healthcare providers are optimistic of the rise in demand in the next few months. Moreover, several elective endovascular surgeries which might have been postponed might offer momentum in the times when the economies are opening with restrictions. Further, new vascular graft designs are likely to be tested in the market in not-so-distant future.
Vascular grafts are used to redirect blood flow from one part of the body to another by connecting blood vessels. Vascular grafting surgery is performed to treat ischemia caused by atherosclerosis, organ transplantation, or for vascular access in hemodialysis. However, demand for vascular grafts is anticipated to decline during the forecast period owing to increase in adverse effects like decellularized xenogeneic grafts increase the rate of infection, thrombosis, and aneurysms.
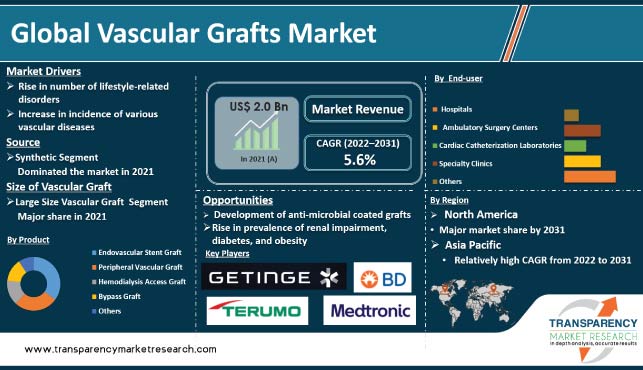
The global vascular grafts market was valued at US$ 2,010.1 Mn in 2017 and is projected to expand at a CAGR of 5.0% from 2018 to 2026 to reach US$ 3,000 Mn by 2026. High incidence rate of cardiovascular diseases, peripheral diseases, and rise in geriatric population are likely to fuel the growth of the global market from 2018 to 2026. Surge in government investment in health care infrastructure and strategic alliances among players to penetrate the emerging markets are expected to propel the global market during the forecast period.
In terms of product, the global vascular grafts market has been segmented into endovascular stent grafts, peripheral vascular grafts, hemodialysis access grafts, bypass grafts, and others. The endovascular stent grafts segment held the largest market share in 2017. Moreover, the segment is anticipated to expand at a high CAGR during the forecast period due to high demand for minimally invasive surgeries and rise in preference for stent grafts to treat atherosclerosis. Based on source, the global market has been classified into synthetic, biological, and biosynthetic. The synthetic segment is projected to dominate the global market during the forecast period owing to its good materialistic properties such as flexibility. In terms of size of vascular graft, the global vascular graft market has been bifurcated into large and small. The small segment is expected to expand at a high CAGR due to increase in focus of major players on the development of small size vascular grafts to treat narrow vascular atherosclerosis. Based on end-user, the global market has been divided into hospitals, ambulatory surgery centers, cardiac catheterization laboratories, specialty clinics, and others. The hospitals segment accounted for the largest market share in 2017. The segment is expected to expand at a significant CAGR during the forecast period.
North America is projected to account for major share of the global vascular grafts market from 2018 to 2026, supported by rise in prevalence of cardiovascular diseases and increase in the number of vascular surgeries. According to the Journal of Vascular Surgery (2012), critical limb ischemia is associated with significant cost to the U.S. health care system and is estimated to exceed US$ 3 Bn annually. According to data provided by the American College of Cardiology, more than 130 million adults in the U.S. are anticipated to have some form of cardiovascular diseases (CVD) by 2035, and the total cost of CVD is expected to reach US$ 1.1 Trn in 2035. The vascular graft market in Asia Pacific is likely to expand at a high CAGR during the forecast period due to increase in focus on development of health care infrastructure by both public and private hospitals and high cardiovascular patient pool in countries such as India and China.
Key companies operating in the global vascular grafts market and profiled in the report include W. L. Gore & Associates, Inc., Maquet Holding B.V. & Co. KG (Getinge Group), BD, LeMaitre Vascular, Inc., B. Braun Melsungen AG, Cook Medical, Medtronic plc, Artegraft, Inc., Vascutek Ltd., Vascular Graft Solution Ltd., Heat Medical Europe BV, and CryoLife, Inc.
1. Preface
1.1. Report Scope and Market Segmentation
1.2. Research Highlights
1.3. Assumptions and Acronyms Used
2. Research Methodology
3. Executive Summary
4. Market Overview
4.1. Introduction
4.2. Key Industry Evolution/Developments
4.3. Market Dynamics
4.3.1. Drivers
4.3.1.1. Increase in the Incidence of Target Diseases
4.3.1.2. Rise in the Number of Lifestyle-related Disorders
4.3.1.3. Increase in the Geriatric Population
4.3.1.4. Shift toward Value-based Health Care Model
4.3.1.5. Increase in Health Care Spending & Improvement in Health Care Infrastructure
4.3.2. Restraints
4.3.2.1. Stringent Regulatory Guidelines
4.3.2.2. Increase in Adverse Effects
4.3.2.3. Rise in Pricing Pressure
4.3.3. Opportunities
4.3.3.1. Rise in Cases of Renal Impairment, Diabetes, and Obesity
4.3.3.2. Increase in the Number of Potential Markets for Commercializing Vascular Grafts
4.3.3.3. Anti-microbial Coated Grafts
4.4. Global Vascular Market Analysis & Forecast, 2018–2026
4.4.1.1. Market Revenue Projections (US$ Mn)
5. Market Overview
5.1. Global Prevalence of Chronic Kidney Diseases
5.2. Global Prevalence of End-stage Renal Disorders (ESRD)
5.3. Patient Data for Dialysis
5.4. Global Prevalence of Cardiovascular Diseases
5.5. Overview of Cryopreservation Technique
5.6. Pipeline Analysis
6. Global Vascular Grafts Market, by Product
6.1. Introduction and Definitions
6.2. Key Findings
6.3. Global Vascular Grafts Market Analysis, by Product
6.4. Global Vascular Grafts Market Forecast, by Product
6.4.1. Endovascular Stent Grafts
6.4.2. Peripheral Vascular Grafts
6.4.3. Hemodialysis Access Grafts
6.4.4. Bypass Grafts
6.4.5. Others
6.5. Global Vascular Grafts Market Attractiveness Analysis, by Product
7. Global Vascular Grafts Market, by Source
7.1. Introduction and Definitions
7.2. Key Findings
7.3. Global Vascular Grafts Market Analysis, by Source
7.4. Global Vascular Grafts Market Forecast, by Source
7.4.1. Synthetic
7.4.1.1. Polytetrafluethylene (PTFE)
7.4.1.2. Polyurethane (PU)
7.4.1.3. Dacron
7.4.1.4. Others
7.4.2. Biological
7.4.2.1. Bovine Vein
7.4.2.2. Saphenous Vein
7.4.2.3. Others
7.4.3. Biosynthetic
7.4.3.1. Ovine Collagen with Polyester
7.4.3.2. Others
7.5. Global Vascular Grafts Market Attractiveness Analysis, by Source
8. Global Vascular Grafts Market Analysis and Forecast, by Size of Vascular Graft
8.1. Introduction & Definition
8.2. Key Findings / Developments
8.3. Global Vascular Grafts Market Analysis, by Size of Vascular Graft
8.4. Global Vascular Grafts Market Value Forecast, by Size of Vascular Graft, 2016–2026
8.4.1. Large
8.4.2. Small
8.5. Global Vascular Grafts Market Attractiveness Analysis, by Size of Vascular Graft
9. Global Vascular Grafts Market Analysis and Forecast, by Application
9.1. Introduction & Definition
9.2. Key Findings / Developments
9.3. Global Vascular Grafts Market Analysis, by Application
9.4. Global Vascular Grafts Market Value Forecast, by Application, 2016–2026
9.4.1. Coronary Artery Bypass
9.4.2. Aneurysm
9.4.3. Vascular Occlusion
9.4.4. Critical Limb Ischemia
9.4.5. Renal Failure
9.4.6. Others
9.5. Others Global Vascular Grafts Market Attractiveness Analysis, by Application
10. Global Vascular Grafts Market Analysis and Forecast, by End-user
10.1. Introduction & Definition
10.2. Key Findings / Developments
10.3. Global Vascular Grafts Market Analysis, by End-user
10.4. Global Vascular Grafts Market Value Forecast, by End-user, 2016–2026
10.4.1. Hospitals
10.4.2. Ambulatory Surgical Centers
10.4.3. Cardiac Catheterization Laboratories
10.4.4. Specialty Clinics
10.4.5. Others
10.4.6. Others Global Vascular Grafts Market Attractiveness Analysis, by End-user
11. Global Vascular Grafts Market Analysis and Forecast, by Region
11.1. Introduction & Definition
11.2. Key Findings / Developments
11.3. Market Value Forecast, by Region, 2016–2026
11.3.1. North America
11.3.2. Europe
11.3.3. Asia Pacific
11.3.4. Latin America
11.3.5. Middle East & Africa
11.4. Global Vascular Grafts Attractiveness Analysis, by Region
12. North America Vascular Grafts Market Analysis and Forecast, by Region
12.1. Key Findings
12.2. North America Vascular Grafts Market Overview
12.3. North America Vascular Grafts Market Value Share Analysis, by Country
12.4. North America Vascular Grafts Market Size and Forecast, by Country
12.4.1. U.S.
12.4.2. Canada
12.5. North America Vascular Grafts Market Value Share Analysis, by Product
12.6. North America Vascular Grafts Market Size and Forecast, by Product
12.6.1. Endovascular Stent Grafts
12.6.2. Peripheral Vascular Grafts
12.6.3. Hemodialysis Access Grafts
12.6.4. Bypass Grafts
12.6.5. Others
12.7. North America Vascular Grafts Market Value Share Analysis, by Source
12.8. North America Vascular Grafts Market Size and Forecast, by Source
12.8.1. Synthetic
12.8.1.1. Polytetrafluethylene (PTFE)
12.8.1.2. Polyurethane (PU)
12.8.1.3. Dacron
12.8.1.4. Others
12.8.2. Biological
12.8.2.1. Bovine Vein
12.8.2.2. Saphenous Vein
12.8.2.3. Others
12.8.3. Biosynthetic
12.8.3.1. Ovine Collagen with Polyester
12.8.3.2. Others
12.9. North America Vascular Grafts Market Value Share Analysis, by Size of Vascular Graft
12.10. North America Vascular Grafts Market Size and Forecast, by Size of Vascular Graft
12.10.1. Large
12.10.2. Small
12.11. North America Vascular Grafts Market Value Share Analysis, by Application
12.12. North America Vascular Grafts Market Size and Forecast, by Application
12.12.1. Coronary Artery Bypass
12.12.2. Aneurysm
12.12.3. Vascular Occlusion
12.12.4. Critical Limb Ischemia
12.12.5. Renal Failure
12.12.6. Others
12.13. North America Vascular Grafts Market Value Share Analysis, by End-User
12.14. North America Vascular Grafts Market Size and Forecast, by End-user
12.14.1. Hospitals
12.14.2. Ambulatory Surgical Centers
12.14.3. Cardiac Catheterization Laboratories
12.14.4. Specialty Clinics
12.14.5. Others
12.15. North America Vascular Grafts Market Size and Forecast, by Market Attractiveness
12.15.1. Product
12.15.2. Source
12.15.3. Size of Vascular Graft
12.15.4. Application
12.15.5. End-user
12.15.6. Country
13. Europe Vascular Grafts Market Analysis and Forecast, by Region
13.1. Key Findings
13.2. Europe Vascular Grafts Market Overview
13.3. Europe Vascular Grafts Market Value Share Analysis, by Country/Sub-region
13.4. Europe Vascular Grafts Market Size and Forecast, by Country/Sub-region
13.4.1. Germany
13.4.2. France
13.4.3. U.K.
13.4.4. Spain
13.4.5. Italy
13.4.6. Rest of Europe
13.5. Europe Vascular Grafts Market Value Share Analysis, by Product
13.6. Europe Vascular Grafts Market Size and Forecast, by Product
13.6.1. Endovascular Stent Grafts
13.6.2. Peripheral Vascular Grafts
13.6.3. Hemodialysis Access Grafts
13.6.4. Bypass Grafts
13.6.5. Others
13.7. Europe Vascular Grafts Market Value Share Analysis, by Source
13.8. Europe Vascular Grafts Market Size and Forecast, by Source
13.8.1. Synthetic
13.8.1.1. Polytetrafluethylene (PTFE)
13.8.1.2. Polyurethane (PU)
13.8.1.3. Dacron
13.8.1.4. Others
13.8.2. Biological
13.8.2.1. Bovine Vein
13.8.2.2. Saphenous Vein
13.8.2.3. Others
13.8.3. Biosynthetic
13.8.3.1. Ovine Collagen with Polyester
13.8.3.2. Others
13.9. Europe Vascular Grafts Market Value Share Analysis, by Size of Vascular Graft
13.10. Europe Vascular Grafts Market Size and Forecast, by Size of Vascular Graft
13.10.1. Large
13.10.2. Small
13.11. Europe Vascular Grafts Market Value Share Analysis, by Application
13.12. Europe Vascular Grafts Market Size and Forecast, by Application
13.12.1. Coronary Artery Bypass
13.12.2. Aneurysm
13.12.3. Vascular Occlusion
13.12.4. Critical Limb Ischemia
13.12.5. Renal Failure
13.12.6. Others
13.13. Europe Vascular Grafts Market Value Share Analysis, by End-User
13.14. Europe Vascular Grafts Market Size and Forecast, by End-user
13.14.1. Hospitals
13.14.2. Ambulatory Surgical Centers
13.14.3. Cardiac Catheterization Laboratories
13.14.4. Specialty Clinics
13.14.5. Others
13.15. Europe Vascular Grafts Market Size and Forecast, by Market Attractiveness
13.15.1. Product
13.15.2. Source
13.15.3. Size of Vascular Graft
13.15.4. Application
13.15.5. End-user
13.15.6. Country
14. Asia Pacific Vascular Grafts Market Analysis and Forecast, by Region
14.1. Key Findings
14.2. Asia Pacific Vascular Grafts Market Overview
14.3. Asia Pacific Vascular Grafts Market Value Share Analysis, by Country/Sub-region
14.4. Asia Pacific Vascular Grafts Market Size and Forecast, by Country/Sub-region
14.4.1. China
14.4.2. Japan
14.4.3. India
14.4.4. Australia & New Zealand
14.4.5. Rest of Asia Pacific
14.5. Asia Pacific Vascular Grafts Market Value Share Analysis, by Product
14.6. Asia Pacific Vascular Grafts Market Size and Forecast, by Product
14.6.1. Endovascular Stent Grafts
14.6.2. Peripheral Vascular Grafts
14.6.3. Hemodialysis Access Grafts
14.6.4. Bypass Grafts
14.6.5. Others
14.7. Asia Pacific Vascular Grafts Market Value Share Analysis, by Source
14.8. Asia Pacific Vascular Grafts Market Size and Forecast, by Source
14.8.1. Synthetic
14.8.1.1. Polytetrafluethylene (PTFE)
14.8.1.2. Polyurethane (PU)
14.8.1.3. Dacron
14.8.1.4. Others
14.8.2. Biological
14.8.2.1. Bovine Vein
14.8.2.2. Saphenous Vein
14.8.2.3. Others
14.8.3. Biosynthetic
14.8.3.1. Ovine Collagen with Polyester
14.8.3.2. Others
14.9. Asia Pacific Vascular Grafts Market Value Share Analysis, by Size of Vascular Graft
14.10. Asia Pacific Vascular Grafts Market Size and Forecast, by Size of Vascular Graft
14.10.1. Large
14.10.2. Small
14.11. Asia Pacific Vascular Grafts Market Value Share Analysis, by Application
14.12. Asia Pacific Vascular Grafts Market Size and Forecast, by Application
14.12.1. Coronary Artery Bypass
14.12.2. Aneurysm
14.12.3. Vascular Occlusion
14.12.4. Critical Limb Ischemia
14.12.5. Renal Failure
14.12.6. Others
14.13. Asia Pacific Vascular Grafts Market Value Share Analysis, by Application
14.14. Asia Pacific Vascular Grafts Market Size and Forecast, by Application
14.14.1. Hospitals
14.14.2. Ambulatory Surgical Centers
14.14.3. Cardiac Catheterization Laboratories
14.14.4. Specialty Clinics
14.14.5. Others
14.15. Asia Pacific Vascular Grafts Market Size and Forecast, by Market Attractiveness
14.15.1. Product
14.15.2. Source
14.15.3. Size of Vascular Graft
14.15.4. Application
14.15.5. End-user
14.15.6. Country/Sub-region
15. Latin America Vascular Grafts Market Analysis and Forecast, by Region
15.1. Key Findings
15.2. Latin America Vascular Grafts Market Overview
15.3. Latin America Vascular Grafts Market Value Share Analysis, by Country/Sub-region
15.4. Latin America Vascular Grafts Market Size and Forecast, by Country/Sub-region
15.4.1. Brazil
15.4.2. Mexico
15.4.3. Rest of Latin America
15.5. Latin America Vascular Grafts Market Value Share Analysis, by Product
15.6. Latin America Vascular Grafts Market Size and Forecast, by Product
15.6.1. Endovascular Stent Grafts
15.6.2. Peripheral Vascular Grafts
15.6.3. Hemodialysis Access Grafts
15.6.4. Bypass Grafts
15.6.5. Others
15.7. Latin America Vascular Grafts Market Value Share Analysis, by Source
15.8. Latin America Vascular Grafts Market Size and Forecast, by Source
15.8.1. Synthetic
15.8.1.1. Polytetrafluethylene (PTFE)
15.8.1.2. Polyurethane (PU)
15.8.1.3. Dacron
15.8.1.4. Others
15.8.2. Biological
15.8.2.1. Bovine Vein
15.8.2.2. Saphenous Vein
15.8.2.3. Others
15.8.3. Biosynthetic
15.8.3.1. Ovine Collagen with Polyester
15.8.3.2. Others
15.9. Latin America Vascular Grafts Market Value Share Analysis, by Size of Vascular Graft
15.10. Latin America Vascular Grafts Market Size and Forecast, by Size of Vascular Graft
15.10.1. Large
15.10.2. Small
15.11. Latin America Vascular Grafts Market Value Share Analysis, by Application
15.12. Latin America Vascular Grafts Market Size and Forecast, by Application
15.12.1. Coronary Artery Bypass
15.12.2. Aneurysm
15.12.3. Vascular Occlusion
15.12.4. Critical Limb Ischemia
15.12.5. Renal Failure
15.12.6. Others
15.13. Latin America Vascular Grafts Market Value Share Analysis, by End-user
15.14. Latin America Vascular Grafts Market Size and Forecast, by End-user
15.14.1. Hospitals
15.14.2. Ambulatory Surgical Centers
15.14.3. Cardiac Catheterization Laboratories
15.14.4. Specialty Clinics
15.14.5. Others
15.15. Latin America Vascular Grafts Market Size and Forecast, by Market Attractiveness
15.15.1. Product
15.15.2. Source
15.15.3. Size of Vascular Graft
15.15.4. Application
15.15.5. End-user
15.15.6. Country/Sub-region
16. Middle East & Africa Vascular Grafts Market Analysis and Forecast, by Region
16.1. Key Findings
16.2. Middle East & Africa Vascular Grafts Market Overview
16.3. Middle East & Africa Vascular Grafts Market Value Share Analysis, by Country/Sub-region
16.4. Middle East & Africa Vascular Grafts Market Size and Forecast, by Country/Sub-region
16.4.1. GCC Countries
16.4.2. South Africa
16.4.3. Rest of Middle East & Africa
16.5. Middle East & Africa Vascular Grafts Market Value Share Analysis, by Product
16.6. Middle East & Africa Vascular Grafts Market Size and Forecast, by Product
16.6.1. Endovascular Stent Grafts
16.6.2. Peripheral Vascular Grafts
16.6.3. Hemodialysis Access Grafts
16.6.4. Bypass Grafts
16.6.5. Others
16.7. Middle East & Africa Vascular Grafts Market Value Share Analysis, by Source
16.8. Middle East & Africa Vascular Grafts Market Size and Forecast, by Source
16.8.1. Synthetic
16.8.1.1. Polytetrafluethylene (PTFE)
16.8.1.2. Polyurethane (PU)
16.8.1.3. Dacron
16.8.1.4. Others
16.8.2. Biological
16.8.2.1. Bovine Vein
16.8.2.2. Saphenous Vein
16.8.2.3. Others
16.8.3. Biosynthetic
16.8.3.1. Ovine Collagen with Polyester
16.8.3.2. Others
16.9. Middle East & Africa Vascular Grafts Market Value Share Analysis, by Size of Vascular Graft
16.10. Middle East & Africa Vascular Grafts Market Size and Forecast, by Size of Vascular Graft
16.10.1. Large
16.10.2. Small
16.11. Middle East & Africa Vascular Grafts Market Value Share Analysis, by Application
16.12. Middle East & Africa Vascular Grafts Market Size and Forecast, by Application
16.12.1. Coronary Artery Bypass
16.12.2. Aneurysm
16.12.3. Vascular Occlusion
16.12.4. Critical Limb Ischemia
16.12.5. Renal Failure
16.12.6. Others
16.13. Middle East & Africa Vascular Grafts Market Value Share Analysis, by End-user
16.14. Middle East & Africa Vascular Grafts Market Size and Forecast, by End-user
16.14.1. Hospitals
16.14.2. Ambulatory Surgical Centers
16.14.3. Cardiac Catheterization Laboratories
16.14.4. Specialty Clinics
16.14.5. Others
16.15. Middle East & Africa Vascular Grafts Market Size and Forecast, by Market Attractiveness
16.15.1. Product
16.15.2. Source
16.15.3. Size of Vascular Graft
16.15.4. Application
16.15.5. End-user
16.15.6. Country/Sub-region
17. Competitive Landscape
17.1. Company Analysis
17.2. Competition Matrix
17.3. Company Profiles
17.3.1. LaMaitre Vascular, Inc.
17.3.1.1. Company Overview (HQ, Business Segments, Employee Strength)
17.3.1.2. Financial Overview
17.3.1.3. Product Portfolio
17.3.1.4. SWOT Analysis
17.3.1.5. Strategic Overview
17.3.2. B. Braun Melsungen AG
17.3.2.1. Company Overview (HQ, Business Segments, Employee Strength)
17.3.2.2. Financial Overview
17.3.2.3. Product Portfolio
17.3.2.4. SWOT Analysis
17.3.2.5. Strategic Overview
17.3.3. C. R. Bard, Inc.
17.3.3.1. Company Overview (HQ, Business Segments, Employee Strength)
17.3.3.2. Financial Overview
17.3.3.3. Product Portfolio
17.3.3.4. SWOT Analysis
17.3.3.5. Strategic Overview
17.3.4. Cook Medical
17.3.4.1. Company Overview (HQ, Business Segments, Employee Strength)
17.3.4.2. Financial Overview
17.3.4.3. Product Portfolio
17.3.4.4. SWOT Analysis
17.3.4.5. Strategic Overview
17.3.5. Medtronic plc
17.3.5.1. Company Overview (HQ, Business Segments, Employee Strength)
17.3.5.2. Financial Overview
17.3.5.3. Product Portfolio
17.3.5.4. SWOT Analysis
17.3.5.5. Strategic Overview
17.3.6. ArteGrafts, Inc.
17.3.6.1. Company Overview (HQ, Business Segments, Employee Strength)
17.3.6.2. Financial Overview
17.3.6.3. Product Portfolio
17.3.6.4. SWOT Analysis
17.3.6.5. Strategic Overview
17.3.7. Vascutek Ltd.
17.3.7.1. Company Overview (HQ, Business Segments, Employee Strength)
17.3.7.2. Financial Overview
17.3.7.3. Product Portfolio
17.3.7.4. SWOT Analysis
17.3.7.5. Strategic Overview
17.3.8. Vascular Grafts Solution Ltd.
17.3.8.1. Company Overview (HQ, Business Segments, Employee Strength)
17.3.8.2. Financial Overview
17.3.8.3. Product Portfolio
17.3.8.4. SWOT Analysis
17.3.8.5. Strategic Overview
17.3.9. Heart Medical Europe BV
17.3.9.1. Company Overview (HQ, Business Segments, Employee Strength)
17.3.9.2. Financial Overview
17.3.9.3. Product Portfolio
17.3.9.4. SWOT Analysis
17.3.9.5. Strategic Overview
17.3.10. W. L. Gore & Associates, Inc.
17.3.10.1. Company Overview (HQ, Business Segments, Employee Strength)
17.3.10.2. Financial Overview
17.3.10.3. Product Portfolio
17.3.10.4. SWOT Analysis
17.3.10.5. Strategic Overview
17.3.11. CryoLife, Inc.
17.3.11.1. Company Overview (HQ, Business Segments, Employee Strength)
17.3.11.2. Financial Overview
17.3.11.3. Product Portfolio
17.3.11.4. SWOT Analysis
17.3.11.5. Strategic Overview
17.3.12. Maquet Holding B.V. & Co. KG
17.3.12.1. Company Overview (HQ, Business Segments, Employee Strength)
17.3.12.2. Financial Overview
17.3.12.3. Product Portfolio
17.3.12.4. SWOT Analysis
17.3.12.5. Strategic Overview
List of Tables
Table 01: Global Vascular Grafts Market Size (US$ Mn) Forecast, by Product, 2016–2026
Table 02: Global Vascular Grafts Market Size (US$ Mn) Forecast, by Source, 2016–2026
Table 03: Global Vascular Grafts Market Size (US$ Mn) Forecast, by Synthetic, 2016–2026
Table 04: Global Vascular Grafts Market Size (US$ Mn) Forecast, by Biological, 2016–2026
Table 05: Global Vascular Grafts Market Size (US$ Mn) Forecast, by Biosynthetic, 2016–2026
Table 06: Global Vascular Grafts Market Size (US$ Mn) Forecast, by Size of Vascular Graft, 2016–2026
Table 07: Global Vascular Grafts Market Size (US$ Mn) Forecast, by Application, 2016–2026
Table 08: Global Vascular Grafts Market Size (US$ Mn) Forecast, by End-user, 2016–2026
Table 09: Global Vascular Grafts Market Size (US$ Mn) Forecast, by Region, 2016–2026
Table 10: North America Vascular Grafts Market Value (US$ Mn) Forecast, by Country, 2016–2026
Table 11: North America Vascular Grafts Market Value (US$ Mn) Forecast, by Product, 2016–2026
Table 12: North America Vascular Grafts Market Value (US$ Mn) Forecast, by Source, 2016–2026
Table 13: North America Vascular Grafts Market Value (US$ Mn) Forecast, by Synthetic, 2016–2026
Table 14: North America Vascular Grafts Market Value (US$ Mn) Forecast, by Biological, 2016–2026
Table 15: North America Vascular Grafts Market Value (US$ Mn) Forecast, by Biosynthetic, 2016–2026
Table 16: North America Vascular Grafts Market Value (US$ Mn) Forecast, by Size of Vascular Graft, 2016–2026
Table 17: North America Vascular Grafts Market Value (US$ Mn) Forecast, by Application, 2016–2026
Table 18: North America Vascular Grafts Market Value (US$ Mn) Forecast, by End-user, 2016–2026
Table 19: Europe Vascular Grafts Market Value (US$ Mn) Forecast, by Country/Sub-region, 2016–2026
Table 20: Europe Vascular Grafts Market Value (US$ Mn) Forecast, by Product, 2016–2026
Table 21: Europe Vascular Grafts Market Value (US$ Mn) Forecast, by Source, 2016–2026
Table 22: Europe Vascular Grafts Market Value (US$ Mn) Forecast, by Synthetic, 2016–2026
Table 23: Europe Vascular Grafts Market Value (US$ Mn) Forecast, by Biological, 2016–2026
Table 24: Europe Vascular Grafts Market Value (US$ Mn) Forecast, by Biosynthetic, 2016–2026
Table 25: Europe Vascular Grafts Market Value (US$ Mn) Forecast, by Size of Vascular Graft, 2016–2026
Table 26: Europe Vascular Grafts Market Size (US$ Mn) Forecast, by Application, 2016–2026
Table 27: Europe Vascular Grafts Market Size (US$ Mn) Forecast, by End-user, 2016–2026
Table 28: Asia Pacific Vascular Grafts Market Value (US$ Mn) Forecast, by Country/Sub-region, 2016–2026
Table 29: Asia Pacific Vascular Grafts Market Value (US$ Mn) Forecast, by Product, 2016–2026
Table 30: Asia Pacific Vascular Grafts Market Value (US$ Mn) Forecast, by Source, 2016–2026
Table 31: Asia Pacific Vascular Grafts Market Value (US$ Mn) Forecast, by Synthetic, 2016–2026
Table 32: Asia Pacific Vascular Grafts Market Value (US$ Mn) Forecast, by Biological, 2016–2026
Table 33: Asia Pacific Vascular Grafts Market Value (US$ Mn) Forecast, by Biosynthetic, 2016–2026
Table 34: Asia Pacific Vascular Grafts Market Value (US$ Mn) Forecast, by Size of Vascular Graft, 2016–2026
Table 35: Asia Pacific Vascular Grafts Market Value (US$ Mn) Forecast, by Application, 2016–2026
Table 36: Asia Pacific Vascular Grafts Market Value (US$ Mn) Forecast, by End-user, 2016–2026
Table 37: Latin America Vascular Grafts Market Value (US$ Mn) Forecast, by Country/Sub-region, 2016–2026
Table 38: Latin America Vascular Grafts Market Value (US$ Mn) Forecast, by Product, 2016–2026
Table 39: Latin America Vascular Grafts Market Value (US$ Mn) Forecast, by Source, 2016–2026
Table 40: Latin America Vascular Grafts Market Value (US$ Mn) Forecast, by Synthetic, 2016–2026
Table 41: Latin America Vascular Grafts Market Value (US$ Mn) Forecast, by Biological, 2016–2026
Table 42: Latin America Vascular Grafts Market Value (US$ Mn) Forecast, by Biosynthetic Source, 2016–2026
Table 43: Latin America Vascular Grafts Market Value (US$ Mn) Forecast, by Size of Vascular Graft, 2016–2026
Table 44: Latin America Vascular Grafts Market Value (US$ Mn) Forecast, by Application, 2016–2026
Table 45: Latin America Vascular Grafts Market Value (US$ Mn) Forecast, by End-user, 2016–2026
Table 46: Middle East & Africa Vascular Grafts Market Value (US$ Mn) Forecast, by Country/Sub-region, 2016–2026
Table 47: Middle East & Africa Vascular Grafts Market Value (US$ Mn) Forecast, by Product, 2016–2026
Table 48: Middle East & Africa Vascular Grafts Market Value (US$ Mn) Forecast, by Source, 2016–2026
Table 49: Middle East & Africa Vascular Grafts Market Value (US$ Mn) Forecast, by Synthetic, 2016–2026
Table 50: Middle East & Africa Vascular Grafts Market Value (US$ Mn) Forecast, by Biological, 2016–2026
Table 51: Middle East & Africa Vascular Grafts Market Value (US$ Mn) Forecast, by Biosynthetic, 2016–2026
Table 52: Middle East & Africa Vascular Grafts Market Value (US$ Mn) Forecast, by Size of Vascular Graft, 2016–2026
Table 53: Middle East & Africa Vascular Grafts Market Value (US$ Mn) Forecast, by Application, 2016–2026
Table 54: Middle East & Africa Vascular Grafts Market Value (US$ Mn) Forecast, by End-user, 2016–2026
List of Figures
Figure 01: Global Vascular Grafts Market Value (US$ Mn) and Distribution, by Region, 2017 and 2026
Figure 02: Market Snapshot of Global Vascular Grafts Market
Figure 03: Market Opportunity Map, Revenue Share, by Product
Figure 04: Market Opportunity Map, Revenue Share, by Source
Figure 05: Market Opportunity Map, Revenue Share, by Size of Vascular Graft
Figure 06: Market Opportunity Map, Revenue Share, by Application
Figure 07: Market Opportunity Map, Revenue Share, by End-user
Figure 08: Global Vascular Grafts Revenue (US$ Mn) Forecast and Y-o-Y Growth (%) Projection, 2016–2026
Figure 09: Vascular Grafts Market Value Share, by Product, 2017
Figure 10: Vascular Grafts Market Value Share, by Application, 2017
Figure 11: Vascular Grafts Market Value Share, by End-user, 2017
Figure 12: Vascular Grafts Market Value Share, by Source, 2017
Figure 13: Vascular Grafts Market Value Share, by Size of Vascular Graft, 2017
Figure 14: Vascular Grafts Market Value Share, by Region, 2017
Figure 15: Global Vascular Grafts Market Value Share, by Product, 2017 and 2026
Figure 16: Global Vascular Grafts Market Attractiveness, by Product, 2018–2026
Figure 17: Global Vascular Grafts Market Revenue (US$ Mn) and Y-o-Y Growth Projection (%), by Endovascular Stent Grafts, 2016–2026
Figure 18: Global Vascular Grafts Market Revenue (US$ Mn) and Y-o-Y Growth Projection (%), by Peripheral Vascular Grafts, 2016–2026
Figure 19: Global Vascular Grafts Market Revenue (US$ Mn) and Y-o-Y Growth Projection (%), by Hemodialysis Access Grafts, 2016–2026
Figure 20: Global Vascular Grafts Market Revenue (US$ Mn) and Y-o-Y Growth Projection (%), by Bypass Grafts, 2016–2026
Figure 21: Global Vascular Grafts Market Revenue (US$ Mn) and Y-o-Y Growth Projection (%), by Others, 2016–2026
Figure 22: Global Vascular Grafts Market Value Share, by Source, 2017 and 2026
Figure 23: Global Vascular Grafts Market Attractiveness, by Source, 2018–2026
Figure 24: Global Vascular Grafts Market Revenue (US$ Mn) and Y-o-Y Growth Projection (%), by Synthetic, 2016–2026
Figure 25: Global Vascular Grafts Market Revenue (US$ Mn) and Y-o-Y Growth Projection (%), by Biological, 2016–2026
Figure 26: Global Vascular Grafts Market Revenue (US$ Mn) and Y-o-Y Growth Projection (%), by Biosynthetic, 2016–2026
Figure 27: Global Vascular Grafts Market Value Share, by Size of Vascular Graft, 2017 and 2026
Figure 28: Global Vascular Grafts Market Attractiveness, by Size of Vascular Graft, 2018–2026
Figure 29: Global Vascular Grafts Revenue (US$ Mn) Forecast and Y-o-Y Growth (%) Projection, by Large, 2016–2026
Figure 30: Global Vascular Grafts Revenue (US$ Mn) Forecast and Y-o-Y Growth (%) Projection, by Small, 2016–2026
Figure 31: Global Vascular Grafts Market Value Share, by Application, 2017 and 2026
Figure 32: Global Vascular Grafts Market Attractiveness, by Application, 2018–2026
Figure 33: Global Vascular Grafts Market Revenue (US$ Mn) and Y-o-Y Growth Projection (%), by Coronary Artery Bypass, 2016–2026
Figure 34: Global Vascular Grafts Market Revenue (US$ Mn) and Y-o-Y Growth Projection (%), by Aneurysm, 2016–2026
Figure 35: Global Vascular Grafts Market Revenue (US$ Mn) and Y-o-Y Growth Projection (%), by Vascular Occlusion, 2016–2026
Figure 36: Global Vascular Grafts Market Revenue (US$ Mn) and Y-o-Y Growth Projection (%), by Renal Failure, 2016–2026
Figure 37: Global Vascular Grafts Market Revenue (US$ Mn) and Y-o-Y Growth Projection (%), by Critical Limb Ischemia, 2016–2026
Figure 38: Global Vascular Grafts Market Revenue (US$ Mn) and Y-o-Y Growth Projection (%), by Others, 2016–2026
Figure 39: Global Vascular Grafts Market Value Share, by End-user, 2017 and 2026
Figure 40: Global Vascular Grafts Market Attractiveness, by End-user, 2018–2026
Figure 41: Global Vascular Grafts Market Revenue (US$ Mn) and Y-o-Y Growth Projection (%), by Hospital, 2016–2026
Figure 42: Global Vascular Grafts Market Revenue (US$ Mn) and Y-o-Y Growth Projection (%), by Ambulatory Surgical Centers, 2016–2026
Figure 43: Global Vascular Grafts Market Revenue (US$ Mn) and Y-o-Y Growth Projection (%), by Cardiac Catheterization Laboratories, 2016–2026
Figure 44: Global Vascular Grafts Market Revenue (US$ Mn) and Y-o-Y Growth Projection (%), by Specialty Clinics, 2016–2026
Figure 45: Global Vascular Grafts Market Revenue (US$ Mn) and Y-o-Y Growth Projection (%), by Others, 2016–2026
Figure 46: Global Vascular Grafts Market Value Share, by Region, 2017 and 2026
Figure 47: Global Vascular Grafts Market Attractiveness, by Region, 2018–2026
Figure 48: North America Vascular Grafts Market Value (US$ Mn) Forecast and Y-o-Y Growth Projection (%), 2016–2026
Figure 49: North America Vascular Grafts Market Attractiveness, by Country, 2018–2026
Figure 50: North America Vascular Grafts Market Value Share, by Country, 2017 and 2026
Figure 51: North America Vascular Grafts Market Value Share, by Product, 2017 and 2026
Figure 52: North America Vascular Grafts Market Attractiveness, by Product, 2018–2026
Figure 53: North America Vascular Grafts Market Value Share Analysis, by Source, 2017 and 2026
Figure 54: North America Vascular Grafts Market Attractiveness, by Source, 2018–2026
Figure 55: North America Vascular Grafts Market Value Share Analysis, by Size of Vascular Graft, 2017 and 2026
Figure 56: North America Vascular Grafts Market Attractiveness, by Size of Vascular Graft, 2018–2026
Figure 57: North America Vascular Grafts Market Value Share, by Application, 2017 and 2026
Figure 58: North America Vascular Grafts Market Attractiveness, by Application, 2018–2026
Figure 59: North America Vascular Grafts Market Value Share, by End-user, 2017 and 2026
Figure 60: North America Vascular Grafts Market Attractiveness, by End-user, 2018–2026
Figure 61: Europe Vascular Grafts Market Value (US$ Mn) Forecast and Y-o-Y Growth Projection (%), 2016–2026
Figure 62: Europe Vascular Grafts Market Value Share (%), by Country/Sub-region, 2017 and 2026
Figure 63: Europe Vascular Grafts Market Attractiveness, by Country/Sub-region, 2018–2026
Figure 64: Europe Vascular Grafts Market Value Share, by Product, 2017 and 2026
Figure 65: Europe Vascular Grafts Market Attractiveness, by Product, 2018–2026
Figure 66: Europe Vascular Grafts Market Value Share Analysis, by Source, 2017 and 2026
Figure 67: Europe Vascular Grafts Market Attractiveness, by Source, 2018–2026
Figure 68: Europe Vascular Grafts Market Value Share Analysis, by Size of Vascular Graft, 2017 and 2026
Figure 69: Europe Vascular Grafts Market Attractiveness, by Size of Vascular Graft, 2018–2026
Figure 70: Europe Vascular Grafts Market Value Share, by Application, 2017 and 2026
Figure 71: Europe Vascular Grafts Market Attractiveness, by Application, 2018–2026
Figure 72: Europe Vascular Grafts Market Value Share, by End-user, 2017 and 2026
Figure 73: Europe Vascular Grafts Market Attractiveness, by End-user, 2018–2026
Figure 74: Asia Pacific Vascular Grafts Market Value (US$ Mn) Forecast and Y-o-Y Growth Projection (%), 2016–2026
Figure 75: Asia Pacific Vascular Grafts Market Attractiveness, by Country/Sub-region, 2018–2026
Figure 76: Asia Pacific Vascular Grafts Market Value Share, by Country/Sub-region, 2017 and 2026
Figure 77: Asia Pacific Vascular Grafts Market Value Share, by Product, 2017 and 2026
Figure 78: Asia Pacific Vascular Grafts Market Attractiveness,
Figure 79: Asia Pacific Vascular Grafts Market Value Share Analysis, by Source, 2017 and 2026
Figure 80: Asia Pacific Vascular Grafts Market Attractiveness, by Source, 2018–2026
Figure 81: Asia Pacific Vascular Grafts Market Value Share Analysis, by Size of Vascular Graft, 2017 and 2026
Figure 82: Asia Pacific Vascular Grafts Market Attractiveness, by Size of Vascular Graft, 2018–2026
Figure 83: Asia Pacific Vascular Grafts Market Value Share, by Application, 2017 and 2026
Figure 84: Asia Pacific Vascular Grafts Market Attractiveness, by Application, 2018–2026
Figure 85: Asia Pacific Vascular Grafts Market Value Share, by End-user, 2017 and 2026
Figure 86: Asia Pacific Vascular Grafts Market Attractiveness, by End-user, 2018–2026
Figure 87: Latin America Vascular Grafts Market Value (US$ Mn) Forecast and Y-o-Y Growth (%), 2016–2026
Figure 88: Latin America Vascular Grafts Market Value Share, by Country/Sub-region, 2017 and 2026
Figure 89: Latin America Vascular Grafts Market Attractiveness, by Country/Sub-region, 2018–2026
Figure 90: Latin America Vascular Grafts Market Value Share, by Product, 2017 and 2026
Figure 91: Latin America Vascular Grafts Market Attractiveness,
Figure 92: Latin America Vascular Grafts Market Value Share, by Source, 2017 and 2026
Figure 93: Latin America Vascular Grafts Market Attractiveness, by Source, 2018–2026
Figure 94: Latin America Vascular Grafts Market Value Share Analysis, by Size of Vascular Graft, 2017 and 2026
Figure 95: Latin America Vascular Grafts Market Attractiveness, by Size of Vascular Graft, 2018–2026
Figure 96: Latin America Vascular Grafts Market Value Share, by Application, 2017 and 2026
Figure 97: Latin America Vascular Grafts Market Attractiveness, by Application, 2018–2026
Figure 98: Latin America Vascular Grafts Market Value Share, by End-user, 2017 and 2026
Figure 99: Latin America Vascular Grafts Market Attractiveness, by End-user, 2018–2026
Figure 100: Middle East & Africa Vascular Grafts Market Value (US$ Mn) Forecast and Y-o-Y Growth (%), 2016–2026
Figure 101: Middle East & Africa Vascular Grafts Market Value Share, by Country/Sub-region, 2017 and 2026
Figure 102: Middle East & Africa Vascular Grafts Market Attractiveness, by Country/Sub-region, 2018–2026
Figure 103: Middle East & Africa Vascular Grafts Market Value Share, by Product, 2017 and 2026
Figure 104: Middle East & Africa Vascular Grafts Market Attractiveness, by Product, 2018–2026
Figure 105: Middle East & Africa Vascular Grafts Market Value Share, by Source, 2017 and 2026
Figure 106: Middle East & Africa Vascular Grafts Market Attractiveness, by Source, 2018–2026
Figure 107: Middle East & Africa Vascular Grafts Market Value Share Analysis, by Size of Vascular Graft, 2017 and 2026
Figure 108: Middle East & Africa Vascular Grafts Market Attractiveness, by Size of Vascular Graft, 2018–2026
Figure 109: Middle East & Africa Vascular Grafts Market Value Share, by Application, 2017 and 2026
Figure 110: Middle East & Africa Vascular Grafts Market Attractiveness, by Application, 2018–2026
Figure 111: Middle East & Africa Vascular Grafts Market Value Share, by End-user, 2017 and 2026
Figure 112: Middle East & Africa Vascular Grafts Market Attractiveness, by End-user, 2018–2026
Copyright © Transparency Market Research, Inc. All Rights reserved
Trust Online

Vascular Grafts Market
