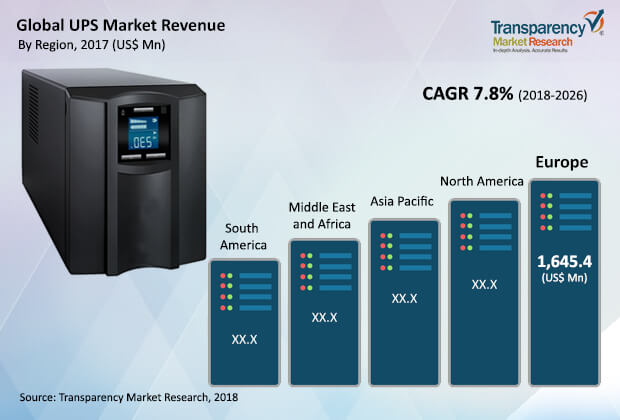
The global UPS market is currently driven by growing frequency of power fluctuations and growth in number of data centers and cloud storage utilization. Demand for power backup solutions in small and large scale industries is increasing considerably to protect sensitive equipment from the adverse effects of grid power fluctuations. Need for UPS systems in hospitals and factories are also growing, where power failures lead to critical situations. Advancements in UPS systems such as lithium-ion technology, transformer-less UPS, and modular UPS are likely to have strong influence on market growth over the forecast period. In 2017, the global UPS market was valued at US$ 5,539.2 Mn and is anticipated to reach US$ 10,745.9 Mn by 2026, expanding at a CAGR of 7.8%during the forecast period from 2018 to 2026.
These days, there are many reasons for power failures such as natural causes, short circuits, and other causes including man-made outages because of which power cuts are becoming more and more frequent. Electrical equipment faces potential danger from both severe weather and poor voltage quality that can cause slow equipment degradation or instantaneous loss of data stored on the equipment. The most frequent blackouts occur in emerging economies including South Asia, due to underinvestment on energy infrastructures. To cope with electricity failures and fluctuations, adoption of UPS has increased in order to protect various electronic equipment. Data centers require continuous power supply to protect the operational data & IT equipment and to keep cooling systems running.
Global expansion of wireless internet connectivity and penetration of affordable smartphones have resulted in rapidly-increasing data traffic. Hence, data centers are being constructed across emerging countries such as China and India at lower costs. To efficiently manage IT equipment and avoid any data or equipment loss due to power failures or disruptions, data centers are expected to be highest adopters of Uninterruptible Power Sources (UPS) solutions during the forecast period.
However, the high installation and maintenance cost is likely to be a limiting factor for the UPS market growth. Installing Uninterruptible Power Supplies (UPS) requires major initial capital investment which varies as per application and kVA range. Attaching many UPS batteries to an existing wiring system will give an efficient power supply to the system. Nonetheless, market players are making efforts toward providing flexible, energy efficient, and high load capacity features in UPS. Further, growth of smart home technology creates huge growth opportunity for the UPS market
Many players are increasing their share through strategic mergers & acquisitions and partnerships with several industries, paying attention to expand their market and necessary requirement. In June 2017, Schneider Electric expanded its Galaxy V-Series Uninterruptible Power Supply (UPS) product portfolio for data center and industrial applications in order to achieve high density and efficient power protection. Some of the prominent players identified in the UPS market includes - Schneider Electric SE, Eaton Corporation Plc., Emerson Electric Company, Uninterruptible Power Supplies Ltd., Legrand, Vertiv Co., ABB Ltd.,Luminous Power Technologies, Mitsubishi Electric Corporation, and Delta Power Solutions.
1. Preface
1.1.Market Definition and Scope
1.2. Market Segmentation
1.3. Key Research Objectives
1.4. Research Highlights
2. Assumptions and Research Methodology
3. Executive Summary: Global UPS Market
4. Market Overview
4.1. Introduction
4.1.1. Industry Evolution/Developments
4.2. Market Dynamics
4.2.1. Drivers
4.2.2. Restraints
4.2.3. Opportunities
4.3. Key Trends Analysis
4.4. Global UPS Market Analysis and Forecast, 2016 - 2026
4.4.1. Market Revenue Projections (US$ Mn)
4.4.2. Market Volume Projections (Thousand Units)
4.5. Porter’s Five Forces Analysis - Global UPS Market
4.6. Value Chain Analysis
4.7. 3C Analysis
4.8. Market Outlook
5. Global UPS Market Analysis and Forecast, By Type
5.1. Overview & Definitions
5.2. UPS Market Size (US$ Mn and Thousand Units) Forecast, by Type, 2016 - 2026
5.2.1. Offline
5.2.2. Online
5.2.3. Line Interactive
5.3. Market Attractiveness by Type
6. Global UPS Market Analysis and Forecast, by kVA Range
6.1. Overview & Definition
6.2. UPS Market Size (US$ Mn and Thousand Units) Forecast, by KVA Range, 2016 - 2026
6.2.1. Less Than 5kVA
6.2.2. 5.1-20 kVA
6.2.3. 20.1-60 kVA
6.2.4. 60.1- 200 kVA
6.2.5. Above 200 kVA
6.3. Market Attractiveness by kVA Range
7. Global UPS Market Analysis and Forecast, by Application
7.1. Overview & Definitions
7.2. UPS Market Size (US$ Mn and Thousand Units) Forecast, by Application, 2016 - 2026
7.2.1. Data Center & Facility UPS
7.2.2. Industrial UPS
7.2.3. Marine UPS
7.2.4. Network, Server & Storage UPS
7.2.5. PC, Workstation & Home UPS
7.2.6. Others
7.3. Market Attractiveness by Application
8. Global UPS Market Analysis and Forecast, by Region
8.1. Key Findings
8.2. UPS Market Size (US$ Mn and Thousand Units) Forecast, by Region, 2016 - 2026
8.2.1. North America
8.2.2. Europe
8.2.3. Asia Pacific
8.2.4. Middle East &Africa
8.2.5. South America
8.3. Market Attractiveness by Country/Region
9. North America UPS Market Analysis and Forecast
9.1. Key Findings
9.2. UPS Market Size (US$ Mn and Thousand Units) Forecast, by Type, 2016 - 2026
9.2.1. Offline
9.2.2. Online
9.2.3. Line Interactive
9.3. UPS Market Size (US$ Mn and Thousand Units) Forecast, by KVA Range, 2016 - 2026
9.3.1. Less Than 5kVA
9.3.2. 5.1-20 kVA
9.3.3. 20.1-60 kVA
9.3.4. 60.1- 200 kVA
9.3.5. Above 200 kVA
9.4. UPS Market Size (US$ Mn and Thousand Units) Forecast, by Application, 2016 - 2026
9.4.1. Data Center & Facility UPS
9.4.2. Industrial UPS
9.4.3. Marine UPS
9.4.4. Network, Server & Storage UPS
9.4.5. PC, Workstation & Home UPS
9.4.6. Others
9.5. UPS Market Size (US$ Mn and Thousand Units) Forecast, by Country, 2016 - 2026
9.5.1. The U.S.
9.5.2. Canada
9.5.3. Rest of North America
9.6. U.S. UPS Market Size (US$ Mn and Thousand Units) Forecast, by Type, 2016 - 2026
9.6.1. Offline
9.6.2. Online
9.6.3. Line Interactive
9.7. U.S. UPS Market Size (US$ Mn and Thousand Units) Forecast, by KVA Range, 2016 - 2026
9.7.1. Less Than 5kVA
9.7.2. 5.1-20 kVA
9.7.3. 20.1-60 kVA
9.7.4. 60.1- 200 kVA
9.7.5. Above 200 kVA
9.8. U.S. UPS Market Size (US$ Mn and Thousand Units) Forecast, by Application, 2016 - 2026
9.8.1. Data Center & Facility UPS
9.8.2. Industrial UPS
9.8.3. Marine UPS
9.8.4. Network, Server & Storage UPS
9.8.5. PC, Workstation & Home UPS
9.8.6. Others
9.9. Canada UPS Market Size (US$ Mn and Thousand Units) Forecast, by Type, 2016 - 2026
9.9.1. Offline
9.9.2. Online
9.9.3. Line Interactive
9.10. Canada UPS Market Size (US$ Mn and Thousand Units) Forecast, by KVA Range, 2016 - 2026
9.10.1. Less Than 5kVA
9.10.2. 5.1-20 kVA
9.10.3. 20.1-60 kVA
9.10.4. 60.1- 200 kVA
9.10.5. Above 200 kVA
9.11. Canada UPS Market Size (US$ Mn and Thousand Units) Forecast, by Application, 2016 - 2026
9.11.1. Data Center & Facility UPS
9.11.2. Industrial UPS
9.11.3. Marine UPS
9.11.4. Network, Server & Storage UPS
9.11.5. PC, Workstation & Home UPS
9.11.6. Others
9.12. Rest of North America UPS Market Size (US$ Mn and Thousand Units) Forecast, by Type, 2016 - 2026
9.12.1. Offline
9.12.2. Online
9.12.3. Line Interactive
9.13. Rest of North America UPS Market Size (US$ Mn and Thousand Units) Forecast, by KVA Range, 2016 - 2026
9.13.1. Less Than 5kVA
9.13.2. 5.1-20 kVA
9.13.3. 20.1-60 kVA
9.13.4. 60.1- 200 kVA
9.13.5. Above 200 kVA
9.14. Rest of North America UPS Market Size (US$ Mn and Thousand Units) Forecast, by Application, 2016 - 2026
9.14.1. Data Center & Facility UPS
9.14.2. Industrial UPS
9.14.3. Marine UPS
9.14.4. Network, Server & Storage UPS
9.14.5. PC, Workstation & Home UPS
9.14.6. Others
9.15. Market Attractiveness Analysis
9.15.1. By Type
9.15.2. By kVA Range
9.15.3. By Application
9.15.4. ByCountry
10. Europe UPS Market Analysis and Forecast
10.1. Key Findings
10.2. UPS Market Size (US$ Mn and Thousand Units) Forecast, by Type, 2016 - 2026
10.2.1. Offline
10.2.2. Online
10.2.3. Line Interactive
10.3. UPS Market Size (US$ Mn and Thousand Units) Forecast, by KVA Range, 2016 - 2026
10.3.1. Less Than 5kVA
10.3.2. 5.1-20 kVA
10.3.3. 20.1-60 kVA
10.3.4. 60.1- 200 kVA
10.3.5. Above 200 kVA
10.4. UPS Market Size (US$ Mn and Thousand Units) Forecast, by Application, 2016 - 2026
10.4.1. Data Center & Facility UPS
10.4.2. Industrial UPS
10.4.3. Marine UPS
10.4.4. Network, Server & Storage UPS
10.4.5. PC, Workstation & Home UPS
10.4.6. Others
10.5. UPS Market Size (US$ Mn and Thousand Units) Forecast, by Country, 2016 - 2026
10.5.1. Germany
10.5.2. U.K.
10.5.3. France
10.5.4. Rest of Europe
10.6. Germany UPS Market Size (US$ Mn and Thousand Units) Forecast, by Type, 2016 - 2026
10.6.1. Offline
10.6.2. Online
10.6.3. Line Interactive
10.7. Germany UPS Market Size (US$ Mn and Thousand Units) Forecast, by KVA Range, 2016 - 2026
10.7.1. Less Than 5kVA
10.7.2. 5.1-20 kVA
10.7.3. 20.1-60 kVA
10.7.4. 60.1- 200 kVA
10.7.5. Above 200 kVA
10.8. Germany UPS Market Size (US$ Mn and Thousand Units) Forecast, by Application, 2016 - 2026
10.8.1. Data Center & Facility UPS
10.8.2. Industrial UPS
10.8.3. Marine UPS
10.8.4. Network, Server & Storage UPS
10.8.5. PC, Workstation & Home UPS
10.8.6. Others
10.9. U.K. UPS Market Size (US$ Mn and Thousand Units) Forecast, by Type, 2016 - 2026
10.9.1. Offline
10.9.2. Online
10.9.3. Line Interactive
10.10. U.K. UPS Market Size (US$ Mn and Thousand Units) Forecast, by KVA Range, 2016 - 2026
10.10.1. Less Than 5kVA
10.10.2. 5.1-20 kVA
10.10.3. 20.1-60 kVA
10.10.4. 60.1- 200 kVA
10.10.5. Above 200 kVA
10.11. U.K. UPS Market Size (US$ Mn and Thousand Units) Forecast, by Application, 2016 - 2026
10.11.1. Data Center & Facility UPS
10.11.2. Industrial UPS
10.11.3. Marine UPS
10.11.4. Network, Server & Storage UPS
10.11.5. PC, Workstation & Home UPS
10.11.6. Others
10.12. France UPS Market Size (US$ Mn and Thousand Units) Forecast, by Type, 2016 - 2026
10.12.1. Offline
10.12.2. Online
10.12.3. Line Interactive
10.13. France UPS Market Size (US$ Mn and Thousand Units) Forecast, by KVA Range, 2016 - 2026
10.13.1. Less Than 5kVA
10.13.2. 5.1-20 kVA
10.13.3. 20.1-60 kVA
10.13.4. 60.1- 200 kVA
10.13.5. Above 200 kVA
10.14. France UPS Market Size (US$ Mn and Thousand Units) Forecast, by Application, 2016 - 2026
10.14.1. Data Center & Facility UPS
10.14.2. Industrial UPS
10.14.3. Marine UPS
10.14.4. Network, Server & Storage UPS
10.14.5. PC, Workstation & Home UPS
10.14.6. Others
10.15. Rest of Europe UPS Market Size (US$ Mn and Thousand Units) Forecast, by Type, 2016 - 2026
10.15.1. Offline
10.15.2. Online
10.15.3. Line Interactive
10.16. Rest of Europe UPS Market Size (US$ Mn and Thousand Units) Forecast, by KVA Range, 2016 - 2026
10.16.1. Less Than 5kVA
10.16.2. 5.1-20 kVA
10.16.3. 20.1-60 kVA
10.16.4. 60.1- 200 kVA
10.16.5. Above 200 kVA
10.17. Rest of Europe UPS Market Size (US$ Mn and Thousand Units) Forecast, by Application, 2016 - 2026
10.17.1. Data Center & Facility UPS
10.17.2. Industrial UPS
10.17.3. Marine UPS
10.17.4. Network, Server & Storage UPS
10.17.5. PC, Workstation & Home UPS
10.17.6. Others
10.18. Market Attractiveness Analysis
10.18.1. By Type
10.18.2. By kVA Range
10.18.3. By Application
10.18.4. ByCountry
11. Asia Pacific UPS Market Analysis and Forecast
11.1. Key Findings
11.2. UPS Market Size (US$ Mn and Thousand Units) Forecast, by Type, 2016 - 2026
11.2.1. Offline
11.2.2. Online
11.2.3. Line Interactive
11.3. UPS Market Size (US$ Mn and Thousand Units) Forecast, by KVA Range, 2016 - 2026
11.3.1. Less Than 5kVA
11.3.2. 5.1-20 kVA
11.3.3. 20.1-60 kVA
11.3.4. 60.1- 200 kVA
11.3.5. Above 200 kVA
11.4. UPS Market Size (US$ Mn and Thousand Units) Forecast, by Application, 2016 - 2026
11.4.1. Data Center & Facility UPS
11.4.2. Industrial UPS
11.4.3. Marine UPS
11.4.4. Network, Server & Storage UPS
11.4.5. PC, Workstation & Home UPS
11.4.6. Others
11.5. UPS Market Size (US$ Mn and Thousand Units) Forecast, by Country, 2016 - 2026
11.5.1. China
11.5.2. India
11.5.3. Japan
11.5.4. South Korea
11.5.5. Rest of APAC
11.6. China UPS Market Size (US$ Mn and Thousand Units) Forecast, by Type, 2016 - 2026
11.6.1. Offline
11.6.2. Online
11.6.3. Line Interactive
11.7. China UPS Market Size (US$ Mn and Thousand Units) Forecast, by KVA Range, 2016 - 2026
11.7.1. Less Than 5kVA
11.7.2. 5.1-20 kVA
11.7.3. 20.1-60 kVA
11.7.4. 60.1- 200 kVA
11.7.5. Above 200 kVA
11.8. China UPS Market Size (US$ Mn and Thousand Units) Forecast, by Application, 2016 - 2026
11.8.1. Data Center & Facility UPS
11.8.2. Industrial UPS
11.8.3. Marine UPS
11.8.4. Network, Server & Storage UPS
11.8.5. PC, Workstation & Home UPS
11.8.6. Others
11.9. India UPS Market Size (US$ Mn and Thousand Units) Forecast, by Type, 2016 - 2026
11.9.1. Offline
11.9.2. Online
11.9.3. Line Interactive
11.10. India UPS Market Size (US$ Mn and Thousand Units) Forecast, by KVA Range, 2016 - 2026
11.10.1. Less Than 5kVA
11.10.2. 5.1-20 kVA
11.10.3. 20.1-60 kVA
11.10.4. 60.1- 200 kVA
11.10.5. Above 200 kVA
11.11. India UPS Market Size (US$ Mn and Thousand Units) Forecast, by Application, 2016 - 2026
11.11.1. Data Center & Facility UPS
11.11.2. Industrial UPS
11.11.3. Marine UPS
11.11.4. Network, Server & Storage UPS
11.11.5. PC, Workstation & Home UPS
11.11.6. Others
11.12. Japan UPS Market Size (US$ Mn and Thousand Units) Forecast, by Type, 2016 - 2026
11.12.1. Offline
11.12.2. Online
11.12.3. Line Interactive
11.13. Japan UPS Market Size (US$ Mn and Thousand Units) Forecast, by KVA Range, 2016 - 2026
11.13.1. Less Than 5kVA
11.13.2. 5.1-20 kVA
11.13.3. 20.1-60 kVA
11.13.4. 60.1- 200 kVA
11.13.5. Above 200 kVA
11.14. Japan UPS Market Size (US$ Mn and Thousand Units) Forecast, by Application, 2016 - 2026
11.14.1. Data Center & Facility UPS
11.14.2. Industrial UPS
11.14.3. Marine UPS
11.14.4. Network, Server & Storage UPS
11.14.5. PC, Workstation & Home UPS
11.14.6. Others
11.15. South Korea UPS Market Size (US$ Mn and Thousand Units) Forecast, by Type, 2016 - 2026
11.15.1. Offline
11.15.2. Online
11.15.3. Line Interactive
11.16. South Korea UPS Market Size (US$ Mn and Thousand Units) Forecast, by KVA Range, 2016 - 2026
11.16.1. Less Than 5kVA
11.16.2. 5.1-20 kVA
11.16.3. 20.1-60 kVA
11.16.4. 60.1- 200 kVA
11.16.5. Above 200 kVA
11.17. South Korea UPS Market Size (US$ Mn and Thousand Units) Forecast, by Application, 2016 - 2026
11.17.1. Data Center & Facility UPS
11.17.2. Industrial UPS
11.17.3. Marine UPS
11.17.4. Network, Server & Storage UPS
11.17.5. PC, Workstation & Home UPS
11.17.6. Others
11.18. Rest of Asia Pacific UPS Market Size (US$ Mn and Thousand Units) Forecast, by Type, 2016 - 2026
11.18.1. Offline
11.18.2. Online
11.18.3. Line Interactive
11.19. Rest of Asia Pacific UPS Market Size (US$ Mn and Thousand Units) Forecast, by KVA Range, 2016 - 2026
11.19.1. Less Than 5kVA
11.19.2. 5.1-20 kVA
11.19.3. 20.1-60 kVA
11.19.4. 60.1- 200 kVA
11.19.5. Above 200 kVA
11.20. Rest of Asia Pacific UPS Market Size (US$ Mn and Thousand Units) Forecast, by Application, 2016 - 2026
11.20.1. Data Center & Facility UPS
11.20.2. Industrial UPS
11.20.3. Marine UPS
11.20.4. Network, Server & Storage UPS
11.20.5. PC, Workstation & Home UPS
11.20.6. Others
11.21. Market Attractiveness Analysis
11.21.1. By Type
11.21.2. By kVA Range
11.21.3. By Application
11.21.4. ByCountry
12. Middle East & Africa UPS Market Analysis and Forecast
12.1. Key Findings
12.2. UPS Market Size (US$ Mn and Thousand Units) Forecast, by Type, 2016 - 2026
12.2.1. Offline
12.2.2. Online
12.2.3. Line Interactive
12.3. UPS Market Size (US$ Mn and Thousand Units) Forecast, by KVA Range, 2016 - 2026
12.3.1. Less Than 5kVA
12.3.2. 5.1-20 kVA
12.3.3. 20.1-60 kVA
12.3.4. 60.1- 200 kVA
12.3.5. Above 200 kVA
12.4. UPS Market Size (US$ Mn and Thousand Units) Forecast, by Application, 2016 - 2026
12.4.1. Data Center & Facility UPS
12.4.2. Industrial UPS
12.4.3. Marine UPS
12.4.4. Network, Server & Storage UPS
12.4.5. PC, Workstation & Home UPS
12.4.6. Others
12.5. UPS Market Size (US$ Mn and Thousand Units) Forecast, by Country, 2016 - 2026
12.5.1. GCC
12.5.2. South Africa
12.5.3. Rest of MEA
12.6. GCC UPS Market Size (US$ Mn and Thousand Units) Forecast, by Type, 2016 - 2026
12.6.1. Offline
12.6.2. Online
12.6.3. Line Interactive
12.7. GCC UPS Market Size (US$ Mn and Thousand Units) Forecast, by KVA Range, 2016 - 2026
12.7.1. Less Than 5kVA
12.7.2. 5.1-20 kVA
12.7.3. 20.1-60 kVA
12.7.4. 60.1- 200 kVA
12.7.5. Above 200 kVA
12.8. GCC UPS Market Size (US$ Mn and Thousand Units) Forecast, by Application, 2016 - 2026
12.8.1. Data Center & Facility UPS
12.8.2. Industrial UPS
12.8.3. Marine UPS
12.8.4. Network, Server & Storage UPS
12.8.5. PC, Workstation & Home UPS
12.8.6. Others
12.9. South Africa UPS Market Size (US$ Mn and Thousand Units) Forecast, by Type, 2016 - 2026
12.9.1. Offline
12.9.2. Online
12.9.3. Line Interactive
12.10. South Africa UPS Market Size (US$ Mn and Thousand Units) Forecast, by KVA Range, 2016 - 2026
12.10.1. Less Than 5kVA
12.10.2. 5.1-20 kVA
12.10.3. 20.1-60 kVA
12.10.4. 60.1- 200 kVA
12.10.5. Above 200 kVA
12.11. South Africa UPS Market Size (US$ Mn and Thousand Units) Forecast, by Application, 2016 - 2026
12.11.1. Data Center & Facility UPS
12.11.2. Industrial UPS
12.11.3. Marine UPS
12.11.4. Network, Server & Storage UPS
12.11.5. PC, Workstation & Home UPS
12.11.6. Others
12.12. Rest of Middle East & Africa UPS Market Size (US$ Mn and Thousand Units) Forecast, by Type, 2016 - 2026
12.12.1. Offline
12.12.2. Online
12.12.3. Line Interactive
12.13. Rest of Middle East & Africa UPS Market Size (US$ Mn and Thousand Units) Forecast, by KVA Range, 2016 - 2026
12.13.1. Less Than 5kVA
12.13.2. 5.1-20 kVA
12.13.3. 20.1-60 kVA
12.13.4. 60.1- 200 kVA
12.13.5. Above 200 kVA
12.14. Rest of Middle East & Africa UPS Market Size (US$ Mn and Thousand Units) Forecast, by Application, 2016 - 2026
12.14.1. Data Center & Facility UPS
12.14.2. Industrial UPS
12.14.3. Marine UPS
12.14.4. Network, Server & Storage UPS
12.14.5. PC, Workstation & Home UPS
12.14.6. Others
12.15. Market Attractiveness Analysis
12.15.1. By Type
12.15.2. By kVA Range
12.15.3. By Application
12.15.4. ByCountry
13. South America UPS Market Analysis and Forecast
13.1. Key Findings
13.2. UPS Market Size (US$ Mn and Thousand Units) Forecast, by Type, 2016 - 2026
13.2.1. Offline
13.2.2. Online
13.2.3. Line Interactive
13.3. UPS Market Size (US$ Mn and Thousand Units) Forecast, by KVA Range, 2016 - 2026
13.3.1. Less Than 5kVA
13.3.2. 5.1-20 kVA
13.3.3. 20.1-60 kVA
13.3.4. 60.1- 200 kVA
13.3.5. Above 200 kVA
13.4. UPS Market Size (US$ Mn and Thousand Units) Forecast, by Application, 2016 - 2026
13.4.1. Data Center & Facility UPS
13.4.2. Industrial UPS
13.4.3. Marine UPS
13.4.4. Network, Server & Storage UPS
13.4.5. PC, Workstation & Home UPS
13.4.6. Others
13.5. UPS Market Size (US$ Mn and Thousand Units) Forecast, by Country, 2016 - 2026
13.5.1. Brazil
13.5.2. Rest of South America
13.6. Brazil UPS Market Size (US$ Mn and Thousand Units) Forecast, by Type, 2016 - 2026
13.6.1. Offline
13.6.2. Online
13.6.3. Line Interactive
13.7. Brazil UPS Market Size (US$ Mn and Thousand Units) Forecast, by KVA Range, 2016 - 2026
13.7.1. Less Than 5kVA
13.7.2. 5.1-20 kVA
13.7.3. 20.1-60 kVA
13.7.4. 60.1- 200 kVA
13.7.5. Above 200 kVA
13.8. Brazil UPS Market Size (US$ Mn and Thousand Units) Forecast, by Application, 2016 - 2026
13.8.1. Data Center & Facility UPS
13.8.2. Industrial UPS
13.8.3. Marine UPS
13.8.4. Network, Server & Storage UPS
13.8.5. PC, Workstation & Home UPS
13.8.6. Others
13.9. Rest of South America UPS Market Size (US$ Mn and Thousand Units) Forecast, by Type, 2016 - 2026
13.9.1. Offline
13.9.2. Online
13.9.3. Line Interactive
13.10. Rest of South America UPS Market Size (US$ Mn and Thousand Units) Forecast, by KVA Range, 2016 -2026
13.10.1. Less Than 5kVA
13.10.2. 5.1-20 kVA
13.10.3. 20.1-60 kVA
13.10.4. 60.1- 200 kVA
13.10.5. Above 200 kVA
13.11. Rest of South America UPS Market Size (US$ Mn and Thousand Units) Forecast, by Application, 2016 - 2026
13.11.1. Data Center & Facility UPS
13.11.2. Industrial UPS
13.11.3. Marine UPS
13.11.4. Network, Server & Storage UPS
13.11.5. PC, Workstation & Home UPS
13.11.6. Others
13.12. Market Attractiveness Analysis
13.12.1. By Type
13.12.2. By kVA Range
13.12.3. By Application
13.12.4. ByCountry
14. Competition Landscape
14.1. Market Player – Competition Matrix
14.2. Market Revenue Share Analysis (%), by Company (2017)
14.3. Segmentation, Targeting & Positioning –Market Strategy
14.3.1. Power Distribution
14.3.2. Industrial
14.3.3. Renewable
14.3.4. New Business
15. Company Profiles (Details – Overview, Financials, SWOT Analysis, Strategy)
15.1.1. Eaton Corporation Plc
15.1.2. Schneider Electric
15.1.3. Emerson Electric Co.
15.1.4. Legrand SA
15.1.5. Uninterruptible Power Supplies Ltd
15.1.6. Vertiv Co.
15.1.7. Mitsubishi Electric Corporation
15.1.8. ABB Ltd
15.1.9. Luminous Power Technologies
15.1.10. Delta Power Solutions
16. Key Takeaways
List of Tables
Table 01: Global UPS Market Size (US$ Mn) Forecast, by Type, 2015–2025
Table 02: Global UPS Market Volume (Thousand Units) Forecast, by Type, 2015–2025
Table 03: Global UPS Market Size (US$ Mn) Forecast, by kVA Range, 2016–2026
Table 04: Global UPS Market Size (Thousand Units) Forecast, by kVA Range, 2015–2025
Table 05: Global UPS Market Size (US$ Mn) Forecast, by Application, 2016–2026
Table 06: Global UPS Market Size (Thousand Units) Forecast, by Application, 2016–2026
Table 07: Global UPS Market Size (US$ Mn) Forecast, by Region, 2016–2026
Table 08: Global UPS Market Size (Thousand Units) Forecast, by Region, 2015–2025
Table 09: North America UPS Market Size (US$ Mn) Forecast, by Type, 2016–2026
Table 10: North America UPS Market Volume (Thousand Units) Forecast, by Type, 2016–2026
Table 11: North America UPS Market Size (US$ Mn) Forecast, by kVA Range, 2016–2026
Table 12: North America UPS Market Size (Thousand Units) Forecast, by kVA Range, 2016–2026
Table 13: North America UPS Market Size (US$ Mn) Forecast, by Application, 2016–2026
Table 14: North America UPS Market Size (Thousand Units) Forecast, by Application, 2016–2026
Table 15: North America UPS Market Size (US$ Mn) Forecast, by Country/Region, 2015–2025
Table 16: North America UPS Market Size (Thousand Units) Forecast, by Country/Region, 2015–2025
Table 17: U.S. UPS Market Size (US$ Mn) Forecast, by Type, 2016–2026
Table 18: U.S. UPS Market Volume (Thousand Units) Forecast, by Type, 2016–2026
Table 19: U.S. UPS Market Size (US$ Mn) Forecast, by kVA Range, 2016–2026
Table 20: U.S. UPS Market Size (Thousand Units) Forecast, by kVA Range, 2016–2026
Table 21: U.S. UPS Market Size (US$ Mn) Forecast, by Application, 2016–2026
Table 22: U.S. UPS Market Size (Thousand Units) Forecast, by Application, 2016–2026
Table 23: Canada UPS Market Size (US$ Mn) Forecast, by Type, 2016–2026
Table 24: Canada UPS Market Volume (Thousand Units) Forecast, by Type, 2016–2026
Table 25: Canada UPS Market Size (US$ Mn) Forecast, by kVA Range, 2016–2026
Table 26: Canada UPS Market Size (Thousand Units) Forecast, by kVA Range, 2016–2026
Table 27: Canada UPS Market Size (US$ Mn) Forecast, by Application, 2016–2026
Table 28: Canada UPS Market Size (Thousand Units) Forecast, by Application, 2016–2026
Table 29: Rest of North America UPS Market Size (US$ Mn) Forecast, by Type, 2016–2026
Table 30: Table: Rest of North America UPS Market Volume (Thousand Units) Forecast, by Type, 2016–2026
Table 31: Rest of North America UPS Market Size (US$ Mn) Forecast, by kVA Range, 2016–2026
Table 32: Rest of North America UPS Market Size (Thousand Units) Forecast, by kVA Range, 2016–2026
Table 33: Rest of North America UPS Market Size (US$ Mn) Forecast, by Application, 2016–2026
Table 34: Rest of North America UPS Market Size (Thousand Units) Forecast, by Application, 2016–2026
Table 35: Europe UPS Market Size (US$ Mn) Forecast, by Type, 2016–2026
Table 36: Europe UPS Market Volume (Thousand Units) Forecast, by Type, 2016–2026
Table 37: Europe UPS Market Size (US$ Mn) Forecast, by kVA Range, 2016–2026
Table 38: Europe UPS Market Size (Thousand Units) Forecast, by kVA Range, 2016–2026
Table 39: Europe UPS Market Size (US$ Mn) Forecast, by Application, 2016–2026
Table 40: Europe UPS Market Size (Thousand Units) Forecast, by Application, 2016–2026
Table 41: Europe UPS Market Size (US$ Mn) Forecast, by Country/Region, 2016–2026
Table 42: Europe UPS Market Size (Thousand Units) Forecast, by Country/Region, 2016–2026
Table 43: U.K. UPS Market Size (US$ Mn) Forecast, by Type, 2016–2026
Table 44: U.K. UPS Market Volume (Thousand Units) Forecast, by Type, 2016–2026
Table 45: U.K. UPS Market Size (US$ Mn) Forecast, by kVA Range, 2016–2026
Table 46: U.K. UPS Market Size (Thousand Units) Forecast, by kVA Range, 2016–2026
Table 47: U.K. UPS Market Size (US$ Mn) Forecast, by Application, 2016–2026
Table 48: U.K. UPS Market Size (Thousand Units) Forecast, by Application, 2016–2026
Table 49: Germany UPS Market Size (US$ Mn) Forecast, by Type, 2016–2026
Table 50: Germany UPS Market Volume (Thousand Units) Forecast, by Type, 2016–2026
Table 51: Germany UPS Market Size (US$ Mn) Forecast, by kVA Range, 2016–2026
Table 52: Germany UPS Market Size (Thousand Units) Forecast, by kVA Range, 2016–2026
Table 53: Germany UPS Market Size (US$ Mn) Forecast, by Application, 2016–2026
Table 54: Germany UPS Market Size (Thousand Units) Forecast, by Application, 2016–2026
Table 55: France UPS Market Size (US$ Mn) Forecast, by Type, 2016–2026
Table 56: France UPS Market Volume (Thousand Units) Forecast, by Type, 2016–2026
Table 57: France UPS Market Size (US$ Mn) Forecast, by kVA Range, 2016–2026
Table 58: France UPS Market Size (Thousand Units) Forecast, by kVA Range, 2016–2026
Table 59: France UPS Market Size (US$ Mn) Forecast, by Application, 2016–2026
Table 60: France UPS Market Size (Thousand Units) Forecast, by Application, 2016–2026
Table 61: Rest of Europe UPS Market Size (US$ Mn) Forecast, by Type, 2016–2026
Table 62: Rest of Europe UPS Market Volume (Thousand Units) Forecast, by Type, 2016–2026
Table 63: Rest of Europe UPS Market Size (US$ Mn) Forecast, by kVA Range, 2016–2026
Table 64: Rest of Europe UPS Market Size (Thousand Units) Forecast, by kVA Range, 2016–2026
Table 65: Rest of Europe UPS Market Size (US$ Mn) Forecast, by Application, 2016–2026
Table 66: Rest of Europe UPS Market Size (Thousand Units) Forecast, by Application, 2016–2026
Table 67: Asia Pacific UPS Market Size (US$ Mn) Forecast, by Type, 2016–2026
Table 68: Asia Pacific UPS Market Volume (Thousand Units) Forecast, by Type, 2016–2026
Table 69: Asia Pacific UPS Market Size (US$ Mn) Forecast, by kVA Range, 2016–2026
Table 70: Asia Pacific UPS Market Size (Thousand Units) Forecast, by kVA Range, 2016–2026
Table 71: Asia Pacific UPS Market Size (US$ Mn) Forecast, by Application, 2016–2026
Table 72: Asia Pacific UPS Market Size (Thousand Units) Forecast, by Application, 2016–2026
Table 73: Asia Pacific UPS Market Size (US$ Mn) Forecast, by Country/Region, 2016–2026
Table 74: Asia Pacific UPS Market Size (Thousand Units) Forecast, by Country/Region, 2016–2026
Table 75: China UPS Market Size (US$ Mn) Forecast, by Type, 2016–2026
Table 76: China UPS Market Volume (Thousand Units) Forecast, by Type, 2016–2026
Table 77: China UPS Market Size (US$ Mn) Forecast, by kVA Range, 2016–2026
Table 78: China UPS Market Size (Thousand Units) Forecast, by kVA Range, 2016–2026
Table 79: China UPS Market Size (US$ Mn) Forecast, by Application, 2016–2026
Table 80: China UPS Market Size (Thousand Units) Forecast, by Application, 2016–2026
Table 81: India UPS Market Size (US$ Mn) Forecast, by Type, 2016–2026
Table 82: India UPS Market Volume (Thousand Units) Forecast, by Type, 2016–2026
Table 83: India UPS Market Size (US$ Mn) Forecast, by kVA Range, 2016–2026
Table 84: India UPS Market Size (Thousand Units) Forecast, by kVA Range, 2016–2026
Table 85: India UPS Market Size (US$ Mn) Forecast, by Application, 2016–2026
Table 86: India UPS Market Size (Thousand Units) Forecast, by Application, 2016–2026
Table 87: Japan UPS Market Size (US$ Mn) Forecast, by Type, 2016–2026
Table 88: Japan UPS Market Volume (Thousand Units) Forecast, by Type, 2016–2026
Table 89: Japan UPS Market Size (US$ Mn) Forecast, by kVA Range, 2016–2026
Table 90: Japan UPS Market Size (Thousand Units) Forecast, by kVA Range, 2016–2026
Table 91: Japan UPS Market Size (US$ Mn) Forecast, by Application, 2016–2026
Table 92: Japan UPS Market Size (Thousand Units) Forecast, by Application, 2016–2026
Table 93: South Korea UPS Market Size (US$ Mn) Forecast, by Type, 2016–2026
Table 94: South Korea UPS Market Volume (Thousand Units) Forecast, by Type, 2016–2026
Table 95: South Korea UPS Market Size (US$ Mn) Forecast, by kVA Range, 2016–2026
Table 96: South Korea UPS Market Size (Thousand Units) Forecast, by kVA Range, 2016–2026
Table 97: South Korea UPS Market Size (US$ Mn) Forecast, by Application, 2016–2026
Table 98: South Korea UPS Market Size (Thousand Units) Forecast, by Application, 2016–2026
Table 99: Rest of Asia Pacific UPS Market Size (US$ Mn) Forecast, by Type, 2016–2026
Table 100: Rest of Asia Pacific UPS Market Volume (Thousand Units) Forecast, by Type, 2016–2026
Table 101: Rest of Asia Pacific UPS Market Size (US$ Mn) Forecast, by kVA Range, 2016–2026
Table 102: Rest of Asia Pacific UPS Market Size (Thousand Units) Forecast, by kVA Range, 2016–2026
Table 103: Rest of Asia Pacific UPS Market Size (US$ Mn) Forecast, by Application, 2016–2026
Table 104: Rest of Asia Pacific UPS Market Size (Thousand Units) Forecast, by Application, 2016–2026
Table 105: Middle East & Africa UPS Market Size (US$ Mn) Forecast, by Type, 2016–2026
Table 106: Middle East & Africa UPS Market Volume (Thousand Units) Forecast, by Type, 2016–2026
Table 107: Middle East & Africa UPS Market Size (US$ Mn) Forecast, by kVA Range, 2016–2026
Table 108: Middle East & Africa UPS Market Size (Thousand Units) Forecast, by kVA Range, 2016–2026
Table 109: Middle East & Africa UPS Market Size (US$ Mn) Forecast, by Application, 2016–2026
Table 110: Middle East & Africa UPS Market Size (Thousand Units) Forecast, by Application, 2016–2026
Table 111: Middle East & Africa UPS Market Size (US$ Mn) Forecast, by Country/Region, 2016–2026
Table 112: Middle East & Africa UPS Market Size (Thousand Units) Forecast, by Country/Region, 2016–2026
Table 113: GCC UPS Market Size (US$ Mn) Forecast, by Type, 2016–2026
Table 114: GCC UPS Market Volume (Thousand Units) Forecast, by Type, 2016–2026
Table 115: GCC UPS Market Size (US$ Mn) Forecast, by kVA Range, 2016–2026
Table 116: GCC UPS Market Size (Thousand Units) Forecast, by kVA Range, 2016–2026
Table 117: GCC UPS Market Size (US$ Mn) Forecast, by Application, 2016–2026
Table 118: GCC UPS Market Size (Thousand Units) Forecast, by Application, 2016–2026
Table 119: South Africa UPS Market Size (US$ Mn) Forecast, by Type, 2016–2026
Table 120: South Africa UPS Market Volume (Thousand Units) Forecast, by Type, 2016–2026
Table 121: South Africa UPS Market Size (US$ Mn) Forecast, by kVA Range, 2016–2026
Table 122: South Africa UPS Market Size (Thousand Units) Forecast, by kVA Range, 2016–2026
Table 123: South Africa UPS Market Size (US$ Mn) Forecast, by Application, 2016–2026
Table 124: South Africa UPS Market Size (Thousand Units) Forecast, by Application, 2016–2026
Table 125: Rest of Middle East & Africa UPS Market Size (US$ Mn) Forecast, by Type, 2016–2026
Table 126: Rest of Middle East & Africa UPS Market Volume (Thousand Units) Forecast, by Type, 2016–2026
Table 127: Rest of Middle East & Africa UPS Market Size (US$ Mn) Forecast, by kVA Range, 2016–2026
Table 128: Rest of Middle East & Africa UPS Market Size (Thousand Units) Forecast, by kVA Range, 2016–2026
Table 129: Rest of Middle East & Africa UPS Market Size (US$ Mn) Forecast, by Application, 2016–2026
Table 130: Rest of Middle East & Africa UPS Market Size (Thousand Units) Forecast, by Application, 2016–2026
Table 131: South America UPS Market Size (US$ Mn) Forecast, by Type, 2016–2026
Table 132: South America UPS Market Volume (Thousand Units) Forecast, by Type, 2016–2026
Table 133: South America UPS Market Size (US$ Mn) Forecast, by kVA Range, 2016–2026
Table 134: South America UPS Market Size (Thousand Units) Forecast, by kVA Range, 2016–2026
Table 135: South America UPS Market Size (US$ Mn) Forecast, by Application, 2016–2026
Table 136: South America UPS Market Size (Thousand Units) Forecast, by Application, 2016–2026
Table 137: South America UPS Market Size (US$ Mn) Forecast, by Country/Region, 2016–2026
Table 138: South America UPS Market Size (Thousand Units) Forecast, by Country/Region, 2016–2026
Table 139: Brazil UPS Market Size (US$ Mn) Forecast, by Type, 2016–2026
Table 140: Brazil UPS Market Volume (Thousand Units) Forecast, by Type, 2016–2026
Table 141: Brazil UPS Market Size (US$ Mn) Forecast, by kVA Range, 2016–2026
Table 142: Brazil UPS Market Size (Thousand Units) Forecast, by kVA Range, 2016–2026
Table 143: Brazil UPS Market Size (US$ Mn) Forecast, by Application, 2016–2026
Table 144: Brazil UPS Market Size (Thousand Units) Forecast, by Application, 2016–2026
Table 145: Rest of South America UPS Market Size (US$ Mn) Forecast, by Type, 2016–2026
Table 146: Rest of South America UPS Market Volume (Thousand Units) Forecast, by Type, 2016–2026
Table 147: Rest of South America UPS Market Size (US$ Mn) Forecast, by kVA Range, 2016–2026
Table 148: Rest of South America UPS Market Size (Thousand Units) Forecast, by kVA Range, 2016–2026
Table 149: Rest of South America UPS Market Size (US$ Mn) Forecast, by Application, 2016–2026
Table 150: Rest of South America UPS Market Size (Thousand Units) Forecast, by Application, 2016–2026
List of Figures
Figure 1: Global UPS Market Size (US$ Mn) Forecast, 2016 - 2026
Figure 2: Global UPS Market Y-o-Y Growth (Value %) Forecast, 2016 - 2026
Figure 3: Global UPS Market Volume (Thousand Units) Forecast 2016 - 2026
Figure 4: Global UPS Market Y-o-Y Growth (Volume %) Forecast, 2016 - 2026
Figure 5: Market Value Share (Revenue) by Type (2017)
Figure 6: Market Value Share (Revenue) by Application (2017)
Figure 7: Market Value (Revenue) Share by kVA Range (2017)
Figure 8: Market Value Share (Revenue) by Region (2017)
Figure 9: Global UPS Market Revenue Share Analysis, by Type Range, 2018 and 2026
Figure 10: UPS Market, by Type, Offline
Figure 11: UPS Market, by Type, Online
Figure 12: UPS Market, by Type, Line Interactive
Figure 13: UPS Comparison Matrix, by Type
Figure 14: UPS Market Attractiveness Analysis, by Type
Figure 15: Global UPS Market Revenue Share Analysis, by kVA Range, 2018 and 2026
Figure 16: UPS Market, by kVA Range, Less than 5 kVA
Figure 17: UPS Market, by kVA Range, 5.1 – 20 kVA
Figure 19: UPS Market, by kVA Range, 20.1 – 60 kVA
Figure 20: UPS Market, by kVA Range, 60.1 – 200 kVA
Figure 21: UPS Market, by kVA Range, Above 200 kVA
Figure 22: UPS Comparison Matrix, by kVA Range
Figure 23: UPS Market Attractiveness Analysis, by kVA Range
Figure 24: Global UPS Market Revenue Share Analysis, by Application, 2018 and 2026
Figure 25: UPS Market, by Application, Data Centre & Facility UPS
Figure 26: UPS Market, by Application, Industrial UPS
Figure 27: UPS Market, by Application, Marine UPS
Figure 28: UPS Market, by Application, Network, Server & Storage UPS
Figure 29: UPS Market, by Application, PC, Workstation & Home UPS
Figure 30: UPS Market, by Application, Network, Server & Storage UPS
Figure 31: UPS Comparison Matrix, by Application
Figure 32: UPS Market Attractiveness Analysis, by Application
Figure 33: Global UPS Market Attractiveness Analysis by Region
Figure 34: North America UPS Market Size (US$ Mn) Forecast, 2018–2026
Figure 35: North America UPS Market Size Y-o-Y Growth Projections, 2018–2026
Figure 36: North America UPS Market Revenue Share Analysis, by Type, 2018 and 2026
Figure 37: North America UPS Market Revenue Share Analysis, by kVA Range, 2018 and 2026
Figure 38: North America UPS Market Revenue Share Analysis, by Application, 2018 and 2026
Figure 39: North America UPS Market Revenue Share Analysis, by Country/Region, 2018 and 2026
Figure 40: U.S. UPS Market Revenue Share Analysis, by Type, 2018 and 2026
Figure 41: U.S. UPS Market Revenue Share Analysis, by kVA Range, 2018 and 2026
Figure 42: U.S. UPS Market Revenue Share Analysis, by Application, 2018 and 2026
Figure 43: Canada UPS Market Revenue Share Analysis, by Type, 2018 and 2026
Figure 44: Canada UPS Market Revenue Share Analysis, by kVA Range, 2018 and 2026
Figure 45: Canada UPS Market Revenue Share Analysis, by Application, 2018 and 2026
Figure 46: Rest of North America UPS Market Revenue Share Analysis, by Type, 2018 and 2026
Figure 47: Rest of North America UPS Market Revenue Share Analysis, by kVA Range, 2018 and 2026
Figure 48: Rest of North America UPS Market Revenue Share Analysis, by Application, 2018 and 2026
Figure 49: North America UPS Market Attractiveness Analysis by Type
Figure 50: North America UPS Market Attractiveness Analysis by kVA Range
Figure 51: North America UPS Market Attractiveness Analysis by Application
Figure 52: North America UPS Market Attractiveness Analysis by Country/Region
Figure 53: Europe UPS Market Size (US$ Mn) Forecast, 2016–2026
Figure 54: Europe UPS Market Size Y-o-Y Growth Projections, 2016–2025
Figure 55: Europe UPS Market Revenue Share Analysis, by Type, 2018 and 2026
Figure 56: Europe UPS Market Revenue Share Analysis, by kVA Range, 2018 and 2026
Figure 57: Europe UPS Market Revenue Share Analysis, by Application, 2018 and 2026
Figure 58: Europe UPS Market Revenue Share Analysis, by Country/Region, 2018 and 2026
Figure 59: U.K. UPS Market Revenue Share Analysis, by Type, 2018 and 2026
Figure 60: U.K. UPS Market Revenue Share Analysis, by kVA Range, 2018 and 2026
Figure 61: U.K. UPS Market Revenue Share Analysis, by Application, 2018 and 2026
Figure 62: Germany UPS Market Revenue Share Analysis, by Type, 2018 and 2026
Figure 63: Germany UPS Market Revenue Share Analysis, by kVA Range, 2018 and 2026
Figure 64: Germany UPS Market Revenue Share Analysis, by Application, 2018 and 2026
Figure 65: France UPS Market Revenue Share Analysis, by Type, 2018 and 2026
Figure 66: France UPS Market Revenue Share Analysis, by kVA Range, 2018 and 2026
Figure 67: France UPS Market Revenue Share Analysis, by Application, 2018 and 2026
Figure 68: Rest of Europe UPS Market Revenue Share Analysis, by Type, 2018 and 2026
Figure 69: Rest of Europe UPS Market Revenue Share Analysis, by kVA Range, 2018 and 2026
Figure 70: Rest of Europe UPS Market Revenue Share Analysis, by Application, 2018 and 2026
Figure 71: Europe UPS Market Attractiveness Analysis by Application
Figure 72: Europe UPS Market Attractiveness Analysis by Type
Figure 73: Europe UPS Market Attractiveness Analysis by Country/Region
Figure 74: Europe UPS Market Attractiveness Analysis by kVA Range
Figure 75: Asia Pacific UPS Market Size (US$ Mn) Forecast, 2016–2026
Figure 76: Asia Pacific UPS Market Size Y-o-Y Growth Projections, 2016–2025
Figure 77: Asia Pacific UPS Market Revenue Share Analysis, by Type, 2018 and 2026
Figure 78: Asia Pacific UPS Market Revenue Share Analysis, by kVA Range, 2018 and 2026
Figure 79: Asia Pacific UPS Market Revenue Share Analysis, by Application, 2018 and 2026
Figure 80: Asia Pacific UPS Market Revenue Share Analysis, by Country/Region, 2018 and 2026
Figure 81: China UPS Market Revenue Share Analysis, by Type, 2018 and 2026
Figure 82: China UPS Market Revenue Share Analysis, by kVA Range, 2018 and 2026
Figure 83: China UPS Market Revenue Share Analysis, by Application, 2018 and 2026
Figure 84: India UPS Market Revenue Share Analysis, by Type, 2018 and 2026
Figure 85: India UPS Market Revenue Share Analysis, by kVA Range, 2018 and 2026
Figure 86: India UPS Market Revenue Share Analysis, by Application, 2018 and 2026
Figure 87: Japan UPS Market Revenue Share Analysis, by Type, 2018 and 2026
Figure 88: Japan UPS Market Revenue Share Analysis, by kVA Range, 2018 and 2026
Figure 89: Japan UPS Market Revenue Share Analysis, by Application, 2018 and 2026
Figure 90: South Korea UPS Market Revenue Share Analysis, by Type, 2018 and 2026
Figure 91: South Korea UPS Market Revenue Share Analysis, by kVA Range, 2018 and 2026
Figure 92: South Korea UPS Market Revenue Share Analysis, by Application, 2018 and 2026
Figure 93: Rest of Asia Pacific UPS Market Revenue Share Analysis, by Type, 2018 and 2026
Figure 94: Rest of Asia Pacific UPS Market Revenue Share Analysis, by kVA Range, 2018 and 2026
Figure 95: Rest of Asia Pacific UPS Market Revenue Share Analysis, by Application, 2018 and 2026
Figure 96: Asia Pacific UPS Market Attractiveness Analysis by Application
Figure 97: Asia Pacific UPS Market Attractiveness Analysis by Type
Figure 98: Asia Pacific UPS Market Attractiveness Analysis by Country/Region
Figure 99: Asia Pacific UPS Market Attractiveness Analysis by kVA Range
Figure 100: Middle East & Africa UPS Market Size (US$ Mn) Forecast, 2016–2026
Figure 101: Middle East & Africa UPS Market Size Y-o-Y Growth Projections, 2016–2025
Figure 102: Middle East & Africa UPS Market Revenue Share Analysis, by Type, 2018 and 2026
Figure 103: Middle East & Africa UPS Market Revenue Share Analysis, by kVA Range, 2018 and 2026
Figure 104: Middle East & Africa UPS Market Revenue Share Analysis, by Application, 2018 and 2026
Figure 105: Middle East & Africa UPS Market Revenue Share Analysis, by Country/Region, 2018 and 2026
Figure 106: GCC UPS Market Revenue Share Analysis, by Type, 2018 and 2026
Figure 107: GCC UPS Market Revenue Share Analysis, by kVA Range, 2018 and 2026
Figure 108: GCC UPS Market Revenue Share Analysis, by Application, 2018 and 2026
Figure 109: South Africa UPS Market Revenue Share Analysis, by Type, 2018 and 2026
Figure 110: South Africa UPS Market Revenue Share Analysis, by kVA Range, 2018 and 2026
Figure 111: South Africa UPS Market Revenue Share Analysis, by Application, 2018 and 2026
Figure 112: Rest of Middle East & Africa UPS Market Revenue Share Analysis, by Type, 2018 and 2026
Figure 113: Rest of Middle East & Africa UPS Market Revenue Share Analysis, by kVA Range, 2018 and 2026
Figure 114: Rest of Middle East & Africa UPS Market Revenue Share Analysis, by Application, 2018 and 2026
Figure 115: Middle East & Africa UPS Market Attractiveness Analysis by Application
Figure 116: Middle East & Africa UPS Market Attractiveness Analysis by Type
Figure 117: Middle East & Africa UPS Market Attractiveness Analysis by Country/Region
Figure 118: Middle East & Africa UPS Market Attractiveness Analysis by kVA Range
Figure 119: South America UPS Market Size (US$ Mn) Forecast, 2016–2026
Figure 120: South America UPS Market Size Y-o-Y Growth Projections, 2016–2025
Figure 121: South America UPS Market Revenue Share Analysis, by Type, 2018 and 2026
Figure 122: South America UPS Market Revenue Share Analysis, by kVA Range, 2018 and 2026
Figure 123: South America UPS Market Revenue Share Analysis, by Application, 2018 and 2026
Figure 124: South America UPS Market Revenue Share Analysis, by Country/Region, 2018 and 2026
Figure 125: Brazil UPS Market Revenue Share Analysis, by Type, 2018 and 2026
Figure 126: Brazil UPS Market Revenue Share Analysis, by kVA Range, 2018 and 2026
Figure 127: Brazil UPS Market Revenue Share Analysis, by Application, 2018 and 2026
Figure 128: Rest of South America UPS Market Revenue Share Analysis, by Type, 2018 and 2026
Figure 129: Rest of South America UPS Market Revenue Share Analysis, by kVA Range, 2018 and 2026
Figure 130: Rest of South America UPS Market Revenue Share Analysis, by Application, 2018 and 2026
Figure 131: South America UPS Market Attractiveness Analysis by Application
Figure 132: South America UPS Market Attractiveness Analysis by Type
Figure 133: South America UPS Market Attractiveness Analysis by Country/Region
Figure 134: South America UPS Market Attractiveness Analysis by kVA Range
Copyright © Transparency Market Research, Inc. All Rights reserved
Trust Online

UPS Market
