Global Thermal Energy Flow Metering Solutions Market: Snapshot
The global thermal energy flow metering solutions market is highly competitive on account of the presence of a number of manufacturers. In order to stay ahead of the curve, players are expending time and money on product innovation. They are adding more features and functions to their products in order to entice buyers. Low barriers to entry of aspiring players is also serving to make the market competitive.
Majorly fuelling the global thermal energy flow metering solutions market is the thrust by many countries on onsite power generation and solar thermal energy in order to cut down their annual fossil fuel import and up energy security. Further serving to contribute to the market is the surging popularity of sustainable buildings and green buildings and the rampant urbanization which has resulted in pressing need for adequate water supply.
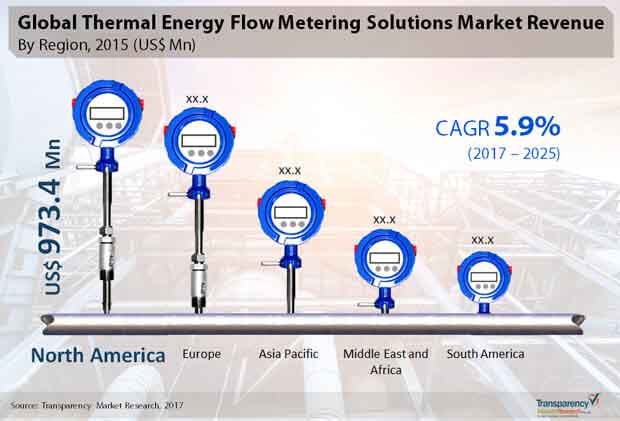
On the flipside, however, rising adoption of hybrid metering systems is expected to crimp sales of thermal energy flow meters in the next couple of years. A report by Transparency Market Research forecasts the global thermal energy flow metering solutions to rise at a CAGR of 5.9% from 2017 to 2025 to become worth US$4.706 bn by 2025.
Portable Thermal Energy Flow Metering Solutions to Expand at Healthy Clip in Upcoming Years
The global market for thermal energy flow metering solutions can be segmented based on different parameters. Depending upon type, the global thermal energy flow metering solutions market can be segmented into portable, insertion, and inline. Among them, the portable segment is expected to expand at a healthy clip in the next couple of years.
Rapid Industrialization Makes Europe Leading Region
From a geographical standpoint, Europe accounts for a leading share in the global thermal energy flow metering solutions market and it is trailed by North America. Rapid industrialization is one of the primary reasons for the growth in the market in the two regions. The chemical and wastewater industries, particularly, are at the forefront of driving demand for flow meters in the two regions. In Europe, expansion of multinational companies in countries of Germany, the U.K., and France, rising investments in capital projects, and launch of cutting edge flow meters have boosted growth in the market.
In terms of growth rate, Asia-Pacific is expected to surpass all other regions in the global thermal energy flow metering solutions market. This is mainly because of the technological progress and industrialization, coupled with concerns over the environment, which has necessitated continuous emissions monitoring systems in countries of Japan, China, and India. This has served to boost the market in the region. Substantial demand for measuring meters in oil and gas industry is also proving beneficial for the market.
The Middle East and Africa and South America too are expected to grow at an impressive pace in the global thermal flow metering solutions market on the back of rising demand from the commercial and residential segment. In the Middle East and Africa, the wirelessly connected data collection tools, technologies, devices and sensors are the fastest growing segments. South America is anticipated to grow at a steady CAGR during the forecast period as well.
Some of the prominent savvy companies operating in the global thermal energy flow metering solutions market are QMC, ABB Ltd, Elster Water, Siemens, Enercare Connections Inc., Fluid Components LLC, Emerson Electric Co., Kamstrup Group, Sage Metering, Landis+Gyr AG, Shenitech LLC, GE Electric Co., Sierra Instruments Inc., Yokogawa Electric, and Corporation.
1. Preface
1.1. Market Definition and Scope
1.2. Market Segmentation
1.3. Key Research Objectives
1.4. Research Highlights
2. Assumptions and Research Methodology
3. Executive Summary : Global Thermal Flow Meter Market
4. Market Overview
4.1. Introduction
4.2. Market Dynamics
4.2.1. Drivers
4.2.2. Restraints
4.2.3. Opportunity
4.3. Key Market Indicators
4.4. Key Trends
4.5. Global Thermal Flow Meter Market Analysis and Forecasts, 2015 – 2025
4.5.1. Market Revenue Projections (US$ Mn)
4.5.2. Market Volume Projections (Million Units)
4.5.3. Market Year-on-Year (Y-o-Y) Growth (Value %)
4.5.4. Price Trend Analysis By Type
4.6. Porter’s Five Force Analysis
4.7. Value Chain Analysis
4.7.1. List of Active Market Participants (manufacturers/suppliers/ distributors/vendors/EPC)
4.7.1.1. Upstream Raw Materials Sourcing
4.7.1.2. Downstream Buyers
4.7.2. Marketing Channel Analysis
4.7.2.1. Direct Marketing
4.7.2.2. Indirect Marketing
4.7.2.3. Marketing Channel Development Trend
4.8. Thermal Flow Metering Solution Installation Trend
4.9. Technology Lifecycle Analysis (2016 and 2025)
4.9.1. Technology Landscape Scenario
4.9.2. Market Maturity for Technology
4.10. Building Heating Solutions (Process Type)
4.11. Impact Analysis for Electricity Sub metering
4.12. Market Outlook
5. Global Thermal Flow Meter Market Analysis and Forecasts, By Type
5.1. Introduction & Definition
5.2. Market Analysis and Forecast (US$ Mn and Million Units), By Type, 2015 – 2025
5.2.1. Insertion
5.2.2. Portable
5.2.3. Inline
5.3. Type Comparison Matrix
5.4. Market Attractiveness By Type
6. Global Thermal Flow Meter Market Analysis and Forecasts, By Application
6.1. Introduction & Definition
6.2. Market Analysis and Forecast (US$ Mn), By Application 2015 – 2025
6.2.1. Residential
6.2.2. Commercial
6.2.2.1. Water and Waste Treatment
6.2.2.2. Food and Beverages
6.2.2.3. Chemical and Petrochemical
6.2.2.4. Pulp and Paper Industries
6.2.2.5. Others
6.3. Application Comparison Matrix
6.4. Market Attractiveness By Application
7. Global Thermal Flow Meter Market Analysis and Forecasts, By Component
7.1. Introduction & Definition
7.2. Market Analysis and Forecast (US$ Mn), By Component 2015 – 2025
7.2.1. Devices (US$ Mn and Million Units)
7.2.1.1. Thermal Energy Metering
7.2.1.2. Heat Cost Allocation
7.2.1.3. Hot and Cold Sanitary Water Metering
7.2.1.4. Wirelessly Connected Data Collection Tools and Technologies (For Above 3 Devices)
7.2.1.5. Sensors (Smoke, Co2, etc.) and Other Related Sensor Devices (For All Above Devices)
7.2.2. Services
7.3. Component Comparison Matrix
7.4. Market Attractiveness By Component
8. Global Thermal Flow Meter Market Analysis and Forecasts, By Region
8.1. Key Findings
8.2. Market Analysis and Forecast (US$ Mn), By Region, 2015 – 2025
8.2.1. North America
8.2.2. Europe
8.2.3. Asia Pacific
8.2.4. Middle East and Africa
8.2.5. South America
8.3. Market Attractiveness By Region
9. North America Thermal Flow Meter Market Analysis and Forecast
9.1. Key Findings
9.2. Key Trends
9.3. Market Analysis and Forecast (US$ Mn and Million Units), By Type, 2015 – 2025
9.3.1. Insertion
9.3.2. Portable
9.3.3. Inline
9.4. Market Analysis and Forecast (US$ Mn), By Application, 2015 – 2025
9.4.1. Residential
9.4.2. Commercial
9.4.2.1. Water and Waste Treatment
9.4.2.2. Food and Beverages
9.4.2.3. Chemical and Petrochemical
9.4.2.4. Pulp and Paper Industries
9.4.2.5. Others
9.5. Market Analysis and Forecast (US$ Mn), By Component, 2015 – 2025
9.5.1. Devices (US$ Mn and Million Units)
9.5.1.1. Thermal Energy Metering
9.5.1.2. Heat Cost Allocation
9.5.1.3. Hot and Cold Sanitary Water Metering
9.5.1.4. Wirelessly Connected Data Collection Tools and Technologies (For Above 3 Devices)
9.5.1.5. Sensors (Smoke, Co2, etc.) and Other Related Sensor Devices (For All Above Devices)
9.5.2. Services
9.6. Market Analysis and Forecast (US$ Mn), By Country, 2015 – 2025
9.6.1. United States
9.6.2. Canada
9.6.3. Rest of North America
9.7. Market Attractiveness Analysis
9.7.1. By Type
9.7.2. By Application
9.7.3. By Component
9.7.4. By Country
10. Europe Thermal Flow Meter Market Analysis and Forecast
10.1. Key Findings
10.2. Key Trends
10.3. Market Analysis and Forecast (US$ Mn and Million Units), By Type, 2015 – 2025
10.3.1. Insertion
10.3.2. Portable
10.3.3. Inline
10.4. Market Analysis and Forecast (US$ Mn), By Application, 2015 – 2025
10.4.1. Residential
10.4.2. Commercial
10.4.2.1. Water and Waste Treatment
10.4.2.2. Food and Beverages
10.4.2.3. Chemical and Petrochemical
10.4.2.4. Pulp and Paper Industries
10.4.2.5. Others
10.5. Market Analysis and Forecast (US$ Mn), By Component, 2015 – 2025
10.5.1. Devices (US$ Mn and Million Units)
10.5.1.1. Thermal Energy Metering
10.5.1.2. Heat Cost Allocation
10.5.1.3. Hot and Cold Sanitary Water Metering
10.5.1.4. Wirelessly Connected Data Collection Tools and Technologies (For Above 3 Devices)
10.5.1.5. Sensors (Smoke, Co2, etc.) and Other Related Sensor Devices (For All Above Devices)
10.5.2. Services
10.6. Market Analysis and Forecast (US$ Mn), By Country, 2015 – 2025
10.6.1. Germany
10.6.2. France
10.6.3. Spain
10.6.4. United Kingdom
10.6.5. Rest of Europe
10.7. Market Attractiveness Analysis
10.7.1. By Type
10.7.2. By Application
10.7.3. By Component
10.7.4. By Country
11. Asia Pacific Thermal Flow Meter Market Analysis and Forecast
11.1. Key Findings
11.2. Key trends
11.3. Market Analysis and Forecast (US$ Mn and Million Units), By Type, 2015 – 2025
11.3.1. Insertion
11.3.2. Portable
11.3.3. Inline
11.4. Market Analysis and Forecast (US$ Mn), By Application, 2015 – 2025
11.4.1. Residential
11.4.2. Commercial
11.4.2.1. Water and Waste Treatment
11.4.2.2. Food and Beverages
11.4.2.3. Chemical and Petrochemical
11.4.2.4. Pulp and Paper Industries
11.4.2.5. Others
11.5. Market Analysis and Forecast (US$ Mn), By Component, 2015 – 2025
11.5.1. Devices (US$ Mn and Million Units)
11.5.1.1. Thermal Energy Metering
11.5.1.2. Heat Cost Allocation
11.5.1.3. Hot and Cold Sanitary Water Metering
11.5.1.4. Wirelessly Connected Data Collection Tools and Technologies (For Above 3 Devices)
11.5.1.5. Sensors (Smoke, Co2, etc.) and Other Related Sensor Devices (For All Above Devices)
11.5.2. Services
11.6. Market Analysis and Forecast (US$ Mn), By Country, 2015 – 2025
11.6.1. China
11.6.2. Japan
11.6.3. India
11.6.4. Rest of Asia Pacific
11.7. Market Attractiveness Analysis
11.7.1. By Type
11.7.2. By Application
11.7.3. By Component
11.7.4. By Country
12. Middle East and Africa Thermal Flow Meter Market Analysis and Forecast
12.1. Key Findings
12.2. Key trends
12.3. Market Analysis and Forecast (US$ Mn and Million Units), By Type, 2015 – 2025
12.3.1. Insertion
12.3.2. Portable
12.3.3. Inline
12.4. Market Analysis and Forecast (US$ Mn), By Application, 2015 – 2025
12.4.1. Residential
12.4.2. Commercial
12.4.2.1. Water and Waste Treatment
12.4.2.2. Food and Beverages
12.4.2.3. Chemical and Petrochemical
12.4.2.4. Pulp and Paper Industries
12.4.2.5. Others
12.5. Market Analysis and Forecast (US$ Mn), By Component, 2015 – 2025
12.5.1. Devices (US$ Mn and Million Units)
12.5.1.1. Thermal Energy Metering
12.5.1.2. Heat Cost Allocation
12.5.1.3. Hot and Cold Sanitary Water Metering
12.5.1.4. Wirelessly Connected Data Collection Tools and Technologies (For Above 3 Devices)
12.5.1.5. Sensors (Smoke, Co2, etc.) and Other Related Sensor Devices (For All Above Devices)
12.5.2. Services
12.6. Market Analysis and Forecast (US$ Mn), By Country, 2015 – 2025
12.6.1. GCC
12.6.2. Saudi Arabia
12.6.3. Rest of Middle East and Africa
12.7. Market Attractiveness Analysis
12.7.1. By Type
12.7.2. By Application
12.7.3. By Component
12.7.4. By Country
13. South America Thermal Flow Meter Market Analysis and Forecast
13.1. Key Findings
13.2. Key Trends
13.3. Market Analysis and Forecast (US$ Mn and Million Units), By Type, 2015 – 2025
13.3.1. Insertion
13.3.2. Portable
13.3.3. Inline
13.4. Market Analysis and Forecast (US$ Mn), By Application, 2015 – 2025
13.4.1. Residential
13.4.2. Commercial
13.4.2.1. Water and Waste Treatment
13.4.2.2. Food and Beverages
13.4.2.3. Chemical and Petrochemical
13.4.2.4. Pulp and Paper Industries
13.4.2.5. Others
13.5. Market Analysis and Forecast (US$ Mn), By Component, 2015 – 2025
13.5.1. Devices (US$ Mn and Million Units)
13.5.1.1. Thermal Energy Metering
13.5.1.2. Heat Cost Allocation
13.5.1.3. Hot and Cold Sanitary Water Metering
13.5.1.4. Wirelessly Connected Data Collection Tools and Technologies (For Above 3 Devices)
13.5.1.5. Sensors (Smoke, Co2, etc.) and Other Related Sensor Devices (For All Above Devices)
13.5.2. Services
13.6. Market Analysis and Forecast (US$ Mn), By Country, 2015 – 2025
13.6.1. Brazil
13.6.2. Rest of South America
13.7. Market Attractiveness Analysis
13.7.1. By Type
13.7.2. By Application
13.7.3. By Component
13.7.4. By Country
14. Competition Landscape
14.1. Market Player – Competition Matrix
14.2. Market Share Analysis By Company (2016)
14.3. Company Profiles
14.3.1. ABB Ltd.
14.3.1.1. Company Details (HQ, Foundation Year, Employee Strength)
14.3.1.2. Market Presence, By Segment.
14.3.1.3. Strategy
14.3.1.4. Revenue and Operating Profits
14.3.1.5. SWOT Analysis
14.3.2. Elster Water
14.3.2.1. Company Details (HQ, Foundation Year, Employee Strength)
14.3.2.2. Market Presence, By Segment.
14.3.2.3. Strategy
14.3.2.4. Revenue and Operating Profits
14.3.2.5. SWOT Analysis
14.3.3. Emerson Electric Co.
14.3.3.1. Company Details (HQ, Foundation Year, Employee Strength)
14.3.3.2. Market Presence, By Segment.
14.3.3.3. Strategy
14.3.3.4. Revenue and Operating Profits
14.3.3.5. SWOT Analysis
14.3.4. Enercare Connections Inc.
14.3.4.1. Company Details (HQ, Foundation Year, Employee Strength)
14.3.4.2. Market Presence, By Segment.
14.3.4.3. Strategy
14.3.4.4. Revenue and Operating Profits
14.3.4.5. SWOT Analysis
14.3.5. Fluid Components LLC
14.3.5.1. Company Details (HQ, Foundation Year, Employee Strength)
14.3.5.2. Market Presence, By Segment.
14.3.5.3. Strategy
14.3.5.4. Revenue and Operating Profits
14.3.5.5. SWOT Analysis
14.3.6. GE Electric Co.
14.3.6.1. Company Details (HQ, Foundation Year, Employee Strength)
14.3.6.2. Market Presence, By Segment.
14.3.6.3. Strategy
14.3.6.4. Revenue and Operating Profits
14.3.6.5. SWOT Analysis
14.3.7. Kamstrup Group
14.3.7.1. Company Details (HQ, Foundation Year, Employee Strength)
14.3.7.2. Market Presence, By Segment.
14.3.7.3. Strategy
14.3.7.4. Revenue and Operating Profits
14.3.7.5. SWOT Analysis
14.3.8. Landis+Gyr AG
14.3.8.1. Company Details (HQ, Foundation Year, Employee Strength)
14.3.8.2. Market Presence, By Segment.
14.3.8.3. Strategy
14.3.8.4. Revenue and Operating Profits
14.3.8.5. SWOT Analysis
14.3.9. QMC
14.3.9.1. Company Details (HQ, Foundation Year, Employee Strength)
14.3.9.2. Market Presence, By Segment.
14.3.9.3. Strategy
14.3.9.4. Revenue and Operating Profits
14.3.9.5. SWOT Analysis
14.3.10. Sage Metering
14.3.10.1. Company Details (HQ, Foundation Year, Employee Strength)
14.3.10.2. Market Presence, By Segment.
14.3.10.3. Strategy
14.3.10.4. Revenue and Operating Profits
14.3.10.5. SWOT Analysis
14.3.11. Shenitech LLC
14.3.11.1. Company Details (HQ, Foundation Year, Employee Strength)
14.3.11.2. Market Presence, By Segment.
14.3.11.3. Strategy
14.3.11.4. Revenue and Operating Profits
14.3.11.5. SWOT Analysis
14.3.12. Siemens
14.3.12.1. Company Details (HQ, Foundation Year, Employee Strength)
14.3.12.2. Market Presence, By Segment.
14.3.12.3. Strategy
14.3.12.4. Revenue and Operating Profits
14.3.12.5. SWOT Analysis
14.3.13. Sierra Instruments Inc.
14.3.13.1. Company Details (HQ, Foundation Year, Employee Strength)
14.3.13.2. Market Presence, By Segment.
14.3.13.3. Strategy
14.3.13.4. Revenue and Operating Profits
14.3.13.5. SWOT Analysis
14.3.14. Yokogawa Electric Corporation
14.3.14.1. Company Details (HQ, Foundation Year, Employee Strength)
14.3.14.2. Market Presence, By Segment.
14.3.14.3. Strategy
14.3.14.4. Revenue and Operating Profits
14.3.14.5. SWOT Analysis
15. Key Takeaways
List of Tables
Table 1: Global Thermal Energy Flow Metering Solutions Market Forecast, By Type, 2015–2025 (US$ Mn)
Table 2: Global Thermal Energy Flow Metering Solutions Market Forecast, By Type, 2015–2025 (Mn Units)
Table 3: Global Thermal Energy Flow Metering Solutions Market Forecast, By Application, 2015–2025 (US$ Mn)
Table 4: Global Thermal Energy Flow Metering Solutions Market Forecast, By Application, By Commercial 2015–2025 (US$ Mn)
Table 5: Global Thermal Energy Flow Metering Solutions Market Forecast, By Component, 2015–2025 (US$ Mn)
Table 6: Global Thermal Energy Flow Metering Solutions Market Forecast, By Component, By Devices 2015–2025 (US$ Mn)
Table 7: Global Thermal Energy Flow Metering Solutions Market Forecast, By Component, By Devices 2015–2025 (Mn Units)
Table 8: Global Thermal Energy Flow Metering Solutions Market Analysis, By Region, 2015–2025 (US$ Mn)
Table 9: North America Thermal Energy Flow Metering Solutions Market Forecast, By Type, 2015–2025 (US$ Mn)
Table 10: North America Thermal Energy Flow Metering Solutions Market Forecast, By Type, 2015–2025 (Mn Units)
Table 11: North America Thermal Energy Flow Metering Solutions Market Forecast, By Application, 2015–2025 (US$ Mn)
Table 12: North America Thermal Energy Flow Metering Solutions Market Forecast, , By Application, By Commercial 2015–2025 (US$ Mn)
Table 13: North America Thermal Energy Flow Metering Solutions Market Forecast, By Component, 2015–2025 (US$ Mn)
Table 14: North America Thermal Energy Flow Metering Solutions Market Forecast, By Component, By Devices 2015–2025 (US$ Mn)
Table 15: Global Thermal Energy Flow Metering Solutions Market Forecast, By Component, By Devices 2015–2025 (Mn Units)
Table 16: North America Thermal Energy Flow Metering Solutions Market Forecast (US$ Mn), By Country, 2015–2025
Table 17: Europe Thermal Energy Flow Metering Solutions Market Forecast, By Type, 2015–2025 (US$ Mn)
Table 18: Europe Thermal Energy Flow Metering Solutions Market Forecast, By Type, 2015–2025 (Mn Units)
Table 19: Europe Thermal Energy Flow Metering Solutions Market Forecast, By Application, 2015–2025 (US$ Mn)
Table 20: Europe Thermal Energy Flow Metering Solutions Market Forecast, , By Application, By Commercial 2015–2025 (US$ Mn)
Table 21: Europe Thermal Energy Flow Metering Solutions Market Forecast, By Component, 2015–2025 (US$ Mn)
Table 22: Europe Thermal Energy Flow Metering Solutions Market Forecast, By Component, By Devices 2015–2025 (US$ Mn)
Table 23: Europe Thermal Energy Flow Metering Solutions Market Forecast, By Component, By Devices 2015–2025 (Mn Units)
Table 24: North America Thermal Energy Flow Metering Solutions Market Forecast (US$ Mn), By Country, 2015–2025
Table 25: Asia Pacific Thermal Energy Flow Metering Solutions Market Forecast, By Type, 2015–2025 (US$ Mn)
Table 26: Asia Pacific Thermal Energy Flow Metering Solutions Market Forecast, By Type, 2015–2025 (Mn Units)
Table 27: Asia Pacific Thermal Energy Flow Metering Solutions Market Forecast, By Application, 2015–2025 (US$ Mn)
Table 28: Asia Pacific Thermal Energy Flow Metering Solutions Market Forecast, , By Application, By Commercial 2015–2025 (US$ Mn)
Table 29: Asia Pacific Thermal Energy Flow Metering Solutions Market Forecast, By Component, 2015–2025 (US$ Mn)
Table 30: Asia Pacific Thermal Energy Flow Metering Solutions Market Forecast, By Component, By Devices 2015–2025 (US$ Mn)
Table 31: Asia Pacific Thermal Energy Flow Metering Solutions Market Forecast, By Component, By Devices 2015–2025 (Mn Units)
Table 32: Asia Pacific Thermal Energy Flow Metering Solutions Market Forecast (US$ Mn), By Country, 2015–2025
Table 33: Middle East Thermal Energy Flow Metering Solutions Market Forecast, By Type, 2015–2025 (US$ Mn)
Table 34: Middle East Thermal Energy Flow Metering Solutions Market Forecast, By Type, 2015–2025 (Mn Units)
Table 35: Middle East Thermal Energy Flow Metering Solutions Market Forecast, By Application, 2015–2025 (US$ Mn)
Table 36: Middle East Thermal Energy Flow Metering Solutions Market Forecast, , By Application, By Commercial 2015–2025 (US$ Mn)
Table 37: Middle East Thermal Energy Flow Metering Solutions Market Forecast, By Component, 2015–2025 (US$ Mn)
Table 38: Middle East Thermal Energy Flow Metering Solutions Market Forecast, By Component, By Devices 2015–2025 (US$ Mn)
Table 39: Middle East Energy Flow Metering Solutions Market Forecast, By Component, By Devices 2015–2025 (Mn Units)
Table 40: Middle East Thermal Energy Flow Metering Solutions Market Forecast (US$ Mn), By Country, 2015–2025
Table 41: South America Thermal Energy Flow Metering Solutions Market Forecast, By Type, 2015–2025 (US$ Mn)
Table 42: South America Thermal Energy Flow Metering Solutions Market Forecast, By Type, 2015–2025 (Mn Units)
Table 43: South America Thermal Energy Flow Metering Solutions Market Forecast, By Application, 2015–2025 (US$ Mn)
Table 44: South America Thermal Energy Flow Metering Solutions Market Forecast, , By Application, By Commercial 2015–2025 (US$ Mn)
Table 45: South America Thermal Energy Flow Metering Solutions Market Forecast, By Component, 2015–2025 (US$ Mn)
Table 46: South America Thermal Energy Flow Metering Solutions Market Forecast, By Component, By Devices 2015–2025 (US$ Mn)
Table 47: South America Thermal Energy Flow Metering Solutions Market Forecast, By Component, By Devices 2015–2025 (Mn Units)
Table 48: South America Thermal Energy Flow Metering Solutions Market Forecast (US$ Mn), By Country, 2015–2025
List of Figures
Figure 1: Thermal Flow Meter Market Share Analysis
Figure 2: Global Thermal Energy Flow Metering Solutions Market Revenue Projections, 2015 - 2025 (US$ Mn)
Figure 3: Global Thermal Energy Flow Metering Solutions Market Volume Projections, 2015 - 2025 (Mn units)
Figure 4: Thermal Energy Flow Metering Solutions Market Price Trend Analysis (US$) (Average Price), Type, 2015-2025
Figure 5: Value Chain Analysis, Marketing Channel Analysis
Figure 6: Global Market Value Share (Revenue) By Type (2017)
Figure 7: Global Market Value Share (Revenue) By Application (2017)
Figure 8: Global Market Value Share (Revenue) By Component (2017)
Figure 9: Global Thermal Energy Flow Metering Solutions Market Value Share Analysis, By Type, 2017 and 2025
Figure 10: Global Thermal Energy Flow Metering Solutions Market Revenue, By Type, Insertion
Figure 11: Global Thermal Energy Flow Metering Solutions Market Revenue, By Type, Portable
Figure 12: Global Thermal Energy Flow Metering Solutions Market Revenue, By Type, Inline
Figure 13: Global Thermal Energy Flow Metering Solutions Comparison Matrix, By Type
Figure 14: Global Thermal Energy Flow Metering Solutions Market Attractiveness Analysis, By Type
Figure 15: Global Thermal Energy Flow Metering Solutions Market Value Share Analysis, By Application, 2017 and 2025
Figure 16: Global Thermal Energy Flow Metering Solutions Market Revenue, By application, Residential
Figure 17: Global Thermal Energy Flow Metering Solutions Market Revenue, By application, Commercial
Figure 18: Global Thermal Energy Flow Metering Solutions Market Revenue, By application, commercial, Water and waste treatment
Figure 19: Global Thermal Energy Flow Metering Solutions Market Revenue, By application, commercial, food and beverages
Figure 20: Global Thermal Energy Flow Metering Solutions Market Revenue, By application, commercial, Chemical and Petrochemical
Figure 21: Global Thermal Energy Flow Metering Solutions Market Revenue, By application, commercial, pulp and paper
Figure 22: Global Thermal Energy Flow Metering Solutions Market Revenue, By application, commercial, Others
Figure 23: Global Thermal Energy Flow Metering Solutions Comparison Matrix, By Application
Figure 24: Global Thermal Energy Flow Metering Solutions Market Attractiveness Analysis, By Application
Figure 25: Global Thermal Energy Flow Metering Solutions Market Value Share Analysis, By Component, 2017 and 2025
Figure 26: Global Thermal Energy Flow Metering Solutions Market Revenue, By component, Devices
Figure 27: Global Thermal Energy Flow Metering Solutions Market Revenue, By component, services
Figure 28: Global Thermal Energy Flow Metering Solutions Market Revenue, By component, Devices, Thermal Energy Metering
Figure 29: Global Thermal Energy Flow Metering Solutions Market Revenue, By component, Devices, Heat Cost Allocation
Figure 30: Global Thermal Energy Flow Metering Solutions Market Revenue, By component, Devices, Hot and Cold Sanitary Water Metering
Figure 31: Global Thermal Energy Flow Metering Solutions Market Revenue, By component, Devices, Wirelessly Connected Data Collection Tools and Technologies
Figure 32: Global Thermal Energy Flow Metering Solutions Market Revenue, By component, Sensors
Figure 33: Global Thermal Energy Flow Metering Solutions Comparison Matrix, By Component
Figure 34: Global Thermal Energy Flow Metering Solutions Market Attractiveness Analysis, By Component
Figure 35: Global Thermal Energy Flow Metering Solutions Market Analysis, by Region, 2017 and 2025
Figure 36: Global Thermal Energy Flow Metering Solutions Market Analysis, By Region
Figure 37: North America Thermal Energy Flow Metering Solutions Market Value Share Analysis, By Type, 2017 and 2025
Figure 38: North America Thermal Energy Flow Metering Solutions Market Value Share Analysis, By Application, 2017 and 2025
Figure 39: North America Thermal Energy Flow Metering Solutions Market Value Share Analysis, By Component, 2017 and 2025
Figure 40: North America Thermal Energy Flow Metering Solutions Market Share (Mn) Analysis, By Country, 2017 and 2025
Figure 41: North America Thermal Energy Flow Metering Solutions Market Attractiveness Analysis By Country
Figure 42: North America Thermal Energy Flow Metering Solutions Market Attractiveness Analysis By Type
Figure 43: North America Thermal Energy Flow Metering Solutions Market Attractiveness Analysis By Application
Figure 44: North America Thermal Energy Flow Metering Solutions Market Attractiveness Analysis By Component
Figure 45: Europe Thermal Energy Flow Metering Solutions Market Value Share Analysis, By Type, 2017 and 2025
Figure 46: Europe Thermal Energy Flow Metering Solutions Market Value Share Analysis, By Application, 2017 and 2025
Figure 47: Europe Thermal Energy Flow Metering Solutions Market Value Share Analysis, By Component, 2017 and 2025
Figure 48: Europe Thermal Energy Flow Metering Solutions Market Share (Mn) Analysis, By Country, 2017 and 2025
Figure 49: Europe Thermal Energy Flow Metering Solutions Market Attractiveness Analysis By Country
Figure 50: Europe Thermal Energy Flow Metering Solutions Market Attractiveness Analysis By Type
Figure 51: Europe Thermal Energy Flow Metering Solutions Market Attractiveness Analysis By Application
Figure 52: Europe Thermal Energy Flow Metering Solutions Market Attractiveness Analysis By Component
Figure 53: Asia Pacific Thermal Energy Flow Metering Solutions Market Value Share Analysis, By Type, 2017 and 2025
Figure 54: Asia Pacific Thermal Energy Flow Metering Solutions Market Value Share Analysis, By Application, 2017 and 2025
Figure 55: Asia Pacific Thermal Energy Flow Metering Solutions Market Value Share Analysis, By Component, 2017 and 2025
Figure 56: Asia Pacific Thermal Energy Flow Metering Solutions Market Share (Mn) Analysis, By Country, 2017 and 2025
Figure 57: Asia Pacific Thermal Energy Flow Metering Solutions Market Attractiveness Analysis By Country
Figure 58: Asia Pacific Thermal Energy Flow Metering Solutions Market Attractiveness Analysis By Type
Figure 59: Asia Pacific Thermal Energy Flow Metering Solutions Market Attractiveness Analysis By Application
Figure 60: Asia Pacific Thermal Energy Flow Metering Solutions Market Attractiveness Analysis By Component
Figure 61: Middle East Thermal Energy Flow Metering Solutions Market Value Share Analysis, By Type, 2017 and 2025
Figure 62: Middle East Thermal Energy Flow Metering Solutions Market Value Share Analysis, By Application, 2017 and 2025
Figure 63: Middle East Thermal Energy Flow Metering Solutions Market Value Share Analysis, By Component, 2017 and 2025
Figure 64: Middle East Thermal Energy Flow Metering Solutions Market Share (Mn) Analysis, By Country, 2017 and 2025
Figure 65: Middle East Thermal Energy Flow Metering Solutions Market Attractiveness Analysis By Country
Figure 66: Middle East Thermal Energy Flow Metering Solutions Market Attractiveness Analysis By Type
Figure 67: Middle East Thermal Energy Flow Metering Solutions Market Attractiveness Analysis By Application
Figure 68: Middle East Thermal Energy Flow Metering Solutions Market Attractiveness Analysis By Component
Figure 69: South America Thermal Energy Flow Metering Solutions Market Value Share Analysis, By Type, 2017 and 2025
Figure 70: South America Thermal Energy Flow Metering Solutions Market Value Share Analysis, By Application, 2017 and 2025
Figure 71: South America Thermal Energy Flow Metering Solutions Market Value Share Analysis, By Component, 2017 and 2025
Figure 72: South America Thermal Energy Flow Metering Solutions Market Share (Mn) Analysis, By Country, 2017 and 2025
Figure 73: South America Thermal Energy Flow Metering Solutions Market Attractiveness Analysis By Country
Figure 74: South America Thermal Energy Flow Metering Solutions Market Attractiveness Analysis By Type
Figure 75: South America Thermal Energy Flow Metering Solutions Market Attractiveness Analysis By Application
Figure 76: South America Thermal Energy Flow Metering Solutions Market Attractiveness Analysis By Component
Figure 77: Global Thermal Energy Flow Metering Solutions Market Share Analysis (2016)
Copyright © Transparency Market Research, Inc. All Rights reserved
Trust Online

Thermal Energy Flow Metering Solutions Market
