The world is undergoing digital transformation as the Internet of Things (IoT) technology is witnessing magnified growth, and the notions about connected homes are changing from luxury to mainstream. While the home automation industry continues its rapid expansion, an increasing number of companies are swimming with the tide to tap into the full potential of smart home businesses. The adoption of smart home technologies is one the rise, globally, and smart home installation services are soon expected to become an inextricable element of the business model in the home automation ecosystem.
Taking into consideration the astounding upswing in the adoption of cognitive systems and connectivity technologies, Transparency Market Research (TMR), in its latest offering, offers analysis on how broader evolutions in the home automation are likely to influence the dynamics in smart home installation services market. This study presents exclusive and actionable insights that can elucidate the growth prospects for smart home installation service providers in the rapidly-evolving realm of intelligent and connected homes.

In 2017, the smart homes market surpassed US$ 31 billion in global revenues. Enabled by growing adoption of IoT and Artificial Intelligence (AI), smart homes technologies continue to proliferate, as users look for greater access and control. Over the past few years, smart and connected devices have witnessed significant adoption-trend that has provided a lucrative platform for installation service providers. The industry has been quick to respond-between 2013 and 2017, global revenues grew 2X to surpass US$ 3 billion in 2018.
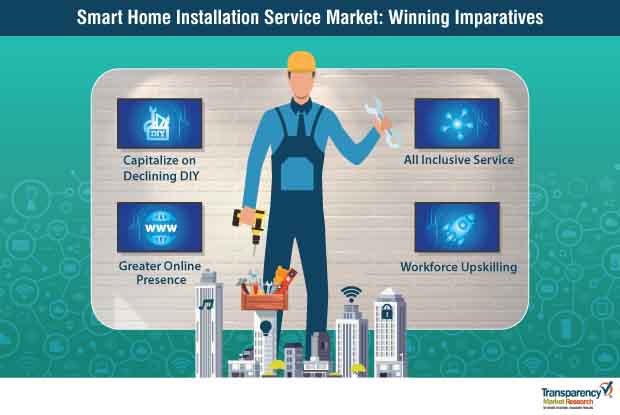
‘Lucrative’ and ‘competitive’ go hand in hand, and as holding on to market shares becomes increasingly difficult, the focus has shifted to capitalizing on next-generation connectivity technologies incorporated in today’s smart home devices. Installation service providers also need to keep upskill, as vendors introduce new products, notably voice-assistants, doorbells, and thermostats.
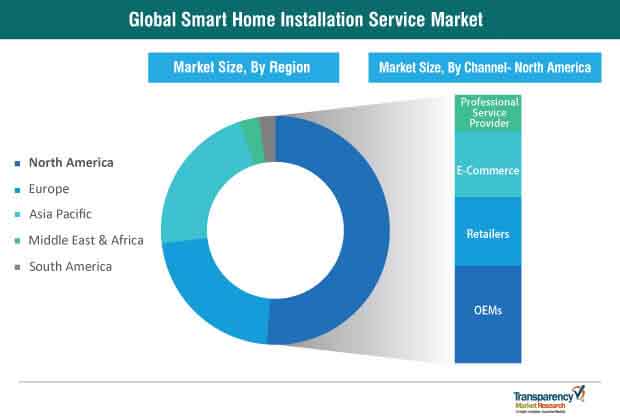
With nearly one-third revenue share, Original Equipment Manufacturers (OEMs) remain the preferred installation providers. Installing connected devices and smart home appliances in automated spaces continues to be viewed as a daunting task by a significantly large segment of consumers. OEMs are capitalizing on the lack of consumer confidence in DIY (Do-It-Yourself) installation kits to consolidate their position.
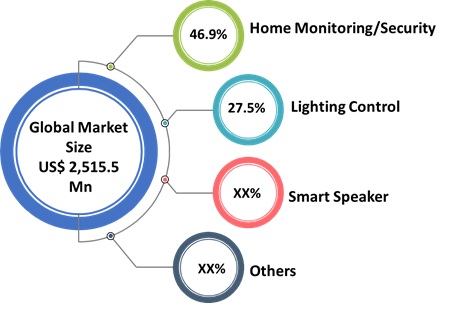
Home security concerns remain the linchpin of the smart home industry, and it is unsurprising that among the various aspects of the smart home ecosystem-entertainment, appliances, metering, etc.-home monitoring and security systems have witnessed the highest traction. Consequently, demand for installing these services accounts for a significant pie of the bottomline of installation service providers. In 2018, home monitoring and security systems accounted for nearly half the revenue share of the smart home installation services market, and this trend is expected to prevail in the future.
In addition to these industry-specific developments, the broader push toward investment in smart infrastructure is likely to provide sustained opportunities to installation providers. Governments around the world have committed to building energy-efficient, secure, and connected cities of the future. For instance, the Indian Government, under the ‘Smart Cities Mission’ pledged US$ 14 billion to develop 100 smart cities across the country. The investments by governments have also been complemented by enthusiasm from the private sector—recently, Planet Smart City, in collaboration with Habitax, invested £27 million in Brazil.

The steady growth of the eCommerce industry has ceased to be limited just to the consumer goods industry, and its impacts can be seen in the smart home installation services landscape too. Though authorized OEMs continue to remain the most preferred customer touchpoint in the smart home installation services space, the increasing popularity of e-Commerce channels is expected to create new opportunities in the smart home installation services industry.
Collaborating with e-Commerce channels to expand their reach into their target customer segments is a strategic move by market players. For instance, in November 2018, eBay announced partnerships with three service providers in the smart home landscape-InstallerNet, Handy, and Porch-allowing end users to book smart home installation services on eBay’s inventory.
Leading service providers are challenging the easy installation claims made by home improvement and DIY kits, and using this strategy as an important weapon for the expansion of their consumer base in the smart home installation services market. OEMs and retailers in the smart homes industry are offering consultation, product selection, and installation services under one roof, to bolster their growth in the smart home installation services industry.
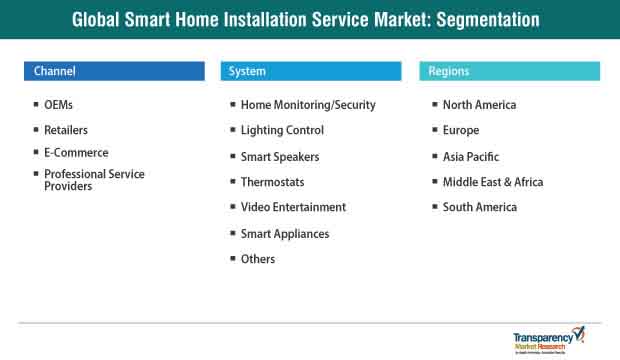
The competitive landscape of the smart home installation services market can be analyzed two categories—smart home device suppliers that also offer installation services, and retailers that only offer smart home installation services. New entrants and smart home device manufacturers in the smart home industry are more inclined towards establishing their own service businesses. In addition, manufacturing easy-to-use smart home installer tools is expected to remain an important strategy of emerging players for revenue growth in the coming years.
High-end home automation service providers such as Rexel, Vivint, Inc., and Calix, Inc. are formulating their business strategies that reflect on an increased focus on expanding their existing distributor networks across the world. For instance, in April 2019, Calix Inc. announced a partnership with IdeaTek, to expand the availability of its Gigabit services to its subscribers, and facilitate the management and integration of its smart home devices with its cloud-based and home Wi-Fi services. Recently, Vivint, Inc. also announced its partnership with Airbnb, allowing it to remotely manage energy consumption and home security at its homes.

The penetration of connected homes has reached new heights, giving an impetus to the growth of the smart home installation services landscape. During 2019-2027, the smart home installation services market is projected to grow 5x, at a remarkable CAGR of nearly 25%. However, there is still a long way to go for service providers to reach full business potential in the market. The authors of this report are of the opinion that extraordinary marketing efforts targeted toward improving the awareness and understanding about connected device value propositions will remain the key to striking it big in developing markets.
Smart Home Installation Services Market: Definition
Global Smart Home Installation Services Market by System - Snapshot

Smart Home Installation Services Market in Brief
Global Smart Home Installation Services Market by Region - Snapshot

Key Growth Drivers of the Smart Home Installation Services Market
Smart Home Installation Services Market – Key Players
1. Preface
1.1. Market Scope
1.2. Market Segmentation
1.3. Key Research Objectives
2. Assumptions and Research Methodology
2.1. Market Taxonomy - Segment Definitions
2.2. Research Methodology
2.2.1. List of Primary and Secondary Sources
2.3. Key Assumptions for Data Modeling
3. Executive Summary: Global Smart Home Installation Services Market
4. Market Overview
4.1. Introduction
4.2. Global Market – Macro Economic Factors Overview
4.2.1. World GDP Indicator
4.2.2. Global Market – Macroeconomic Factors Overview (Political Outlook, Economic Outlook, Business Environment Outlook)
4.3. Technology/Product Roadmap
4.4. Market Factor Analysis
4.4.1. Porter’s Five Forces Analysis
4.4.2. PESTLE Analysis
4.4.3. Value Chain Analysis
4.4.4. Market Dynamics (Growth Influencers)
4.4.4.1. Drivers
4.4.4.2. Restraints
4.4.4.3. Opportunities
4.4.4.4. Impact Analysis of Drivers & Restraints
4.5. Global Smart Home Installation Services Market Analysis and Forecast, 2013 - 2027
4.5.1. Market Revenue Analysis (US$ Mn)
4.5.1.1. Historic Growth Trends, 2013-2018
4.5.1.2. Forecast Trends, 2019-2027
4.6. Market Attractiveness Analysis– By Region/ Country (Global/ North America/ Europe/ Asia Pacific/ Middle East & Africa/ South America)
4.6.1. By Region/Country
4.6.2. By System
4.6.3. By Channel
4.7. Competitive Scenario and Trends
4.7.1. Mergers & Acquisitions, Expansions
4.8. Market Outlook
5. Global Smart Home Installation Services Market Analysis and Forecast, by Channel
5.1. Overview & Definitions
5.2. Key Segment Analysis
5.3. Smart Home Installation Services Market Size (US$ Mn) Forecast, by Channel, 2017 – 2027
5.3.1. OEM
5.3.2. Retailers
5.3.3. E-commerce
5.3.4. Professional Service Provider
6. Global Smart Home Installation Services Market Analysis and Forecast, by System
6.1. Overview & Definitions
6.2. Key Segment Analysis
6.3. Smart Home Installation Services Market Size (US$ Mn) Forecast, by System, 2017 - 2027
6.3.1. Home Monitoring/Security
6.3.2. Lighting Control
6.3.3. Smart Speaker
6.3.4. Thermostat
6.3.5. Video Entertainment
6.3.6. Smart Appliances
6.3.7. Others
7. Global Smart Home Installation Services Market Analysis and Forecast, by Region
7.1. Key Findings
7.2. Smart Home Installation Services Market Size (US$ Mn) Forecast, by Region, 2017 - 2027
7.2.1. North America
7.2.2. Europe
7.2.3. Asia Pacific
7.2.4. Middle East & Africa
7.2.5. South America
8. North America Smart Home Installation Services Market Analysis and Forecast
8.1. Key Findings
8.2. Smart Home Installation Services Market Size (US$ Mn) Forecast, by System, 2017 - 2027
8.2.1. Home Monitoring/Security
8.2.2. Lighting Control
8.2.3. Smart Speaker
8.2.4. Thermostat
8.2.5. Video Entertainment
8.2.6. Smart Appliances
8.2.7. Others
8.3. Smart Home Installation Services Market Size (US$ Mn) Forecast, by Channel, 2017 – 2027
8.3.1. OEM
8.3.2. Retailers
8.3.3. E-commerce
8.3.4. Professional Service Provider
8.4. Smart Home Installation Services Market Size (US$ Mn) Forecast, By Country & Sub-region, 2017 - 2027
8.4.1. The U.S.
8.4.2. Canada
8.4.3. Rest of North America
9. Europe Smart Home Installation Services Market Analysis and Forecast
9.1. Key Findings
9.2. Smart Home Installation Services Market Size (US$ Mn) Forecast, by System, 2017 - 2027
9.2.1. Home Monitoring/Security
9.2.2. Lighting Control
9.2.3. Smart Speaker
9.2.4. Thermostat
9.2.5. Video Entertainment
9.2.6. Smart Appliances
9.2.7. Others
9.3. Smart Home Installation Services Market Size (US$ Mn) Forecast, by Channel, 2017 – 2027
9.3.1. OEM
9.3.2. Retailers
9.3.3. E-commerce
9.3.4. Professional Service Provider
9.4. Smart Home Installation Services Market Size (US$ Mn) Forecast, By Country & Sub-region, 2017 - 2027
9.4.1. Germany
9.4.2. France
9.4.3. The U.K.
9.4.4. Rest of Europe
10. Asia Pacific Smart Home Installation Services Market Analysis and Forecast
10.1. Key Findings
10.2. Smart Home Installation Services Market Size (US$ Mn) Forecast, by System, 2017 - 2027
10.2.1. Home Monitoring/Security
10.2.2. Lighting Control
10.2.3. Smart Speaker
10.2.4. Thermostat
10.2.5. Video Entertainment
10.2.6. Smart Appliances
10.2.7. Others
10.3. Smart Home Installation Services Market Size (US$ Mn) Forecast, by Channel, 2017 – 2027
10.3.1. OEM
10.3.2. Retailers
10.3.3. E-commerce
10.3.4. Professional Service Provider
10.4. Smart Home Installation Services Market Size (US$ Mn) Forecast, By Country & Sub-region, 2017 – 2027
10.4.1. China
10.4.2. India
10.4.3. Japan
10.4.4. Australia
10.4.5. Rest of Asia Pacific
11. Middle East & Africa Smart Home Installation Services Market Analysis and Forecast
11.1. Key Findings
11.2. Smart Home Installation Services Market Size (US$ Mn) Forecast, by System, 2017 - 2027
11.2.1. Home Monitoring/Security
11.2.2. Lighting Control
11.2.3. Smart Speaker
11.2.4. Thermostat
11.2.5. Video Entertainment
11.2.6. Smart Appliances
11.2.7. Others
11.3. Smart Home Installation Services Market Size (US$ Mn) Forecast, by Channel, 2017 – 2027
11.3.1. OEM
11.3.2. Retailers
11.3.3. E-commerce
11.3.4. Professional Service Provider
11.4. Smart Home Installation Services Market Size (US$ Mn) Forecast, By Country & Sub-region, 2017 – 2027
11.4.1. GCC
11.4.2. South Africa
11.4.3. Rest of MEA
12. South America Smart Home Installation Services Market Analysis and Forecast
12.1. Key Findings
12.2. Smart Home Installation Services Market Size (US$ Mn) Forecast, by System, 2017 - 2027
12.2.1. Home Monitoring/Security
12.2.2. Lighting Control
12.2.3. Smart Speaker
12.2.4. Thermostat
12.2.5. Video Entertainment
12.2.6. Smart Appliances
12.2.7. Others
12.3. Smart Home Installation Services Market Size (US$ Mn) Forecast, by Channel, 2017 – 2027
12.3.1. OEM
12.3.2. Retailers
12.3.3. E-commerce
12.3.4. Professional Service Provider
12.4. Smart Home Installation Services Market Size (US$ Mn) Forecast, By Country & Sub-region, 2017 – 2027
12.4.1. Brazil
12.4.2. Rest of South America
13. Competition Landscape
13.1. Market Player – Competition Matrix
14. Company Profiles
14.1. Miami Electric Masters
14.1.1. Business Overview
14.1.2. Product Portfolio
14.1.3. Strategic Overview
14.2. Red River Electric.
14.2.1. Business Overview
14.2.2. Product Portfolio
14.2.3. Strategic Overview
14.3. Rexel
14.3.1. Business Overview
14.3.2. Product Portfolio
14.3.3. Strategic Overview
14.4. Insteon
14.4.1. Business Overview
14.4.2. Product Portfolio
14.4.3. Strategic Overview
14.5. Smartify Home Automation Limited
14.5.1. Business Overview
14.5.2. Product Portfolio
14.5.3. Strategic Overview
14.6. Vivint, Inc.
14.6.1. Business Overview
14.6.2. Product Portfolio
14.6.3. Strategic Overview
14.7. Calix, Inc.
14.7.1. Business Overview
14.7.2. Product Portfolio
14.7.3. Strategic Overview
14.8. Finite Solutions
14.8.1. Business Overview
14.8.2. Product Portfolio
14.8.3. Strategic Overview
14.9. HelloTech Inc.
14.9.1. Business Overview
14.9.2. Product Portfolio
14.9.3. Strategic Overview
14.10. Handy
14.10.1. Business Overview
14.10.2. Product Portfolio
14.10.3. Strategic Overview
15. Key Takeaways
List of Tables
Table 1: Global Smart Home Installation Service Market Size (US$ Mn) and Forecast, by Channel, 2019–2027
Table 2: Global Smart Home Installation Service Market Size (US$ Mn) and Forecast, by OEMs, 2019–2027
Table 3: Global Smart Home Installation Service Market Size (US$ Mn) and Forecast, by Retailers, 2019–2027
Table 4: Global Smart Home Installation Service Market Size (US$ Mn) and Forecast, by E-commerce, 2019–2027
Table 5: Global Smart Home Installation Service Market Size (US$ Mn) and Forecast, by Professional Service Provider, 2019–2027
Table 6: Global Smart Home Installation Service Market Size (US$ Mn) and Forecast, by System, 2019–2027
Table 7: Global Smart Home Installation Service Market Size (US$ Mn) and Forecast, by Home Monitoring/Security, 2019–2027
Table 8: Global Smart Home Installation Service Market Size (US$ Mn) and Forecast, by Lighting Control, 2019–2027
Table 9: Global Smart Home Installation Service Market Size (US$ Mn) and Forecast, by Smart Speaker, 2019–2027
Table 10: Global Smart Home Installation Service Market Size (US$ Mn) and Forecast, by Thermostat, 2019–2027
Table 11: Global Smart Home Installation Service Market Size (US$ Mn) and Forecast, by Video Entertainment, 2019–2027
Table 12: Global Smart Home Installation Service Market Size (US$ Mn) and Forecast, by Smart Appliances, 2019–2027
Table 13: Global Smart Home Installation Service Market Size (US$ Mn) and Forecast, by Others, 2019–2027
Table 14: Global Smart Home Installation Services Market Size (US$ Mn) and Forecast, by Region, 2019–2027
Table 15: North America Smart Home Installation Services Market Size (US$ Mn) and Forecast, by Country, 2019–2027
Table 16: North America Smart Home Installation Services Market Size (US$ Mn) and Forecast, by Channel, 2019–2027
Table 17: North America Smart Home Installation Services Market Size (US$ Mn) and Forecast, by System, 2019–2027
Table 18: Europe Smart Home Installation Services Market Size (US$ Mn) and Forecast, by Country, 2019–2027
Table 19: Europe Smart Home Installation Services Market Size (US$ Mn) and Forecast, by Channel, 2019–2027
Table 20: Europe Smart Home Installation Services Market Size (US$ Mn) and Forecast, by System, 2019–2027
Table 21: Asia Pacific Smart Home Installation Services Market Size (US$ Mn) and Forecast, by Country, 2019–2027
Table 22: Asia Pacific Smart Home Installation Services Market Size (US$ Mn) and Forecast, by Channel, 2019–2027
Table 23: Asia Pacific Smart Home Installation Services Market Size (US$ Mn) and Forecast, by System, 2019–2027
Table 24: Middle East & Africa Smart Home Installation Services Market Size (US$ Mn) and Forecast, by Country, 2019–2027
Table 25: Middle East & Africa Smart Home Installation Services Market Size (US$ Mn) and Forecast, by Channel, 2019–2027
Table 26: Middle East & Africa Smart Home Installation Services Market Size (US$ Mn) and Forecast, by System, 2019–2027
Table 27: South America Smart Home Installation Services Market Size (US$ Mn) and Forecast, by Country, 2019–2027
Table 28: South America Smart Home Installation Services Market Size (US$ Mn) and Forecast, by Channel, 2019–2027
Table 29: South America Smart Home Installation Services Market Size (US$ Mn) and Forecast, by System, 2019–2027
List of Figure
Figure 1: Global Smart Home Installation Service Market Value (US$ Mn)
Figure 2: Dominating Segments
Figure 3: Fastest Growing Segments, (CAGR 2019-2027)
Figure 4: GDP (US$ Bn), Top Economies (2012-2017)
Figure 5: Top Economies GDP Landscape
Figure 6: Value Chain Analysis
Figure 7: Global Smart Home Installation Service Market Size (US$ Mn) Forecast, 2013 – 2018
Figure 8: Global Smart Home Installation Service Market Size (US$ Mn) Forecast, 2019 – 2026
Figure 9: Global Smart Home Installation Service Market Attractiveness Analysis, By Channel
Figure 10: Global Smart Home Installation Service Market Attractiveness Analysis, By System
Figure 11: Global Smart Home Installation Service Market Attractiveness Analysis, By Region
Figure 12: Global Smart Home Installation Service Market CAGR by Channel CAGR (%) (2019 – 2027)
Figure 13: Global Smart Home Installation Service Market CAGR by System CAGR (%) (2019 – 2027)
Figure 14: Global Smart Home Installation Service Market CAGR by Region CAGR (%) (2019 – 2027)
Figure 15: Global Smart Home Installation Service Market Share Analysis, by Channel (2017 & 2027)
Figure 16: Global Smart Home Installation Service Market Share Analysis, by OEMs (2017)
Figure 17: Global Smart Home Installation Service Market Share Analysis, by OEMs (2027)
Figure 18: Global Smart Home Installation Service Market Share Analysis, by Retailers (2017)
Figure 19: Global Smart Home Installation Service Market Share Analysis, by Retailers (2027)
Figure 20: Global Smart Home Installation Service Market Share Analysis, by E-commerce (2017)
Figure 21: Global Smart Home Installation Service Market Share Analysis, by E-commerce (2027)
Figure 22: Global Smart Home Installation Service Market Share Analysis, by Professional Service Provider (2017)
Figure 23: Global Smart Home Installation Service Market Share Analysis, by Professional Service Provider (2027)
Figure 24: Global Smart Home Installation Service Market Share Analysis, by System (2017 & 2027)
Figure 25: Global Smart Home Installation Service Market Share Analysis, by Home Monitoring/Security (2017)
Figure 26: Global Smart Home Installation Service Market Share Analysis, by Home Monitoring/Security (2027)
Figure 27: Global Smart Home Installation Service Market Share Analysis, by Lighting Control (2017)
Figure 28: Global Smart Home Installation Service Market Share Analysis, by Lighting Control (2027)
Figure 29: Global Smart Home Installation Service Market Share Analysis, by Smart Speaker (2017)
Figure 30: Global Smart Home Installation Service Market Share Analysis, by Smart Speaker (2027)
Figure 31: Global Smart Home Installation Service Market Share Analysis, by Thermostat (2017)
Figure 32: Global Smart Home Installation Service Market Share Analysis, by Thermostat (2027)
Figure 33: Global Smart Home Installation Service Market Share Analysis, by Video Entertainment (2017)
Figure 34: Global Smart Home Installation Service Market Share Analysis, by Video Entertainment (2027)
Figure 35: Global Smart Home Installation Service Market Share Analysis, by Smart Appliances (2017)
Figure 36: Global Smart Home Installation Service Market Share Analysis, by Smart Appliances (2027)
Figure 37: Global Smart Home Installation Service Market Share Analysis, by Others (2017)
Figure 38: Global Smart Home Installation Service Market Share Analysis, by Others (2027)
Figure 39: Global Smart Home Installation Services Market, by Region (US$ Mn) 2017
Figure 40: Global Smart Home Installation Service Market Share Analysis, by Region (2017 & 2027)
Figure 41: North America Smart Home Installation Services Market Growth US$ Mn – Snapshot
Figure 42: North America Smart Home Installation Services Market Revenue Analysis, by Channel, 2017 US$ Mn
Figure 43: North America Smart Home Installation Services Market Share Analysis, by System, 2017 US$ Mn
Figure 44: North America Smart Home Installation Services Market Share Analysis, by Country, 2017 US$ Mn
Figure 45: North America Smart Home Installation Services Market Value (US$ Mn) 2017-2027
Figure 46: North America Smart Home Installation Services Market Share Analysis, by Country (2017)
Figure 47: North America Smart Home Installation Services Market Share Analysis, by Country (2027)
Figure 48: North America Smart Home Installation Services Market Share Analysis, by Channel (2017)
Figure 49: North America Smart Home Installation Services Market Share Analysis, by Channel (2027)
Figure 50: North America Smart Home Installation Services Market Share Analysis, by System (2018)
Figure 51: North America Smart Home Installation Services Market Share Analysis, by System (2027)
Figure 52: Europe Smart Home Installation Services Market Growth US$ Mn – Snapshot
Figure 53: Europe Smart Home Installation Services Market Revenue Analysis, by Channel, 2017 US$ Mn
Figure 54: Europe Smart Home Installation Services Market Share Analysis, by System, 2017 US$ Mn
Figure 55: Europe Smart Home Installation Services Market Share Analysis, by Country, 2017 US$ Mn
Figure 56: Europe Smart Home Installation Services Market Value (US$ Mn) 2017-2027
Figure 57: Europe Smart Home Installation Services Market Share Analysis, by Country (2017)
Figure 58: Europe Smart Home Installation Services Market Share Analysis, by Country (2027)
Figure 59: Europe Smart Home Installation Services Market Share Analysis, by Channel (2017)
Figure 60: Europe Smart Home Installation Services Market Share Analysis, by Channel (2027)
Figure 61: Europe Smart Home Installation Services Market Share Analysis, by System (2018)
Figure 62: Europe Smart Home Installation Services Market Share Analysis, by System (2027)
Figure 63: Asia Pacific Smart Home Installation Services Market Growth US$ Mn – Snapshot
Figure 64: Asia Pacific Smart Home Installation Services Market Revenue Analysis, by Channel, 2017 US$ Mn
Figure 65: Asia Pacific Smart Home Installation Services Market Share Analysis, by System, 2017 US$ Mn
Figure 66: Asia Pacific Smart Home Installation Services Market Share Analysis, by Country, 2017 US$ Mn
Figure 67: Asia Pacific Smart Home Installation Services Market Value (US$ Mn) 2017-2027
Figure 68: Asia Pacific Smart Home Installation Services Market Share Analysis, by Country (2017)
Figure 69: Asia Pacific Smart Home Installation Services Market Share Analysis, by Country (2027)
Figure 70: Asia Pacific Smart Home Installation Services Market Share Analysis, by Channel (2017)
Figure 71: Asia Pacific Smart Home Installation Services Market Share Analysis, by Channel (2027)
Figure 72: Asia Pacific Smart Home Installation Services Market Share Analysis, by System (2018)
Figure 73: Asia Pacific Smart Home Installation Services Market Share Analysis, by System (2027)
Figure 74: Middle East & Africa Smart Home Installation Services Market Growth US$ Mn – Snapshot
Figure 75: Middle East & Africa Smart Home Installation Services Market Revenue Analysis, by Channel, 2017 US$ Mn
Figure 76: Middle East & Africa Smart Home Installation Services Market Share Analysis, by System, 2017 US$ Mn
Figure 77: Middle East & Africa Smart Home Installation Services Market Share Analysis, by Country, 2017 US$ Mn
Figure 78: Middle East & Africa Smart Home Installation Services Market Value (US$ Mn) 2017-2027
Figure 79: Middle East & Africa Smart Home Installation Services Market Share Analysis, by Country (2017)
Figure 80: Middle East & Africa Smart Home Installation Services Market Share Analysis, by Country (2027)
Figure 81: Middle East & Africa Smart Home Installation Services Market Share Analysis, by Channel (2017)
Figure 82: Middle East & Africa Smart Home Installation Services Market Share Analysis, by Channel (2027)
Figure 83: Middle East & Africa Smart Home Installation Services Market Share Analysis, by System (2018)
Figure 84: Middle East & Africa Smart Home Installation Services Market Share Analysis, by System (2027)
Figure 85: South America Smart Home Installation Services Market Growth US$ Mn – Snapshot
Figure 86: South America Smart Home Installation Services Market Revenue Analysis, by Channel, 2017 US$ Mn
Figure 87: South America Smart Home Installation Services Market Share Analysis, by System, 2017 US$ Mn
Figure 88: South America Smart Home Installation Services Market Share Analysis, by Country, 2017 US$ Mn
Figure 89: South America Smart Home Installation Services Market Value (US$ Mn) 2017-2027
Figure 90: South America Smart Home Installation Services Market Share Analysis, by Country (2017)
Figure 91: South America Smart Home Installation Services Market Share Analysis, by Country (2027)
Figure 92: South America Smart Home Installation Services Market Share Analysis, by Channel (2017)
Figure 93: South America Smart Home Installation Services Market Share Analysis, by Channel (2027)
Figure 94: South America Smart Home Installation Services Market Share Analysis, by System (2017)
Figure 95: South America Smart Home Installation Services Market Share Analysis, by System (2027)