Sirolimus could have a promising role in prophylaxis of rejection, treatment of refractory acute rejection, and chronic allograft dysfunction, as substantiated by various studies. Sirolimus is a new potent immunosuppressant whose profile could offer an advantage over other currently used drugs in view of its absence of intrinsic nephrotoxicity and efficacy as good as cyclosporin. Sirolimus could have both, a steroid sparing as well as a cyclosporin sparing effect.
Sirolimus may have a beneficial role in prophylaxis of rejection as well as treatment of refractory rejection. Sirolimus also has antifungal, antitumor, and anti-smooth muscle proliferative roles. The global sirolimus market was valued at US$ 285.00 Mn in 2018 and is projected to reach US$ 304.08 Mn by 2027, expanding at a CAGR of 1.0% from 2019 to 2027.
Global Sirolimus Market: Competitive Insights
The global sirolimus market is highly fragmented due to the presence of a large number of players. Major players operating in the market include Pfizer, Inc., Biocon, Dr. Reddy’s Laboratories Ltd., Concept Medical, Inc., Stentys SA, Torrent Pharmaceuticals Ltd., Zydus Cadila, and Intas Pharmaceuticals Ltd.
Increase in trend of mergers & acquisitions and product approvals & launches in developing countries is expected to boost the global sirolimus market during the forecast period. Additionally, acquisitions drive growth in core business. Product approvals enable companies to enhance product portfolio globally.
The global sirolimus market has been segmented as follows:
Sirolimus market was valued at US$ 285.00 Mn in 2018
Sirolimus market is projected to reach US$ 304.08 Mn by 2027
Sirolimus market to expand at a CAGR of 1.0% from 2019 to 2027
Sirolimus market is driven by increase in incidence of target diseases, rise in the number of lifestyle-related disorders
Key players in the sirolimus market include Pfizer, Inc., Biocon, Dr. Reddy’s Laboratories Ltd., Concept Medical, Inc., Stentys SA
1. Preface
1.1. Market Definition and Scope
1.2. Market Segmentation
1.3. Key Research Objectives
1.4. Research Highlights
2. Assumptions and Research Methodology
3. Executive Summary: Global Sirolimus Market
4. Market Overview
4.1. Introduction
4.1.1. Application Definition
4.1.2. Industry Evolution / Developments
4.2. Overview
4.3. Market Dynamics
4.3.1. Drivers
4.3.2. Restraints
4.3.3. Opportunities
4.4. Global Sirolimus Market Analysis and Forecast, 2016–2026
5. Market Outlook
5.1.Disease Prevalence & Incidence Rate globally with key countries
5.2.Pipeline Analysis
5.3.Supply Chain Analysis
5.4.Pricing Analysis by Product & Manufacturers
5.5.Global Sirolimus Market, by Consumption Volume (Kg) (2018)
5.6.Overview of Sirolimus Manufacturing Process
6. Global Sirolimus Market Analysis and Forecast, by Application
6.1. Introduction & Definition
6.2. Key Findings / Developments
6.3. Market Value Forecast, by Application, 2016–2026
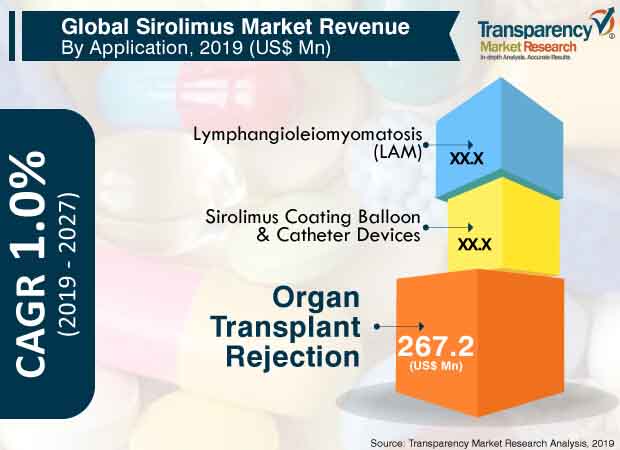
6.3.1. Organ Transplant Rejection
6.3.2. Lymphangioleiomyomatosis (LAM)
6.3.3. Sirolimus Coating Balloon & Catheter Devices
6.4. Market Attractiveness, by Application
7. Global Sirolimus Market Analysis and Forecast, by Distribution Channel
7.1. Introduction & Definition
7.2. Key Findings / Developments
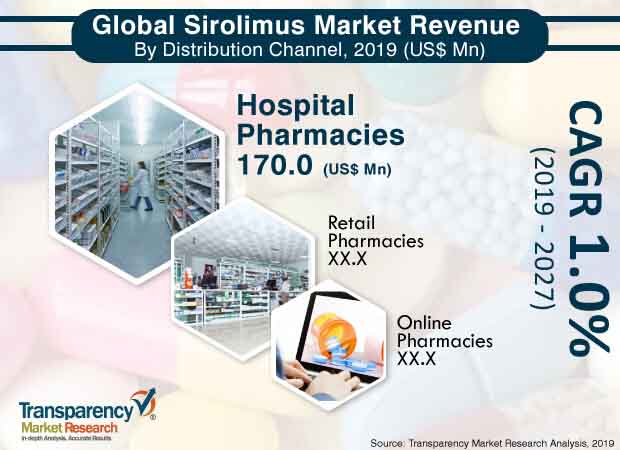
7.3. Market Value Forecast, by Distribution Channel, 2016–2026
7.3.1. Hospital Pharmacies
7.3.2. Retail Pharmacies
7.3.3. Online Pharmacies
7.4. Market Attractiveness, by Distribution Channel
8. Global Sirolimus Market Analysis and Forecasts, by Region
8.1. Key Findings
8.2. Market Value Forecast, by Region
8.2.1. North America
8.2.2. Europe
8.2.3. Asia Pacific
8.2.4. Latin America
8.2.5. Middle East & Africa
8.3. Market Attractiveness, by Country/Region
9. North America Sirolimus Market Analysis and Forecast
9.1. Introduction
9.1.1. Key Findings
9.2. Market Value Forecast, by Application, 2016–2026
9.2.1. Organ Transplant Rejection
9.2.2. Lymphangioleiomyomatosis (LAM)
9.2.3. Sirolimus Coating Balloon & Catheter Devices
9.3. Market Value Forecast, by Distribution Channel, 2016–2026
9.3.1. Hospital Pharmacies
9.3.2. Retail Pharmacies
9.3.3. Online Pharmacies
9.4. Market Value Forecast, by Country, 2016–2026
9.4.1. U.S.
9.4.2. Canada
9.5. Market Attractiveness Analysis
9.5.1. By Application
9.5.2. By Distribution Channel
9.5.3. By Country
10. Europe Sirolimus Market Analysis and Forecast
10.1. Introduction
10.1.1. Key Findings
10.2. Market Value Forecast, by Application, 2016–2026
10.2.1. Organ Transplant Rejection
10.2.2. Lymphangioleiomyomatosis (LAM)
10.2.3. Sirolimus Coating Balloon & Catheter Devices
10.3. Market Value Forecast, by Distribution Channel, 2016–2026
10.3.1. Hospital Pharmacies
10.3.2. Retail Pharmacies
10.3.3. Online Pharmacies
10.4. Market Value Forecast, by Country/Sub-region, 2016–2026
10.4.1. Germany
10.4.2. U.K.
10.4.3. France
10.4.4. Spain
10.4.5. Italy
10.4.6. Rest of Europe
10.5. Market Attractiveness Analysis
10.5.1. By Application
10.5.2. By Distribution Channel
10.5.3. By Country/Sub-region
11. Asia Pacific Sirolimus Market Analysis and Forecast
11.1.Introduction
11.1.1. Key Findings
11.2.Market Value Forecast, by Application, 2016–2026
11.2.1. Organ Transplant Rejection
11.2.2. Lymphangioleiomyomatosis (LAM)
11.2.3. Sirolimus Coating Balloon & Catheter Devices
11.3.Market Value Forecast, by Distribution Channel, 2016–2026
11.3.1. Hospital Pharmacies
11.3.2. Retail Pharmacies
11.3.3. Online Pharmacies
11.4.Market Value Forecast, by Country/Sub-region, 2016–2026
11.4.1. China
11.4.2. Japan
11.4.3. India
11.4.4. Australia & New Zealand
11.4.5. Rest of Asia Pacific
11.5. Market Attractiveness Analysis
11.5.1. By Application
11.5.2. By Distribution Channel
11.5.3. By Country/Sub-region
12. Latin America Sirolimus Market Analysis and Forecast
12.1.Introduction
12.1.1. Key Findings
12.2. Market Value Forecast, by Application, 2016–2026
12.2.1. Organ Transplant Rejection
12.2.2. Lymphangioleiomyomatosis (LAM)
12.2.3. Sirolimus Coating Balloon & Catheter Devices
12.3. Market Value Forecast, by Distribution Channel, 2016–2026
12.3.1. Hospital Pharmacies
12.3.2. Retail Pharmacies
12.3.3. Online Pharmacies
12.4. Market Value Forecast, by Country/Sub-region, 2016–2026
12.4.1. Brazil
12.4.2. Mexico
12.4.3. Rest of Latin America
12.5. Market Attractiveness Analysis
12.5.1. By Application
12.5.2. By Distribution Channel
12.5.3. By Country/Sub-region
13. Middle East & Africa Sirolimus Market Analysis and Forecast
13.1. Introduction
13.1.1. Key Findings
13.2. Market Value Forecast, by Application, 2016–2026
13.2.1. Organ Transplant Rejection
13.2.2. Lymphangioleiomyomatosis (LAM)
13.2.3. Sirolimus Coating Balloon & Catheter Devices
13.3. Market Value Forecast, by Distribution Channel, 2016–2026
13.3.1. Hospital Pharmacies
13.3.2. Retail Pharmacies
13.3.3. Online Pharmacies
13.4. Market Value Forecast, by Country/Sub-region, 2016–2026
13.4.1. GCC Countries
13.4.2. South Africa
13.4.3. Israel
13.4.4. Rest of Middle East & Africa
13.5. Market Attractiveness Analysis
13.5.1. By Application
13.5.2. By Distribution Channel
13.5.3. By Country/Sub-region
14. Competition Landscape
14.1. Market Player - Competition Matrix (By Tier and Size of companies)
14.2. Market Share Analysis, by Company (2018)
14.3. Company Profiles
14.3.1. Pfizer, Inc.
14.3.2. Biocon
14.3.3. Dr. Reddy’s Laboratories Ltd.
14.3.4. Concept Medical, Inc.
14.3.7. Stentys SA
14.3.8. Torrent Pharmaceuticals Ltd.
14.3.9. Zydus Cadila
14.3.10. Intas Pharmaceuticals Ltd.
List of Tables
Table 01-10: Pipeline Analysis
Table 11: Global Sirolimus Market Value (US$ Mn) Forecast, by Application, 2017–2027
Table 12: Global Sirolimus Market Size (US$ Mn) Forecast, by Distribution Channel, 2017–2027
Table 13: Global Sirolimus Market Size (US$ Mn) Forecast, by Region, 2017–2027
Table 14: North America Sirolimus Market Revenue (US$ Mn) Forecast, by Country, 2017–2027
Table 15: North America Sirolimus Market Revenue (US$ Mn) Forecast, by Application, 2017–2027
Table 16: North America Sirolimus Market Revenue (US$ Mn) Forecast, by Distribution Channel, 2017–2027
Table 17: Europe Sirolimus Market Revenue (US$ Mn) Forecast, by Country, 2017–2027
Table 18: Europe Sirolimus Market Revenue (US$ Mn) Forecast, by Application, 2017–2027
Table 19: Europe Sirolimus Market Revenue (US$ Mn) Forecast, by Distribution Channel, 2017–2027
Table 20: Asia Pacific Sirolimus Market Revenue (US$ Mn) Forecast, by Country/Sub-region, 2017–2027
Table 21: Asia Pacific Sirolimus Market Revenue (US$ Mn) Forecast, by Application, 2017–2027
Table 22: Asia Pacific Sirolimus Market Revenue (US$ Mn) Forecast, by Distribution Channel, 2017–2027
Table 23: Latin America Sirolimus Market Revenue (US$ Mn) Forecast, by Country/Sub-region, 2017–2027
Table 24: Latin America Sirolimus Market Revenue (US$ Mn) Forecast, by Application, 2017–2027
Table 25: Latin America Sirolimus Market Revenue (US$ Mn) Forecast, by Distribution Channel, 2017–2027
Table 26: Middle East & Africa Sirolimus Market Revenue (US$ Mn) Forecast, by Country/Sub-region, 2017–2027
Table 27: Middle East & Africa Sirolimus Market Revenue (US$ Mn) Forecast, by Application, 2017–2027
Table 28: Middle East & Africa Sirolimus Market Revenue (US$ Mn) Forecast, by Distribution Channel, 2017–2027
List of Figures
Figure 01: Global Sirolimus Market Value (US$ Mn) and Distribution, by Region, 2019 and 2027
Figure 02: Market Snapshot
Figure 04: Global Sirolimus Market Value Share, by Distribution Channel (2018)
Figure 03: Global Sirolimus Market Value Share, by Application (2018)
Figure 05: Global Sirolimus Market Value Share, by Region (2018)
Figure 06: Global Sirolimus Market Size (US$ Mn) Forecast, 2017–2027
Figure 07: Global Sirolimus Market Value Share Analysis, by Application, 2018 and 2027
Figure 08: Global Sirolimus Market Revenue (US$ Mn) Forecast, 2017–2027, by Organ Transplant Rejection
Figure 09: Global Sirolimus Market Revenue (US$ Mn) Forecast, 2017–2027, by Lymphangioleiomyomatosis (LAM)
Figure 10: Global Sirolimus Market Revenue (US$ Mn) Forecast, 2017–2027, by Sirolimus Coating Balloon & Catheter Devices
Figure 11: Global Sirolimus Market Attractiveness, by Application, 2019–2027
Figure 12: Global Sirolimus Market Value Share Analysis, by Distribution Channel, 2018 and 2027
Figure 13: Global Sirolimus Market Revenue (US$ Mn) Forecast, by Hospital Pharmacies, 2017–2027
Figure 14: Global Sirolimus Market Revenue (US$ Mn) Forecast, by Retail Pharmacies, 2017–2027
Figure 15: Global Sirolimus Market Revenue (US$ Mn) Forecast, by Online Pharmacies, 2017–2027
Figure 16: Global Sirolimus Market Attractiveness, by Distribution Channel, 2019–2027
Figure 17: Global Sirolimus Market Value Share Analysis, by Region, 2018 and 2027
Figure 18: Sirolimus Market Attractiveness Analysis, by Region
Figure 19: North America Sirolimus Market Revenue (US$ Mn) Forecast, 2017–2027
Figure 20: North America Sirolimus Market Value Share (%), by Country, 2018 and 2027
Figure 21: North America Sirolimus Market Attractiveness, by Country, 2019–2027
Figure 22: North America Sirolimus Market Value Share (%), by Application, 2018 and 2027
Figure 23: North America Sirolimus Market Attractiveness, by Application, 2019–2027
Figure 24: North America Sirolimus Market Value Share (%), by Distribution Channel, 2018 and 2027
Figure 25: North America Sirolimus Market Attractiveness, by Distribution Channel, 2019–2027
Figure 26: Europe Sirolimus Market Revenue (US$ Mn) Forecast, 2017–2027
Figure 27: Europe Sirolimus Market Value Share (%), by Country/Sub-region, 2018 and 2027
Figure 28: Europe Sirolimus Market Attractiveness, by Country, 2019–2027
Figure 29: Europe Sirolimus Market Value Share (%), by Application, 2018 and 2027
Figure 30: Europe Sirolimus Market Attractiveness, by Application, 2019–2027
Figure 31: Europe Sirolimus Market Value Share (%), by Distribution Channel, 2018 and 2027
Figure 32: Europe Sirolimus Market Attractiveness, by Distribution Channel, 2019–2027
Figure 33: Asia Pacific Sirolimus Market Revenue (US$ Mn) Forecast, 2017–2027
Figure 34: Asia Pacific Sirolimus Market Value Share (%), by Country/Sub-region, 2018 and 2027
Figure 35: Asia Pacific Sirolimus Market Attractiveness, by Country/Sub-region, 2019–2027
Figure 36: Asia Pacific Sirolimus Market Value Share (%), by Application, 2018 and 2027
Figure 37: Asia Pacific Sirolimus Market Attractiveness, by Application, 2019–2027
Figure 38: Asia Pacific Sirolimus Market Value Share (%), by Distribution Channel, 2018 and 2027
Figure 39: Asia Pacific Sirolimus Market Attractiveness, by Distribution Channel, 2019–2027
Figure 40: Latin America Sirolimus Market Revenue (US$ Mn) Forecast, 2017–2027
Figure 41: Latin America Sirolimus Market Value Share (%), by Country/Sub-region, 2018 and 2027
Figure 42: Latin America Sirolimus Market Attractiveness, by Country/Sub-region, 2019–2027
Figure 43: Latin America Sirolimus Market Value Share (%), by Application, 2018 and 2027
Figure 44: Latin America Sirolimus Market Attractiveness, by Application, 2019–2027
Figure 45: Latin America Sirolimus Market Value Share (%), by Distribution Channel, 2018 and 2027
Figure 46: Latin America Sirolimus Market Attractiveness, by Distribution Channel, 2019–2027
Figure 47: Middle East & Africa Sirolimus Market Revenue (US$ Mn) Forecast, 2017–2027
Figure 48: Middle East & Africa Sirolimus Market Value Share (%), by Country/Sub-region, 2018 and 2027
Figure 49: Middle East & Africa Sirolimus Market Attractiveness, by Country/Sub-region, 2019–2027
Figure 50: Middle East & Africa Sirolimus Market Value Share (%), by Application, 2018 and 2027
Figure 51: Middle East & Africa Sirolimus Market Attractiveness, by Application, 2019–2027
Figure 52: Middle East & Africa Sirolimus Market Value Share (%), by Distribution Channel, 2018 and 2027
Figure 53: Middle East & Africa Sirolimus Market Attractiveness, by Distribution Channel, 2019–2027
Figure 54: Pfizer, Inc. Revenue (US$ Mn) and Y-o-Y Growth (%), 2015–2018
Figure 55: Pfizer, Inc. Breakdown of Net Sales (%), by Region, 2018
Figure 56: Pfizer, Inc. R&D Expenses (US$ Mn) and Y-o-Y Growth (%), 2015–2018
Figure 57: Pfizer, Inc. Breakdown of Net Sales (%), by Business Segment, 2018
Figure 58: Biocon Branded Formulations Segment Revenue (US$ Mn) and Y-o-Y Growth (%), 2015–2018
Figure 59: Biocon Breakdown of Net Sales (%), by Region, 2018
Figure 60: Biocon R&D Expenses (US$ Mn) and Y-o-Y Growth (%), 2015–2018
Figure 61: Biocon Breakdown of Net Sales (%), by Business Segment, 2018
Figure 62: Dr. Reddy’s Laboratories Ltd. Revenue (US$ Mn) and Y-o-Y Growth (%), 2015–2018
Figure 63: Dr. Reddy’s Laboratories Ltd. Breakdown of Net Sales (% Share), by Region (2018)
Figure 64: Dr. Reddy’s Laboratories Ltd. R&D Expenses (US$ Mn) and Y-o-Y Growth (%), 2015–2018
Figure 65: Dr. Reddy’s Laboratories Ltd. Breakdown of Net Sales (% Share), by Business Segment (2018)
Figure 66: Zydus Cadila Revenue (US$ Mn) and Y-o-Y Growth (%), 2015–2018
Figure 67: Zydus Cadila Breakdown of Net Sales (%), by Region, 2018
Figure 68: Zydus Cadila Pharmaceutical Business Segment R&D Expenses (US$ Mn) and Y-o-Y Growth (%), 2015–2018
Figure 69: Intas Pharmaceuticals Ltd. Intas Pharmaceuticals Ltd. Pharmaceuticals Segment Revenue (US$ Mn) and Y-o-Y Growth (%), 2015–2018
Figure 70: STENTYS SA Revenue (US$ Mn) and Y-o-Y Growth (%), 2015–2018
Figure 71: STENTYS SA R&D Expenses (US$ Mn) and Y-o-Y Growth (%), 2015–2018
Figure 72: Torrent Pharmaceuticals Ltd. Revenue (US$ Mn) and Y-o-Y Growth (%), 2015–2018
Figure 73: Torrent Pharmaceuticals Ltd. Breakdown of Net Sales (%), by Region, 2018
Figure 74: Torrent Pharmaceuticals Ltd. R&D Expenses (US$ Mn) and Y-o-Y Growth (%), 2015–2018
Copyright © Transparency Market Research, Inc. All Rights reserved
Trust Online

Sirolimus Market
