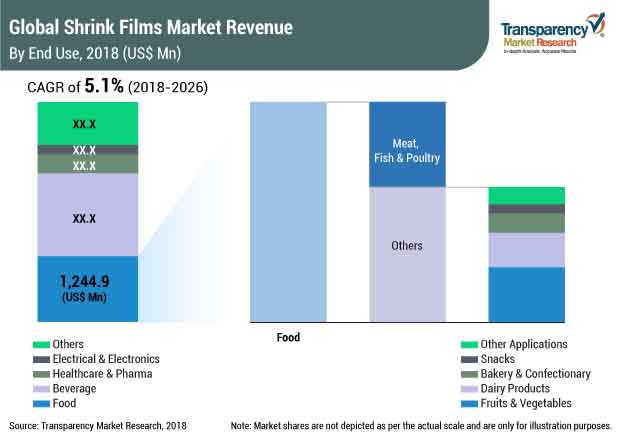
The global market for shrink films was valued at US$ 4.16 Bn in 2018 and is projected to expand at a CAGR of 5.1%, during the forecast period (2018-2026).
Among the packaging industry, flexible packaging is one of the fastest growing segments and is widely replacing rigid packaging segment for various applications. Shrink films are flexible packaging films that are sealed around a product and shrink tightly when heat is applied. Shrink films find wide usage in packaging of food items and other consumer goods.
Shrink films find applications in packaging of food such as meat, poultry and seafood, bakery & confectionary, and various others. Shrink films are primarily made up of polyethylene material which is cost efficient as compared to other raw materials. On the other hand, polypropylene shrink films have high heat resistance and provide good transparency as compared to polyethylene and polyvinyl chloride shrink films. The global shrink films market is mainly structured in regions such as Western Europe and North America whereas, the Asia Pacific region is expected to provide a broader opportunity during the forecast period. The global shrink films market is influenced by the high demand from the food and beverage industry.
Globalization has led to rapid growth of import and export businesses of manufacturers worldwide. This has resulted in large supply chains and increased the role of logistics, with companies adopting flexible packaging to optimize packaging systems for efficient and effective delivery. Therefore, driving the demand for shrink films in the market. Low-cost, lightweight, and damage-resistant features of shrink films packaging make it the highly-sought after packaging product in the transport industry. Also, rigid packaging is being rapidly replaced by flexible packaging, due to its characteristics such as enhanced barrier resistance, re-sealable closures, cost efficiency, and lightweight qualities. Among several variants of flexible packaging, shrink films find numerous applications throughout the supply chain. There is an increasing demand for shrink films for packaging and transportation in every sector.
Moreover, e-commerce players have taken to shrink films seeing their advantages over stretch and other films. Key features of shrink films such as cost efficiency, high barrier resistance, and damage control packaging characteristics have proved beneficial for e-commerce players to ensure convenient and efficient delivery of their products. However, increasing government rules and regulations towards plastic packaging can hinder the shrink films market in the near future.
The global shrink films market has been segmented on the basis of material type, barrier type, thickness, packaging application, end use, and region.
On the basis of thickness, the shrink films market study includes below 15 microns, 15 to 30 microns, 30 to 50 microns, and above 50 microns segments. Of these, shrink films of thickness 15 to 30 microns account for the major share of the global shrink films market.
The barrier type considered in the shrink films market study includes low barrier, medium barrier, high barrier, and ultra-high barrier films. Of these, the medium barrier shrink films segment accounts for the major share of the global shrink films.
On the basis of material, the shrink films market has been segmented into various categories such as polyethylene, polypropylene, PET, EVOH, PVC, PVDC, and PA respectively. Of these, the polyethylene segment will grow at a healthy CAGR in the global shrink films market.
On the basis of packaging applications, the shrink films market has been segmented into three categories such as wraps, bags and labels. Of these, the wraps segment will grow at a healthy CAGR in the global Shrink films market.
On the basis of end use, the global shrink films market has been segmented into seven segments that are food, beverage, electrical and electronics, personal care and cosmetics, textile and apparels, and other consumer goods. The beverage segment in the global shrink films market is expected to heavily dominate the market during the forecast period.
The key manufacturers in the shrink films market profiled in this report include– Sealed Air Corporation, Kureha Corporation, Winpak Ltd., Flexopack S.A., Coveris Holdings S.A., PREMIUMPACK GmbH, Schur Flexibles Group, Kuplast Matejka Kumar S.P., Buergofol GmbH, Allfo Vakuumverpackungen Hans Bresele Kg, Atlantis-Pak Co. Ltd., Inauen Group, Gap Foil, Allen Plastic Industries Co., Ltd., Transcontinental Inc., BP Plastics Holding Bhd, Crawford Packaging, SYFAN USA and Idemitsu Unitech CO., Ltd. Many local and unrecognized players are expected to contribute to the global shrink films market during 2018-26.
There are multiple players operating in the global stretch and shrink films market. However, there is an increasing shift in dynamics toward market consolidation. This is attributed to mergers and acquisitions by major companies operating in the U.S. and Europe in order to capitalize on untapped market potential in APAC and Africa.
1. Executive Summary
1.1. Market Overview
1.2. Market Analysis
1.3. TMR Analysis and Recommendations
1.4. Wheel of Opportunity
2. Market Introduction
2.1. Market Taxonomy
2.2. Market Definition
3. Market Viewpoint
3.1. Global Packaging Industry Overview
3.2. Global Flexible Packaging Industry Overview
3.3. High Barrier Packaging Films Market Overview
3.4. Macroeconomic Indicators & Correlation Analysis
3.5. Forecast Factors
3.6. Porter’s Analysis
3.7. PESTLE Analysis for Top 5 Countries
3.8. Value Chain Analysis
3.8.1. Key Participants
3.8.1.1. Raw Material Suppliers
3.8.1.2. Shrink Film Manufacturers
3.8.1.3. Converters
3.8.1.4. End users
3.8.2. Profitability Margin
3.9. Market Dynamics
3.9.1. Drivers
3.9.2. Restraints
3.9.3. Opportunities
3.9.4. Trends
4. Global Shrink Films Market Analysis
4.1. Market Value (US$ Mn) and Volume (Tons) Analysis & Forecast
4.2. Y-o-Y Growth Projections
4.3. Absolute $ Opportunity Analysis
5. Global Shrink Films Market Analysis, by Barrier Type
5.1. Introduction
5.1.1. Market Value Share Analysis, by Barrier Type
5.1.2. Y-o-Y Growth Analysis, by Barrier Type
5.2. Market Value (US$ Mn) and Volume (Tons) Forecast, by Barrier Type 2018-2026
5.2.1. Low
5.2.2. Medium
5.2.3. High
5.2.4. Ultra- High
5.3. Market Attractiveness Analysis, by Barrier Type
6. Global Shrink Films Market Analysis, by Material Type
6.1. Section Summary
6.2. Introduction
6.2.1. Market Value Share Analysis, by Material Type
6.2.2. Y-o-Y Growth Analysis, by Material Type
6.3. Market Value (US$ Mn) and Volume (Tons) Analysis, by Material Type 2018-2026
6.3.1. PE
6.3.1.1. HDPE
6.3.1.2. LDPE
6.3.1.3. LLDPE
6.3.2. PP
6.3.3. PET
6.3.4. EVOH
6.3.5. PVC
6.3.6. PVDC
6.3.7. PA
6.4. Market Attractiveness Analysis, by Material Type
7. Global Shrink Films Market Analysis, by Thickness
7.1. Section Summary
7.2. Introduction
7.2.1. Market Value Share Analysis, by Thickness
7.2.2. Y-o-Y Growth Analysis, by Thickness
7.3. Market Value (US$ Mn) and Volume (Tons) Analysis, by Thickness 2018-2026
7.3.1. Less than 50 micron
7.3.2. 50-100 micron
7.3.3. 100-150 micron
7.3.4. Above 150 micron
7.4. Market Attractiveness Analysis, by Thickness
8. Global Shrink Films Market Analysis, by Packaging Application
8.1. Section Summary
8.2. Introduction
8.2.1. Market Value Share Analysis, by Packaging Application
8.2.2. Y-o-Y Growth Analysis, by Packaging Application
8.3. Market Value (US$ Mn) and Volume (Tons) Analysis, by Packaging Application 2018-2026
8.3.1. Wraps
8.3.2. Bags
8.3.3. Labels
8.4. Market Attractiveness Analysis, by Packaging Application
9. Global Shrink Films Market Analysis, by End user
9.1. Section Summary
9.2. Introduction
9.2.1. Market Value Share Analysis, by End user
9.2.2. Y-o-Y Growth Analysis, by End user
9.3. Market Value (US$ Mn) and Volume (Tons) Analysis, by End user 2018-2026
9.3.1. Food
9.3.1.1. Fruits & Vegetables
9.3.1.2. Dairy Products
9.3.1.3. Food Grains
9.3.1.4. Meat, Poultry, and Seafood
9.3.1.5. Sauces, Dips, and Condiments
9.3.1.6. Chilled and Frozen Food
9.3.1.7. Confectionery Items
9.3.1.8. Snacks
9.3.1.9. Bakery Items
9.3.1.10. Other Foods
9.3.2. Beverages
9.3.2.1. Alcoholic
9.3.2.2. Non-alcoholic
9.3.3. Healthcare & Pharmaceuticals
9.3.4. Electricals & Electronics
9.3.5. Personal Care & Cosmetics
9.3.6. Textile & Apparels
9.3.7. Other Consumer Goods
9.4. Market Attractiveness Analysis, by End user
10. Global Shrink Films Market Analysis, by Region
10.1. Section Summary
10.2. Introduction
10.2.1. Market Value Share Analysis, by Region
10.2.2. Y-o-Y Growth Analysis, by Region
10.3. Market Value (US$ Mn) and Volume (Tons) Analysis, by Region 2018-2026
10.3.1. North America
10.3.2. Latin America
10.3.3. Europe
10.3.4. Asia Pacific (Asia Pacific )
10.3.5. Middle East & Africa (MEA)
10.4. Market Attractiveness Analysis, by Region
11. North America Shrink Films Market Analysis
11.1. Introduction
11.2. Pricing Analysis
11.3. Market Value (US$ Mn) and Volume (Tons) Analysis, by Country, 2018-2026
11.3.1. U.S.
11.3.2. Canada
11.4. Market Value (US$ Mn) and Volume (Tons) Forecast, by Barrier Type 2018-2026
11.4.1. Low
11.4.2. Medium
11.4.3. High
11.4.4. Ultra- High
11.5. Market Value (US$ Mn) and Volume (Tons) Analysis, by Material Type 2018-2026
11.5.1. PE
11.5.1.1. HDPE
11.5.1.2. LDPE
11.5.1.3. LLDPE
11.5.2. PP
11.5.3. PET
11.5.4. EVOH
11.5.5. PVC
11.5.6. PVDC
11.5.7. PA
11.6. Market Value (US$ Mn) and Volume (Tons) Analysis, by Thickness 2018-2026
11.6.1. Less than 50 micron
11.6.2. 50-100 micron
11.6.3. 100-150 micron
11.6.4. Above 150 micron
11.7. Market Value (US$ Mn) and Volume (Tons) Analysis, by Packaging Application 2018-2026
11.7.1. Wraps
11.7.2. Bags
11.7.3. Labels
11.8. Market Value (US$ Mn) and Volume (Tons) Forecast, by End user 2018-2026
11.8.1. Food
11.8.1.1. Fruits & Vegetables
11.8.1.2. Dairy Products
11.8.1.3. Food Grains
11.8.1.4. Meat, Poultry, and Seafood
11.8.1.5. Sauces, Dips, and Condiments
11.8.1.6. Chilled and Frozen Food
11.8.1.7. Confectionery Items
11.8.1.8. Snacks
11.8.1.9. Bakery Items
11.8.1.10. Other Foods
11.8.2. Beverages
11.8.2.1. Alcoholic
11.8.2.2. Non-alcoholic
11.8.3. Healthcare & Pharmaceuticals
11.8.4. Electricals & Electronics
11.8.5. Personal Care & Cosmetics
11.8.6. Textile & Apparels
11.8.7. Other Consumer Goods
11.9. Key Representative Market Participants
11.10. Key Market Participants – Intensity Mapping
12. Latin America Shrink Films Market Analysis
12.1. Introduction
12.2. Pricing Analysis
12.3. Market Value (US$ Mn) and Volume (Tons) Analysis, by Country, 2018-2026
12.3.1. Brazil
12.3.2. Mexico
12.3.3. Argentina
12.3.4. Rest of Latin America
12.4. Market Value (US$ Mn) and Volume (Tons) Forecast, by Barrier Type 2018-2026
12.4.1. Low
12.4.2. Medium
12.4.3. High
12.4.4. Ultra- High
12.5. Market Value (US$ Mn) and Volume (Tons) Analysis, by Material Type 2018-2026
12.5.1. PE
12.5.1.1. HDPE
12.5.1.2. LDPE
12.5.1.3. LLDPE
12.5.2. PP
12.5.3. PET
12.5.4. EVOH
12.5.5. PVC
12.5.6. PVDC
12.5.7. PA
12.6. Market Value (US$ Mn) and Volume (Tons) Analysis, by Thickness 2018-2026
12.6.1. Less than 50 micron
12.6.2. 50-100 micron
12.6.3. 100-150 micron
12.6.4. Above 150 micron
12.7. Market Value (US$ Mn) and Volume (Tons) Analysis, by Packaging Application 2018-2026
12.7.1. Wraps
12.7.2. Bags
12.7.3. Labels
12.8. Market Value (US$ Mn) and Volume (Tons) Forecast, by End user 2018-2026
12.8.1. Food
12.8.1.1. Fruits & Vegetables
12.8.1.2. Dairy Products
12.8.1.3. Food Grains
12.8.1.4. Meat, Poultry, and Seafood
12.8.1.5. Sauces, Dips, and Condiments
12.8.1.6. Chilled and Frozen Food
12.8.1.7. Confectionery Items
12.8.1.8. Snacks
12.8.1.9. Bakery Items
12.8.1.10. Other Foods
12.8.2. Beverages
12.8.2.1. Alcoholic
12.8.2.2. Non-alcoholic
12.8.3. Healthcare & Pharmaceuticals
12.8.4. Electricals & Electronics
12.8.5. Personal Care & Cosmetics
12.8.6. Textile & Apparels
12.8.7. Other Consumer Goods
12.9. Key Representative Market Participants
12.10. Key Market Participants – Intensity Mapping
13. Europe Shrink Films Market Analysis
13.1. Introduction
13.2. Pricing Analysis
13.3. Market Value (US$ Mn) and Volume (Tons) Analysis, by Country, 2018-2026
13.3.1. Germany
13.3.2. Italy
13.3.3. France
13.3.4. U.K.
13.3.5. Spain
13.3.6. Benelux
13.3.7. Nordic
13.3.8. Russia
13.3.9. Poland
13.3.10. Rest of Europe
13.4. Market Value (US$ Mn) and Volume (Tons) Forecast, by Barrier Type 2018-2026
13.4.1. Low
13.4.2. Medium
13.4.3. High
13.4.4. Ultra- High
13.5. Market Value (US$ Mn) and Volume (Tons) Analysis, by Material Type 2018-2026
13.5.1. PE
13.5.1.1. HDPE
13.5.1.2. LDPE
13.5.1.3. LLDPE
13.5.2. PP
13.5.3. PET
13.5.4. EVOH
13.5.5. PVC
13.5.6. PVDC
13.5.7. PA
13.6. Market Value (US$ Mn) and Volume (Tons) Analysis, by Thickness 2018-2026
13.6.1. Less than 50 micron
13.6.2. 50-100 micron
13.6.3. 100-150 micron
13.6.4. Above 150 micron
13.7. Market Value (US$ Mn) and Volume (Tons) Analysis, by Packaging Application 2018-2026
13.7.1. Wraps
13.7.2. Bags
13.7.3. Labels
13.8. Market Value (US$ Mn) and Volume (Tons) Forecast, by End user 2018-2026
13.8.1. Food
13.8.1.1. Fruits & Vegetables
13.8.1.2. Dairy Products
13.8.1.3. Food Grains
13.8.1.4. Meat, Poultry, and Seafood
13.8.1.5. Sauces, Dips, and Condiments
13.8.1.6. Chilled and Frozen Food
13.8.1.7. Confectionery Items
13.8.1.8. Snacks
13.8.1.9. Bakery Items
13.8.1.10. Other Foods
13.8.2. Beverages
13.8.2.1. Alcoholic
13.8.2.2. Non-alcoholic
13.8.3. Healthcare & Pharmaceuticals
13.8.4. Electricals & Electronics
13.8.5. Personal Care & Cosmetics
13.8.6. Textile & Apparels
13.8.7. Other Consumer Goods
13.9. Key Representative Market Participants
13.10. Key Market Participants – Intensity Mapping
14. Asia Pacific Shrink Films Market Analysis
14.1. Introduction
14.2. Pricing Analysis
14.3. Market Value (US$ Mn) and Volume (Tons) Analysis, by Country, 2018-2026
14.3.1. China
14.3.2. India
14.3.3. ASEAN
14.3.4. Australia and New Zealand
14.3.5. Japan
14.3.6. Rest of Asia Pacific
14.4. Market Value (US$ Mn) and Volume (Tons) Forecast, by Barrier Type 2018-2026
14.4.1. Low
14.4.2. Medium
14.4.3. High
14.4.4. Ultra- High
14.5. Market Value (US$ Mn) and Volume (Tons) Analysis, by Material Type 2018-2026
14.5.1. PE
14.5.1.1. HDPE
14.5.1.2. LDPE
14.5.1.3. LLDPE
14.5.2. PP
14.5.3. PET
14.5.4. EVOH
14.5.5. PVC
14.5.6. PVDC
14.5.7. PA
14.6. Market Value (US$ Mn) and Volume (Tons) Analysis, by Thickness 2018-2026
14.6.1. Less than 50 micron
14.6.2. 50-100 micron
14.6.3. 100-150 micron
14.6.4. Above 150 micron
14.7. Market Value (US$ Mn) and Volume (Tons) Analysis, by Packaging Application 2018-2026
14.7.1. Wraps
14.7.2. Bags
14.7.3. Labels
14.8. Market Value (US$ Mn) and Volume (Tons) Forecast, by End user 2018-2026
14.8.1. Food
14.8.1.1. Fruits & Vegetables
14.8.1.2. Dairy Products
14.8.1.3. Food Grains
14.8.1.4. Meat, Poultry, and Seafood
14.8.1.5. Sauces, Dips, and Condiments
14.8.1.6. Chilled and Frozen Food
14.8.1.7. Confectionery Items
14.8.1.8. Snacks
14.8.1.9. Bakery Items
14.8.1.10. Other Foods
14.8.2. Beverages
14.8.2.1. Alcoholic
14.8.2.2. Non-alcoholic
14.8.3. Healthcare & Pharmaceuticals
14.8.4. Electricals & Electronics
14.8.5. Personal Care & Cosmetics
14.8.6. Textile & Apparels
14.8.7. Other Consumer Goods
14.9. Key Representative Market Participants
14.10. Key Market Participants – Intensity Mapping
15. Middle East & Africa Shrink Films Market Analysis
15.1. Introduction
15.2. Pricing Analysis
15.3. Market Value (US$ Mn) and Volume (Tons) Forecast, by Country, 2018-2026
15.3.1. GCC Countries
15.3.2. Northern Africa
15.3.3. South Africa
15.3.4. Rest of MEA
15.4. Market Value (US$ Mn) and Volume (Tons) Forecast, by Barrier Type 2018-2026
15.4.1. Low
15.4.2. Medium
15.4.3. High
15.4.4. Ultra- High
15.5. Market Value (US$ Mn) and Volume (Tons) Analysis, by Material Type 2018-2026
15.5.1. PE
15.5.1.1. HDPE
15.5.1.2. LDPE
15.5.1.3. LLDPE
15.5.2. PP
15.5.3. PET
15.5.4. EVOH
15.5.5. PVC
15.5.6. PVDC
15.5.7. PA
15.6. Market Value (US$ Mn) and Volume (Tons) Analysis, by Thickness 2018-2026
15.6.1. Less than 50 micron
15.6.2. 50-100 micron
15.6.3. 100-150 micron
15.6.4. Above 150 micron
15.7. Market Value (US$ Mn) and Volume (Tons) Analysis, by Packaging Application 2018-2026
15.7.1. Wraps
15.7.2. Bags
15.7.3. Labels
15.8. Market Value (US$ Mn) and Volume (Tons) Forecast, by End user 2018-2026
15.8.1. Food
15.8.1.1. Fruits & Vegetables
15.8.1.2. Dairy Products
15.8.1.3. Food Grains
15.8.1.4. Meat, Poultry, and Seafood
15.8.1.5. Sauces, Dips, and Condiments
15.8.1.6. Chilled and Frozen Food
15.8.1.7. Confectionery Items
15.8.1.8. Snacks
15.8.1.9. Bakery Items
15.8.1.10. Other Foods
15.8.2. Beverages
15.8.2.1. Alcoholic
15.8.2.2. Non-alcoholic
15.8.3. Healthcare & Pharmaceuticals
15.8.4. Electricals & Electronics
15.8.5. Personal Care & Cosmetics
15.8.6. Textile & Apparels
15.8.7. Other Consumer Goods
15.9. Key Representative Market Participants
15.10. Key Market Participants – Intensity Mapping
16. Market Structure Analysis
16.1. Market Analysis by Tier of Companies
16.1.1. By Large, Medium, and Small
16.2. Market Concentration
16.2.1. By Top 5 and by Top 10
16.3. Production Thickness Share Analysis
16.3.1. By Large, Medium, and Small
16.3.2. By Top 5 and Top 10
16.4. Market Share Analysis of Top 10 Players
16.4.1. The Americas Market Share Analysis, by Top Players
16.4.2. EMEA Market Share Analysis, by Top Players
16.4.3. Asia Pacific Market Share Analysis, by Top Players
16.5. Market Presence Analysis
16.5.1. By Regional footprint of Players
16.5.2. Product footprint, by Players
16.5.3. Channel footprint, by Players
17. Competition Analysis
17.1. Competition Dashboard
17.2. Profitability and Gross Margin Analysis By Competition
17.3. Competition Developments
17.4. Competition Deep Dive (20 Companies)
17.4.1. Sealed Air Corporation
17.4.1.1. Overview
17.4.1.2. Product Portfolio
17.4.1.3. Profitability
17.4.1.4. Production Footprint
17.4.1.5. Sales Footprint
17.4.1.6. Channel Footprint
17.4.1.7. Competition Benchmarking
17.4.1.8. Strategy
17.4.1.8.1. Marketing Strategy
17.4.1.8.2. Product Strategy
17.4.1.8.3. Channel Strategy
17.4.2. Kureha Corporation
17.4.3. Winpak Ltd.
17.4.4. Flexopack S.A.
17.4.5. Coveris Holdings S.A.
17.4.6. PREMIUMPACK GmbH
17.4.7. Schur Flexibles Group
17.4.8. Kuplast Matejka Kumar S.P.
17.4.9. Buergofol GmbH
17.4.10. Allfo Vakuumverpackungen Hans Bresele Kg
17.4.11. Atlantis-Pak Co. Ltd.
17.4.12. Inauen Group
17.4.13. Gap Foil
17.4.14. Allen Plastic Industries Co., Ltd.
17.4.15. Transcontinental Inc.
17.4.16. BP Plastics Holding Bhd
17.4.17. Crawford Packaging
17.4.18. SYFAN USA
17.4.19. Idemitsu Unitech CO., Ltd.
List of Tables
Table 01: Global Shrink Films Market Value (US$ Mn) and Volume (Tonnes) 2017-2026, by Barrier Type
Table 02: Global Shrink Films Market Value (US$ Mn) and Volume (Tonnes) 2017-2026, by Material Type
Table 03: Global Shrink Films Market Value (US$ Mn) and Volume (Tonnes) 2017-2026, by Material Type
Table 04: Global Shrink Films Market Value (US$ Mn) and Volume (Tonnes) 2017-2026, by Thickness
Table 05: Global Shrink Films Market Value (US$ Mn) and Volume (Tonnes) 2017-2026, by Packaging Applications
Table 06: Global Shrink Films Market Value (US$ Mn) and Volume (Tonnes) 2017-2026, by End Use
Table 07: Global Shrink Films Market Value (US$ Mn) and Volume (Tonnes) 2017-2026, by End Use
Table 08: Global Shrink Films Market Value (US$ Mn) and Volume (Tonnes) 2017-2026, by Region
Table 09: North America Shrink Films Market Value (US$ Mn) and Volume (Tonnes) 2017-2026, by Barrier Type
Table 10: North America Shrink Films Market Value (US$ Mn) and Volume (Tonnes) 2017-2026, by Material Type
Table 11: North America Shrink Films Market Value (US$ Mn) and Volume (Tonnes) 2017-2026, by Material Type
Table 12: North America Shrink Films Market Value (US$ Mn) and Volume (Tonnes) 2017-2026, by Thickness
Table 13: North America Shrink Films Market Value (US$ Mn) and Volume (Tonnes) 2017-2026, by Packaging Applications
Table 14: North America Shrink Films Market Value (US$ Mn) and Volume (Tonnes) 2017-2026, by End Use
Table 15: North America Shrink Films Market Value (US$ Mn) and Volume (Tonnes) 2017-2026, by End Use
Table 16: North America Shrink Films Market Value (US$ Mn) and Volume (Tonnes) 2017-2026, by Region
Table 17: Latin America Shrink Films Market Value (US$ Mn) and Volume (Tonnes) 2017-2026, by Barrier Type
Table 18: Latin America Shrink Films Market Value (US$ Mn) and Volume (Tonnes) 2017-2026, by Material Type
Table 19: Latin America Shrink Films Market Value (US$ Mn) and Volume (Tonnes) 2017-2026, by Material Type
Table 20: Latin America Shrink Films Market Value (US$ Mn) and Volume (Tonnes) 2017-2026, by Thickness
Table 21: Latin America Shrink Films Market Value (US$ Mn) and Volume (Tonnes) 2017-2026, by Packaging Applications
Table 22: Latin America Shrink Films Market Value (US$ Mn) and Volume (Tonnes) 2017-2026, by End Use
Table 22: Latin America Shrink Films Market Value (US$ Mn) and Volume (Tonnes) 2017-2026, by End Use
Table 23: Latin America Shrink Films Market Value (US$ Mn) and Volume (Tonnes) 2017-2026, by Region
Table 24: Europe Shrink Films Market Value (US$ Mn) and Volume (Tonnes) 2017-2026, by Barrier Type
Table 25: Europe Shrink Films Market Value (US$ Mn) and Volume (Tonnes) 2017-2026, by Material Type
Table 26: Europe Shrink Films Market Value (US$ Mn) and Volume (Tonnes) 2017-2026, by Material Type
Table 27: Europe Shrink Films Market Value (US$ Mn) and Volume (Tonnes) 2017-2026, by Thickness
Table 28: Europe Shrink Films Market Value (US$ Mn) and Volume (Tonnes) 2017-2026, by Packaging Applications
Table 29: Europe Shrink Films Market Value (US$ Mn) and Volume (Tonnes) 2017-2026, by End Use
Table 30: Europe Shrink Films Market Value (US$ Mn) and Volume (Tonnes) 2017-2026, by End Use
Table 31: Europe Shrink Films Market Value (US$ Mn) and Volume (Tonnes) 2017-2026, by Region
Table 32: APAC Shrink Films Market Value (US$ Mn) and Volume (Tonnes) 2017-2026, by Barrier Type
Table 33: APAC Shrink Films Market Value (US$ Mn) and Volume (Tonnes) 2017-2026, by Material Type
Table 34: APAC Shrink Films Market Value (US$ Mn) and Volume (Tonnes) 2017-2026, by Material Type
Table 35: APAC Shrink Films Market Value (US$ Mn) and Volume (Tonnes) 2017-2026, by Thickness
Table 36: APAC Shrink Films Market Value (US$ Mn) and Volume (Tonnes) 2017-2026, by Packaging Applications
Table 37: APAC Shrink Films Market Value (US$ Mn) and Volume (Tonnes) 2017-2026, by End Use
Table 38: APAC Shrink Films Market Value (US$ Mn) and Volume (Tonnes) 2017-2026, by End Use
Table 39: APAC Shrink Films Market Value (US$ Mn) and Volume (Tonnes) 2017-2026, by Region
Table 40: MEA Shrink Films Market Value (US$ Mn) and Volume (Tonnes) 2017-2026, by Barrier Type
Table 41: MEA Shrink Films Market Value (US$ Mn) and Volume (Tonnes) 2017-2026, by Material Type
Table 42: MEA Shrink Films Market Value (US$ Mn) and Volume (Tonnes) 2017-2026, by Material Type
Table 43: MEA Shrink Films Market Value (US$ Mn) and Volume (Tonnes) 2017-2026, by Thickness
Table 44: MEA Shrink Films Market Value (US$ Mn) and Volume (Tonnes) 2017-2026, by Packaging Applications
Table 45: MEA Shrink Films Market Value (US$ Mn) and Volume (Tonnes) 2017-2026, by End Use
Table 46: MEA Shrink Films Market Value (US$ Mn) and Volume (Tonnes) 2017-2026, by End Use
Table 47: MEA Shrink Films Market Value (US$ Mn) and Volume (Tonnes) 2017-2026, by Region
List of Figures
Figure 01: Global Shrink Films Market Value Share (2018 & 2026), by Barrier Type
Figure 02: Global Shrink Films Market Y-o-Y growth, by Barrier Type2017-2026
Figure 03: Global Shrink Films Market Attractiveness Analysis, by Barrier Type, 2018
Figure 04: Global Shrink Films Market Value Share (2018 & 2026), by Material Type
Figure 05: Global Shrink Films Market Y-o-Y growth, by Material Type 2017-2026
Figure 06: Global Shrink Films Market Attractiveness Analysis, by Material Type, 2018
Figure 07: Global Shrink Films Market Value Share (2018 & 2026), by Thickness
Figure 08: Global Shrink Films Market Y-o-Y growth, by Thickness 2017-2026
Figure 09: Global Shrink Films Market Attractiveness Analysis, by Thickness, 2018
Figure 10: Global Shrink Films Market Value Share (2018 & 2026), by Packaging Applications
Figure 11: Global Shrink Films Market Y-o-Y growth, by Packaging Applications 2017-2026
Figure 12: Global Shrink Films Market Attractiveness Analysis, by Packaging Applications, 2018
Figure 13: Global Shrink Films Market Value Share (2018 & 2026), by End Use
Figure 14: Global Shrink Films Market Y-o-Y growth, by End Use 2017-2026
Figure 15: Global Shrink Films Market Attractiveness Analysis, by End Use, 2018
Figure 16: Global Shrink Films Market Value Share (2018 & 2026), by Region
Figure 17: Global Shrink Films Market Y-o-Y growth, by Region 2017-2026
Figure 18: Global Shrink Films Market Attractiveness Analysis, by Region, 2018
Figure 19: Global Shrink Films Market Value (US$ Mn) by Biodegradable Plastic Material Sub-Segments, 2017–2026
Figure 20: Global Shrink Films Market volume (’000 Tons) by Biodegradable Plastic Material Sub-Segments, 2017–2026
Figure 22: North America Shrink Films Market Value Share by Material Type, 2018
Figure 24: North America Shrink Films Market Value Share by Packaging Applications, 2018
Figure 21: North America Shrink Films Market Value Share by Barrier Type, 2018
Figure 23: North America Shrink Films Market Value Share by Thickness, 2018
Figure 25 : North America Shrink Films Market Value Share by End Use, 2018
Figure 26: North America Shrink Films Market Attractiveness Index, by Country, 2018–2026
Figure 27: North America Shrink Films Market Attractiveness Index ,by Barrier Type, 2018–2026
Figure 28: North America Shrink Films Market Attractiveness Index ,by Material Type, 2018–2026
Figure 29: North America Shrink Films Market Attractiveness Index, by Thickness, 2018–2026
Figure 30: North America Shrink Films Market Attractiveness Index ,by Applications, 2018–2026
Figure 31: North America Shrink Films Market Attractiveness Index ,by End Use, 2018–2026
Figure 33: Latin America Shrink Films Market Value Share by Material Type, 2018
Figure 35: Latin America Shrink Films Market Value Share by Packaging Applications, 2018
Figure 32: Latin America Shrink Films Market Value Share by Barrier Type, 2018
Figure 34: Latin America Shrink Films Market Value Share by Thickness, 2018
Figure 36: Latin America Shrink Films Market Value Share by End Use, 2018
Figure 37: Latin America Shrink Films Market Attractiveness Index, by Country, 2018–2026
Figure 38: Latin America Shrink Films Market Attractiveness Index ,by Barrier Type, 2018–2026
Figure 39: Latin America Shrink Films Market Attractiveness Index ,by Material Type, 2018–2026
Figure 40: Latin America Shrink Films Market Attractiveness Index, by Thickness, 2018–2026
Figure 41: Latin America Shrink Films Market Attractiveness Index ,by Applications, 2018–2026
Figure 42: Latin America Shrink Films Market Attractiveness Index ,by End Use, 2018–2026
Figure 44: Europe Shrink Films Market Value Share by Material Type, 2018
Figure 46: Europe Shrink Films Market Value Share by Packaging Applications, 2018
Figure 43: Europe Shrink Films Market Value Share by Barrier Type, 2018
Figure 45: Europe Shrink Films Market Value Share by Thickness, 2018
Figure 47: Europe Shrink Films Market Value Share by End Use, 2018
Figure 48: Europe Shrink Films Market Attractiveness Index, by Country, 2018–2026
Figure 49: Europe Shrink Films Market Attractiveness Index ,by Barrier Type, 2018–2026
Figure 50: Europe Shrink Films Market Attractiveness Index ,by Material Type, 2018–2026
Figure 51: Europe Shrink Films Market Attractiveness Index, by Thickness, 2018–2026
Figure 52: Europe Shrink Films Market Attractiveness Index ,by Applications, 2018–2026
Figure 53: Europe Shrink Films Market Attractiveness Index ,by End Use, 2018–2026
Figure 55: APAC Shrink Films Market Value Share by Material Type, 2018
Figure 57: APAC Shrink Films Market Value Share by Packaging Applications, 2018
Figure 54: APAC Shrink Films Market Value Share by Barrier Type, 2018
Figure 56: APAC Shrink Films Market Value Share by Thickness, 2018
Figure 58: APAC Shrink Films Market Value Share by End Use, 2018
Figure 59: APAC Shrink Films Market Attractiveness Index, by Country, 2018–2026
Figure 60: APAC Shrink Films Market Attractiveness Index ,by Barrier Type, 2018–2026
Figure 61: APAC Shrink Films Market Attractiveness Index ,by Material Type, 2018–2026
Figure 62: APAC Shrink Films Market Attractiveness Index, by Thickness, 2018–2026
Figure 63: APAC Shrink Films Market Attractiveness Index ,by Applications, 2018–2026
Figure 64: APAC Shrink Films Market Attractiveness Index ,by End Use, 2018–2026
Figure 66: MEA Shrink Films Market Value Share by Material Type, 2018
Figure 68: MEA Shrink Films Market Value Share by Packaging Applications, 2018
Figure 65: MEA Shrink Films Market Value Share by Barrier Type, 2018
Figure 67: MEA Shrink Films Market Value Share by Thickness, 2018
Figure 69: MEA Shrink Films Market Value Share by End Use, 2018
Figure 70: MEA Shrink Films Market Attractiveness Index, by Country, 2018–2026
Figure 71: MEA Shrink Films Market Attractiveness Index ,by Barrier Type, 2018–2026
Figure 72: MEA Shrink Films Market Attractiveness Index ,by Material Type, 2018–2026
Figure 73: MEA Shrink Films Market Attractiveness Index, by Thickness, 2018–2026
Figure 74: MEA Shrink Films Market Attractiveness Index ,by Applications, 2018–2026
Figure 75: MEA Shrink Films Market Attractiveness Index ,by End Use, 2018–2026
Copyright © Transparency Market Research, Inc. All Rights reserved
Trust Online

Shrink Films Market
