Global Sexually Transmitted Diseases Drug Market: Snapshot
Sexually transmitted diseases (STDs), also referred as venereal diseases are infections that can pass from person to person during sex. These diseases are caused mainly due to bacteria, viruses, and / or parasites. Sexually transmitted diseases (STDs) often go undiagnosed because these infections usually do not exhibit visual symptoms. Changes in urination, Pain during sex, unusual discharge from the penis, abnormal vaginal discharge or bleeding, bumps or sores, pain in the pelvic or abdominal region, burning or itching in the vaginal area are most common symptoms for sexually transmitted diseases (STDs). These all symptoms help to diagnose sexually transmitted diseases (STDs). Nucleic Acid Amplification Tests (NAAT), direct fluorescent tests and others test recommended by healthcare specialist to confirm sexually transmitted diseases (STDs). Chlamydia, gonorrhea, HIV/AIDS, Human papillomavirus infection and syphilis are the most common types of sexually transmitted diseases (STDs. As per WHO 2015 report, near about 1.1 billion people had sexually transmitted diseases (STDs) other than HIV/AIDS. About 500 million people were infected with either chlamydia, gonorrhea syphilis or trichomoniasis. At least 250 million women suffering from human papillomavirus while 530 million case find with genital herpes.
Hospital Segment to Turn Lucrative, Fuelling Demand for Sexually Transmitted Disease Drugs
The global market for sexually transmitted diseases (STDs) drug is expanding significantly, owing to increased chances of infection led by increase in the life expectancy of people across the globe. Rise in incidences of unprotected sex has led to an increase in the prevalence of sexually transmitted diseases. A driving factor for the sexually transmitted diseases (STDs) drug is rising initiatives by governments and multiple agencies drawn up guidelines or recommendations for sexually transmitted diseases (STDs). Low voluntary screening rate for sexually transmitted diseases (STDs) is major restrain for this market.
The global sexually transmitted diseases (STDs) drug market can be segmented on the basis of disease type, therapy class, distribution channel, and region. On the bases of disease type, sexually transmitted diseases (STDs) drug market can be further segmented into chlamydia, gonorrhea, syphilis, human papillomavirus infection, HIV/AIDS and others. According to therapy class sexually transmitted diseases (STDs) drug market can be segmented into antibiotics, antiviral, vaccines and others. In terms of distribution channel, the sexually transmitted diseases (STDs) drug market can be segmented into hospitals pharmacies, retail pharmacies, online pharmacies and others. In terms of revenue, the hospitals segment held a significant share of the sexually transmitted diseases (STDs) drug market in 2016.
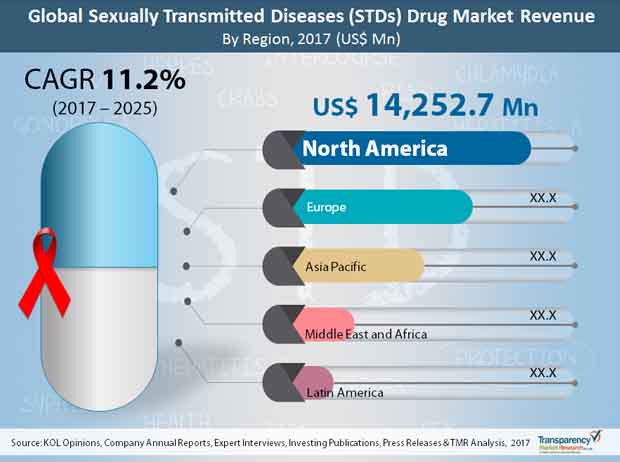
Rising Demand from Developing Economies to Support Market’s Expansion in Asia Pacific
In terms of region, the global sexually transmitted diseases (STDs) drug market can be segmented into North America, Europe, Asia Pacific, Latin America, and Middle East & Africa. North America is the leading market for sexually transmitted diseases (STDs) drug market, followed by Europe, Asia Pacific, Latin America, and Middle East & Africa. In terms of revenue, the U.S. holds a major share of the sexually transmitted diseases (STDs) drug market in North America. The market in Europe is expanding rapidly, due to increase in the patient population, especially in UK, Germany. Moreover, the market in Asia Pacific and Latin America is projected to expand significantly in the near future. Developing economies such as China and Japan are projected to contribute to growth of the market in APAC between 2017 and 2025, due to better health care infrastructure, economic growth, increase in the number of insurance payers, growth of the private health care sector, and increasing education awareness.
Key players operating in the global sexually transmitted diseases drug market are Pfizer INC, Hoffmann La Roche, Bayer Healthcare, Eli Lilly, Johnson & Johnson, Bristol-Myers Squibb Co. AbbVie, Inc., Gilead Sciences, GlaxoSmithKline Plc, and Merck & Co., Inc.
Sexually Transmitted Diseases (STDs) Drugs to Witness Notable Revenues Owing to Rising Cases of Unprotected Sex
According to a 2015 report by the World Health Organization, about 1.1 billion individuals had sexually transmitted diseases (sexually transmitted diseases) other than HIV/Helps. Around 500 million individuals were tainted with one or the other chlamydia, gonorrhea syphilis or trichomoniasis. At any rate 250 million ladies experiencing human papillomavirus while 530 million case find with genital herpes. Sexually transmitted diseases (sexually transmitted diseases), additionally alluded as venereal diseases are contaminations that can pass from one individual to another during sex. These diseases are caused basically because of microorganisms, infections, and/or parasites. Sexually transmitted diseases (sexually transmitted diseases) regularly go undiscovered in light of the fact that these contaminations ordinarily don't show visual manifestations. Changes in urine, agony during sex, uncommon release from the penis, unusual vaginal release or dying, knocks or bruises, torment in the pelvic or stomach district, consuming or tingling in the vaginal region are most basic side effects for sexually transmitted diseases (sexually transmitted diseases).
The worldwide market for sexually transmitted diseases (sexually transmitted diseases) drug is growing essentially, inferable from expanded odds of contamination drove by expansion in the future of individuals across the globe. Ascend in occurrences of unprotected sex has prompted an expansion in the predominance of sexually transmitted diseases. A driving element for the sexually transmitted diseases (sexually transmitted diseases) drug is rising drives by governments and various offices drawn up rules or suggestions for sexually transmitted diseases (sexually transmitted diseases). Low willful evaluating rate for sexually transmitted diseases (sexually transmitted diseases) is major limit for this market.
By the by, rising rate of various sexually transmitted contaminations like syphilis, herpes simplex infection, chlamydia, chancroid, trichomonas vaginalis, gonorrhea, and vaginitis, are making development of the worldwide sexually transmitted diseases drug market. Moreover, high number of pipeline drugs is required to set out worthwhile open doors for development of the worldwide sexually transmitted diseases drug market.
1. Preface
1.1. Market Definition and Scope
1.2. Market Segmentation
1.3. Key Research Objectives
1.4. Research Highlights
2. Research Approach & Methodology
3. Executive Summary
4. Market Definition
4.1. Introduction
4.1.1. Disease Definition
4.1.2. Industry Evolution / Developments
4.2. Market Overview
4.3. Key Market Conferences
4.4. Market Dynamics
4.4.1. Drivers
4.4.2. Restraints
4.4.3. Opportunities
4.4.4. Key Trends
4.5. Global STDs Drug Market Revenue (US$ Mn) Forecast, 2017–2025
4.5.1. Market Revenue Projections (US$ Mn)
4.7. Porter’s Five Force Analysis
4.8. Market Outlook
5. Global STDs Drug Market Analysis, by Disease Type
5.1. Introduction & Definition
5.2. Key Findings / Developments
5.3. Market Size (US$ Mn) Forecast By Disease Type
5.3.1. Chlamydia
5.3.2. Gonorrhea
5.3.3. Syphilis
5.3.4. Genital herpes
5.3.5. HPV
5.3.6. HIV/AIDS
5.3.7. Others
5.4 Global STDs Drug Market Attractiveness Analysis, by Disease Type
6. Global STDs Drug Market Analysis and Forecast, By Therapy Class
6.1. Introduction & Definition
6.2. Key Findings / Developments
6.3. Market Size (US$ Mn) Forecast, By Therapy Class
6.3.1. Antibiotics
6.3.2. Antiviral/Antiretrovirals
6.3.3. Vaccines
6.3.4. Others
6.4. Market Attractiveness By Application
7. Global STDs Drug Market Analysis and Forecast, By Distribution Channel
7.1. Introduction & Definition
7.2. Key Findings / Developments
7.3. Market Size (US$ Mn) Forecast, By Distribution Channel
7.3.1. Hospital Pharmacies
7.3.2. Retail Pharmacies
7.3.3. Online Pharmacies
7.3.4. Others
7.4. Market Attractiveness By Distribution Channel
8. Global STDs Drug Market Analysis and Forecast, By Region
8.1. Key Findings
8.2. Market Size (US$ Mn) Forecast By Region
8.2.1. North America
8.2.2. Europe
8.2.3. Asia Pacific
8.2.4. Latin America
8.2.5. Middle East & Africa
8.3. Market Attractiveness By Country/Region
9. North America STDs Drug Market Analysis and Forecast
9.1. Introduction & Definition
9.2. Key Findings / Developments
9.3. Market Size (US$ Mn) Forecast By Disease Type
9.3.1. Chlamydia
9.3.2. Gonorrhea
9.3.3. Syphilis
9.3.4. Genital herpes
9.3.5. HPV
9.3.6. HIV/AIDS
9.3.7. Others
9.4. Market Attractiveness Analysis, by Disease Type
9.5. Market Size (US$ Mn) Forecast, By Therapy Class
9.5.1. Antibiotics
9.5.2. Antiviral/Antiretrovirals
9.5.3. Vaccines
9.5.4. Others
9.6 Market Attractiveness By Therapy Class
9.7. Market Size (US$ Mn) Forecast, By Distribution Channel
9.7.1. Hospital Pharmacies
9.7.2. Retail Pharmacies
9.7.3. Online Pharmacies
9.7.4. Others
9.8. Market Attractiveness By Distribution Channel
9.9. Market Size (US$ Mn) Forecast By Country
9.9.1. United State
9.9.2. Canada
9.10. Market Attractiveness By Country
10. Europe STDs Drug Market Analysis and Forecast
10.1. Introduction & Definition
10.2. Key Findings / Developments
10.3. Market Size (US$ Mn) Forecast By Disease Type
10.3.1. Chlamydia
10.3.2. Gonorrhea
10.3.3. Syphilis
10.3.4. Genital herpes
10.3.5. HPV
10.3.6. HIV/AIDS
10.3.7. Others
10.4. Market Attractiveness Analysis, by Disease Type
10.5. Market Size (US$ Mn) Forecast, By Therapy Class
10.5.1. Antibiotics
10.5.2. Antiviral/Antiretrovirals
10.5.3. Vaccines
10.5.4. Others
10.6 Market Attractiveness By Therapy Class
10.7. Market Size (US$ Mn) Forecast, By Distribution Channel
10.7.1. Hospital Pharmacies
10.7.2. Retail Pharmacies
10.7.3. Online Pharmacies
10.7.4. Others
10.8. Market Attractiveness By Distribution Channel
10.9. Market Size (US$ Mn) Forecast By Country
10.9.1. Germany
10.9.2. U.K.
10.9.3. France
10.9.4. Italy
10.9.5. Spain
10.9.6. Rest of Europe
10.10. Market Attractiveness By Country
11. Asia Pacific STDs Drug Market Analysis and Forecast
11.1. Introduction & Definition
11.2. Key Findings / Developments
11.3. Market Size (US$ Mn) Forecast By Disease Type
11.3.1. Chlamydia
11.3.2. Gonorrhea
11.3.3. Syphilis
11.3.4. Genital herpes
11.3.5. HPV
11.3.6. HIV/AIDS
11.3.7. Others
11.4. Market Attractiveness Analysis, by Disease Type
11.5. Market Size (US$ Mn) Forecast, By Therapy Class
11.5.1. Antibiotics
11.5.2. Antiviral/Antiretrovirals
11.5.3. Vaccines
11.5.4. Others
11.6 Market Attractiveness By Therapy Class
11.7. Market Size (US$ Mn) Forecast, By Distribution Channel
11.7.1. Hospital Pharmacies
11.7.2. Retail Pharmacies
11.7.3. Online Pharmacies
11.7.4. Others
11.8. Market Attractiveness By Distribution Channel
11.9. Market Size (US$ Mn) Forecast By Country
11.9.1. China
11.9.2. India
11.9.3. Japan
11.9.4. Australia & New Zealand
11.9.5. Rest of APAC
11.10. Market Attractiveness By Country
12. Latin America STDs Drug Market Analysis and Forecast
12.1. Introduction & Definition
12.2. Key Findings / Developments
12.3. Market Size (US$ Mn) Forecast By Disease Type
12.3.1. Chlamydia
12.3.2. Gonorrhea
12.3.3. Syphilis
12.3.4. Genital herpes
12.3.5. HPV
12.3.6. HIV/AIDS
12.3.7. Others
12.4. Market Attractiveness Analysis, by Disease Type
12.5. Market Size (US$ Mn) Forecast, By Therapy Class
12.5.1. Antibiotics
12.5.2. Antiviral/Antiretrovirals
12.5.3. Vaccines
12.5.4. Others
12.6 Market Attractiveness By Therapy Class
12.7. Market Size (US$ Mn) Forecast, By Distribution Channel
12.7.1. Hospital Pharmacies
12.7.2. Retail Pharmacies
12.7.3. Online Pharmacies
12.7.4. Others
12.8. Market Attractiveness By Distribution Channel
12.9. Market Size (US$ Mn) Forecast By Country
12.9.1. Brazil
12.9.2. Mexico
12.9.3. Rest of LATAM
12.10. Market Attractiveness By Country
13. Middle East & Africa STDs Drug Market Analysis and Forecast
13.1. Introduction & Definition
13.2. Key Findings / Developments
13.3. Market Size (US$ Mn) Forecast By Disease Type
13.3.1. Chlamydia
13.3.2. Gonorrhea
13.3.3. Syphilis
13.3.4. Genital herpes
13.3.5. HPV
13.3.6. HIV/AIDS
13.3.7. Others
13.4. Market Attractiveness Analysis, by Disease Type
13.5. Market Size (US$ Mn) Forecast, By Therapy Class
13.5.1. Antibiotics
13.5.2. Antiviral/Antiretrovirals
13.5.3. Vaccines
13.5.4. Others
13.6 Market Attractiveness By Therapy Class
13.7. Market Size (US$ Mn) Forecast, By Distribution Channel
13.7.1. Hospital Pharmacies
13.7.2. Retail Pharmacies
13.7.3. Online Pharmacies
13.7.4. Others
13.8. Market Attractiveness By Distribution Channel
13.9. Market Size (US$ Mn) Forecast By Country
13.9.1. GCC Countries
13.9.2. S. Africa
13.9.3. Israel
13.9.4. Rest of MEA
13.10. Market Attractiveness By Country
14. Competition Landscape
14.1. Market Player – Competition Matrix (By Tier and Size of companies)
14.2. Company Profiles (Details – Overview, Financials, Recent Developments, Strategy)
14.2.1. Gilead Sciences, Inc.
14.2.1.1 Company Overview
14.2.1.2 Product Portfolio
14.2.1.3 SWOT Analysis
14.2.1.4 Strategic Overview
14.2.2. GlaxoSmithKline plc
14.2.2.1 Company Overview
14.2.2.2 Product Portfolio
14.2.2.3 SWOT Analysis
14.2.2.4 Strategic Overview
14.2.3. Merck & Co., Inc.
14.2.3.1 Company Overview
14.2.3.2 Product Portfolio
14.2.3.3 SWOT Analysis
14.2.3.4 Strategic Overview
14.2.4. Johnson & Johnson
14.2.4.1 Company Overview
14.2.4.2 Product Portfolio
14.2.4.3 SWOT Analysis
14.2.4.4 Strategic Overview
14.2.5. F. Hoffmann-La Roche Ltd.
14.2.5.1 Company Overview
14.2.5.2 Product Portfolio
14.2.5.3 SWOT Analysis
14.2.5.4 Strategic Overview
14.2.6. Teva Pharmaceutical Industries Ltd.
14.2.6.1 Company Overview
14.2.6.2 Product Portfolio
14.2.6.3 SWOT Analysis
14.2.6.4 Strategic Overview
14.2.7. Pfizer, Inc.
14.2.7.1 Company Overview
14.2.7.2 Product Portfolio
14.2.7.3 SWOT Analysis
14.2.7.4 Strategic Overview
14.2.8. Eli Lilly and Company
14.2.8.1 Company Overview
14.2.8.2 Product Portfolio
14.2.8.3 SWOT Analysis
14.2.8.4 Strategic Overview
14.2.9. Bristol-Myers Squibb Company
14.2.9.1 Company Overview
14.2.9.2 Product Portfolio
14.2.9.3 SWOT Analysis
14.2.9.4 Strategic Overview
14.2.10. AbbVie, Inc.
14.2.10.1 Company Overview
14.2.10.2 Product Portfolio
14.2.10.3 SWOT Analysis
14.2.10.4 Strategic Overview
14.2.11. Bayer AG
14.2.11.1 Company Overview
14.2.11.2 Product Portfolio
14.2.11.3 SWOT Analysis
14.2.11.4 Strategic Overview
List of Tables
Table 01 : Top Ten Countries With Highest Sexually Transmitted Disease Prevalence Globally
Table 02: Top Ten Developed Countries With the Highest STD Rates (Chlamydia, Gonorrhea and Syphilis)
Table 03: Global and regional estimates of the number of prevalent cases (‘000) in 2012 by infection and sex
Table 04: Percentage of population (%) with prevalent infection in 2012 by infection and sex (95% uncertainty interval shown in parentheses)
Table 05: Global and regional estimates of the number of incident cases (‘000) in 2012 by infection and sex
Table 06: Incidence rates (per 1,000) by infection and sex, based on 2005 to 2012 data (95% uncertainty interval shown in parentheses)
Table 07: HIV-AIDS Prevalence by Region Wise
Table 08: Top Ten Countries People Living With HIV-AIDS in 2016
Table 09: Sexually Transmitted Diseases — Reported Cases and Rates of Reported Cases per 100,000 Population, United States, 2010–2015
Table 10: Upcoming STDs Conferences with Date and Locations
Table 11: Global STDs Drug Market Size (US$ Mn) Forecast, by Disease Type, 2015–2025
Table 12: Global STDs Drug Market Size (US$ Mn) Forecast, by Therapy Class, 2015–2025
Table 13: Global STDs Drug Market Size (US$ Mn) Forecast, by Distribution Channel, 2015–2025
Table 14: Global STDs Drug Market Size (US$ Mn) Forecast, by Region, 2015–2025
Table 15: North America STDs Drug Market Size (US$ Mn) Forecast, by Disease Type, 2015–2025
Table 16: North America STDs Drug Market Size (US$ Mn) Forecast, by Therapy Class, 2015–2025
Table 17: North America STDs Drug Market Size (US$ Mn) Forecast, by Distribution Channel, 2015–2025
Table 18: North America STDs Drug Market Size (US$ Mn) Forecast, by Region, 2015–2025
Table 19: Europe STDs Drug Market Size (US$ Mn) Forecast, by Disease Type, 2015–2025
Table 20: Europe STDs Drug Market Size (US$ Mn) Forecast, by Therapy Class, 2015–2025
Table 22: Europe STDs Drug Market Size (US$ Mn) Forecast, by Distribution Channel, 2015–2025
Table 24: Europe STDs Drug Market Size (US$ Mn) Forecast, by Region, 2015–2025
Table 25: Asia Pacific STDs Drug Market Size (US$ Mn) Forecast, by Disease Type, 2015–2025
Table 26: Asia Pacific STDs Drug Market Size (US$ Mn) Forecast, by Therapy Class, 2015–2025
Table 27: Asia Pacific STDs Drug Market Size (US$ Mn) Forecast, by Distribution Channel, 2015–2025
Table 28: Asia Pacific STDs Drug Market Size (US$ Mn) Forecast, by Region, 2015–2025
Table 29: Latin America STDs Drug Market Size (US$ Mn) Forecast, by Disease Type, 2015–2025
Table 30: Latin America STDs Drug Market Size (US$ Mn) Forecast, by Therapy Class, 2015–2025
Table 31: Latin America STDs Drug Market Size (US$ Mn) Forecast, by Distribution Channel, 2015–2025
Table 32: Latin America STDs Drug Market Size (US$ Mn) Forecast, by Region, 2015–2025
Table 33: Middle East & Africa STDs Drug Market Size (US$ Mn) Forecast, by Disease Type, 2015–2025
Table 34: Middle East & Africa STDs Drug Market Size (US$ Mn) Forecast, by Therapy Class, 2015–2025
Table 35: Middle East & Africa STDs Drug Market Size (US$ Mn) Forecast, by Distribution Channel, 2015–2025
Table 36: Middle East & Africa STDs Drug Market Size (US$ Mn) Forecast, by Region, 2015–2025
List of Figures
Figure 01: Global STDs Drug Market Revenue (US$ Mn) Forecast and Y-o-Y Growth (%), 2017–2025
Figure 02 : Market Value Share, by Disease Type (2016)
Figure 03: Market Value Share, by Therapy Class (2016)
Figure 04: Market Value Share, by Distribution Channel (2016)
Figure 05: Market Value Share, by Region (2016)
Figure 06: Global STDs Drug Market Value Share Analysis, by Disease Type, 2016 and 2025
Figure 07: Global STDs Chlamydia Market Revenue (US$ Mn) and Y-o-Y Growth (%), 2015–2025
Figure 08: Global STDs Gonorrhea Market Revenue (US$ Mn) and Y-o-Y Growth (%), 2015–2025
Figure 09: Global STDs Syphilis Market Revenue (US$ Mn) and Y-o-Y Growth (%), 2015–2025
Figure 10: Global STDs Genital herpes Market Revenue (US$ Mn) and Y-o-Y Growth (%), 2015–2025
Figure 11: Global STDs HPV Market Revenue (US$ Mn) and Y-o-Y Growth (%), 2015–2025
Figure 12: Global STDs HIV/AIDS Market Revenue (US$ Mn) and Y-o-Y Growth (%), 2015–2025
Figure 13: Global STDs Others Market Revenue (US$ Mn) and Y-o-Y Growth (%), 2015–2025
Figure 14: Global STDs Drug Market Attractiveness Analysis, by Disease Type
Figure 15: Global STDs Drug Market Value Share Analysis, by Therapy Class, 2016 and 2025
Figure 16: Global STDs Antibiotics Market Revenue (US$ Mn) and Y-o-Y Growth (%), 2015–2025
Figure 17: Global STDs Antiviral/Antiretrovirals Market Revenue (US$ Mn) and Y-o-Y Growth (%), 2015–2025
Figure 18: Global STDs Vaccines Market Revenue (US$ Mn) and Y-o-Y Growth (%), 2015–2025
Figure 19: Global STDs Others Market Revenue (US$ Mn) and Y-o-Y Growth (%), 2015–2025
Figure 20: Global STDs Drug Market Attractiveness Analysis, by Therapy Class
Figure 21: Global STDs Drug Market Value Share Analysis, by Distribution Channel, 2016 and 2025
Figure 22: Global Hospitals STDs Drug Market Revenue (US$ Mn) and Y-o-Y Growth (%), 2015–2025
Figure 23: Global Retail Pharmacies STDs Drug Market Revenue (US$ Mn) and Y-o-Y Growth (%), 2015–2025
Figure 24: Global Online Pharmacies STDs Drug Market Revenue (US$ Mn) and Y-o-Y Growth (%), 2015–2025
Figure 25: Global Others STDs Drug Market Revenue (US$ Mn) and Y-o-Y Growth (%), 2015–2025
Figure 26: Global STDs Drug Market Attractiveness Analysis, by Distribution Channel
Figure 27: Global STDs Drug Market Value Share Analysis, by Region, 2016 and 2025
Figure 28: Global STDs Drug Market Attractiveness Analysis, by Region
Figure 29: North America STDs Drug Market Value Share Analysis, by Disease Type, 2016 and 2025
Figure 30: North America STDs Chlamydia Market Revenue (US$ Mn) and Y-o-Y Growth (%), 2015–2025
Figure 31: North America STDs Gonorrhea Market Revenue (US$ Mn) and Y-o-Y Growth (%), 2015–2025
Figure 32: North America STDs Syphilis Market Revenue (US$ Mn) and Y-o-Y Growth (%), 2015–2025
Figure 33: North America STDs Genital herpes Market Revenue (US$ Mn) and Y-o-Y Growth (%), 2015–2025
Figure 34: North America STDs HPV Market Revenue (US$ Mn) and Y-o-Y Growth (%), 2015–2025
Figure 35: North America STDs HIV/AIDS Market Revenue (US$ Mn) and Y-o-Y Growth (%), 2015–2025
Figure 36: North America STDs Others Market Revenue (US$ Mn) and Y-o-Y Growth (%), 2015–2025
Figure 37: North America STDs Drug Market Attractiveness Analysis, by Disease Type
Figure 38: North America STDs Drug Market Value Share Analysis, by Therapy Class, 2016 and 2025
Figure 39: North America STDs Antibiotics Market Revenue (US$ Mn) and Y-o-Y Growth (%), 2015–2025
Figure 40: North America STDs Antiviral/Antiretrovirals Market Revenue (US$ Mn) and Y-o-Y Growth (%), 2015–2025
Figure 41: North America STDs Vaccines Market Revenue (US$ Mn) and Y-o-Y Growth (%), 2015–2025
Figure 42: North America STDs Others Market Revenue (US$ Mn) and Y-o-Y Growth (%), 2015–2025
Figure 43: North America STDs Drug Market Attractiveness Analysis, by Therapy Class
Figure 44: North America STDs Drug Market Value Share Analysis, by Distribution Channel, 2016 and 2025
Figure 45: North America Hospitals STDs Drug Market Revenue (US$ Mn) and Y-o-Y Growth (%), 2015–2025
Figure 46: North America Retail Pharmacies STDs Drug Market Revenue (US$ Mn) and Y-o-Y Growth (%), 2015–2025
Figure 47: North America Online Pharmacies STDs Drug Market Revenue (US$ Mn) and Y-o-Y Growth (%), 2015–2025
Figure 48: North America Others STDs Drug Market Revenue (US$ Mn) and Y-o-Y Growth (%), 2015–2025
Figure 49: North America STDs Drug Market Attractiveness Analysis, by Distribution Channel
Figure 50: North America STDs Drug Market Value Share Analysis, by Region, 2016 and 2025
Figure 51: North America STDs Drug Market Attractiveness Analysis, by Region
Figure 52: Europe STDs Drug Market Value Share Analysis, by Disease Type, 2016 and 2025
Figure 53: Europe STDs Chlamydia Market Revenue (US$ Mn) and Y-o-Y Growth (%), 2015–2025
Figure 54: Europe STDs Gonorrhea Market Revenue (US$ Mn) and Y-o-Y Growth (%), 2015–2025
Figure 55: Europe STDs Syphilis Market Revenue (US$ Mn) and Y-o-Y Growth (%), 2015–2025
Figure 56: Europe STDs Genital herpes Market Revenue (US$ Mn) and Y-o-Y Growth (%), 2015–2025
Figure 57: Europe STDs HPV Market Revenue (US$ Mn) and Y-o-Y Growth (%), 2015–2025
Figure 58: Europe STDs HIV/AIDS Market Revenue (US$ Mn) and Y-o-Y Growth (%), 2015–2025
Figure 59: Europe STDs Others Market Revenue (US$ Mn) and Y-o-Y Growth (%), 2015–2025
Figure 60: Europe STDs Drug Market Attractiveness Analysis, by Disease Type
Figure 61: Europe STDs Drug Market Value Share Analysis, by Therapy Class, 2016 and 2025
Figure 62: Europe STDs Antibiotics Market Revenue (US$ Mn) and Y-o-Y Growth (%), 2015–2025
Figure 63: Europe STDs Antiviral/Antiretrovirals Market Revenue (US$ Mn) and Y-o-Y Growth (%), 2015–2025
Figure 64: Europe STDs Vaccines Market Revenue (US$ Mn) and Y-o-Y Growth (%), 2015–2025
Figure 65: Europe STDs Others Market Revenue (US$ Mn) and Y-o-Y Growth (%), 2015–2025
Figure 66: Europe STDs Drug Market Attractiveness Analysis, by Therapy Class
Figure 67: Europe STDs Drug Market Value Share Analysis, by Distribution Channel, 2016 and 2025
Figure 68: Europe Hospitals STDs Drug Market Revenue (US$ Mn) and Y-o-Y Growth (%), 2015–2025
Figure 69: Europe Retail Pharmacies STDs Drug Market Revenue (US$ Mn) and Y-o-Y Growth (%), 2015–2025
Figure 70: Europe Online Pharmacies STDs Drug Market Revenue (US$ Mn) and Y-o-Y Growth (%), 2015–2025
Figure 71: Europe Others STDs Drug Market Revenue (US$ Mn) and Y-o-Y Growth (%), 2015–2025
Figure 72: Europe STDs Drug Market Attractiveness Analysis, by Distribution Channel
Figure 73: Europe STDs Drug Market Value Share Analysis, by Region, 2016 and 2025
Figure 74: Europe STDs Drug Market Attractiveness Analysis, by Region
Figure 75: Asia Pacific STDs Drug Market Value Share Analysis, by Disease Type, 2016 and 2025
Figure 76: Asia Pacific STDs Chlamydia Market Revenue (US$ Mn) and Y-o-Y Growth (%), 2015–2025
Figure 77: Asia Pacific STDs Gonorrhea Market Revenue (US$ Mn) and Y-o-Y Growth (%), 2015–2025
Figure 78: Asia Pacific STDs Syphilis Market Revenue (US$ Mn) and Y-o-Y Growth (%), 2015–2025
Figure 79: Asia Pacific STDs Genital herpes Market Revenue (US$ Mn) and Y-o-Y Growth (%), 2015–2025
Figure 80: Asia Pacific STDs HPV Market Revenue (US$ Mn) and Y-o-Y Growth (%), 2015–2025
Figure 81: Asia Pacific STDs HIV/AIDS Market Revenue (US$ Mn) and Y-o-Y Growth (%), 2015–2025
Figure 82: Asia Pacific STDs Others Market Revenue (US$ Mn) and Y-o-Y Growth (%), 2015–2025
Figure 83: Asia Pacific STDs Drug Market Attractiveness Analysis, by Disease Type
Figure 84: Asia Pacific STDs Drug Market Value Share Analysis, by Therapy Class, 2016 and 2025
Figure 85: Asia Pacific STDs Antibiotics Market Revenue (US$ Mn) and Y-o-Y Growth (%), 2015–2025
Figure 86: Asia Pacific STDs Antiviral/Antiretrovirals Market Revenue (US$ Mn) and Y-o-Y Growth (%), 2015–2025
Figure 87: Asia Pacific STDs Vaccines Market Revenue (US$ Mn) and Y-o-Y Growth (%), 2015–2025
Figure 88: Asia Pacific STDs Others Market Revenue (US$ Mn) and Y-o-Y Growth (%), 2015–2025
Figure 89: Asia Pacific STDs Drug Market Attractiveness Analysis, by Therapy Class
Figure 90: Asia Pacific STDs Drug Market Value Share Analysis, by Distribution Channel, 2016 and 2025
Figure 91: Asia Pacific Hospitals STDs Drug Market Revenue (US$ Mn) and Y-o-Y Growth (%), 2015–2025
Figure 92: Asia Pacific Retail Pharmacies STDs Drug Market Revenue (US$ Mn) and Y-o-Y Growth (%), 2015–2025
Figure 93: Asia Pacific Online Pharmacies STDs Drug Market Revenue (US$ Mn) and Y-o-Y Growth (%), 2015–2025
Figure 94: Asia Pacific Others STDs Drug Market Revenue (US$ Mn) and Y-o-Y Growth (%), 2015–2025
Figure 95: Asia Pacific STDs Drug Market Attractiveness Analysis, by Distribution Channel
Figure 96: Asia Pacific STDs Drug Market Value Share Analysis, by Region, 2016 and 2025
Figure 97: Asia Pacific STDs Drug Market Attractiveness Analysis, by Region
Figure 98: Latin America STDs Drug Market Value Share Analysis, by Disease Type, 2016 and 2025
Figure 99: Latin America STDs Chlamydia Market Revenue (US$ Mn) and Y-o-Y Growth (%), 2015–2025
Figure 100: Latin America STDs Gonorrhea Market Revenue (US$ Mn) and Y-o-Y Growth (%), 2015–2025
Figure 101: Latin America STDs Syphilis Market Revenue (US$ Mn) and Y-o-Y Growth (%), 2015–2025
Figure 102: Latin America STDs Genital herpes Market Revenue (US$ Mn) and Y-o-Y Growth (%), 2015–2025
Figure 103: Latin America STDs HPV Market Revenue (US$ Mn) and Y-o-Y Growth (%), 2015–2025
Figure 104: Latin America STDs HIV/AIDS Market Revenue (US$ Mn) and Y-o-Y Growth (%), 2015–2025
Figure 105: Latin America STDs Others Market Revenue (US$ Mn) and Y-o-Y Growth (%), 2015–2025
Figure 106: Latin America STDs Drug Market Attractiveness Analysis, by Disease Type
Figure 107: Latin America STDs Drug Market Value Share Analysis, by Therapy Class, 2016 and 2025
Figure 108: Latin America STDs Antibiotics Market Revenue (US$ Mn) and Y-o-Y Growth (%), 2015–2025
Figure 109: Latin America STDs Antiviral/Antiretrovirals Market Revenue (US$ Mn) and Y-o-Y Growth (%), 2015–2025
Figure 110: Latin America STDs Vaccines Market Revenue (US$ Mn) and Y-o-Y Growth (%), 2015–2025
Figure 111: Latin America STDs Others Market Revenue (US$ Mn) and Y-o-Y Growth (%), 2015–2025
Figure 112: Latin America STDs Drug Market Attractiveness Analysis, by Therapy Class
Figure 113: Latin America STDs Drug Market Value Share Analysis, by Distribution Channel, 2016 and 2025
Figure 114: Latin America Hospitals STDs Drug Market Revenue (US$ Mn) and Y-o-Y Growth (%), 2015–2025
Figure 115: Latin America Retail Pharmacies STDs Drug Market Revenue (US$ Mn) and Y-o-Y Growth (%), 2015–2025
Figure 116: Latin America Online Pharmacies STDs Drug Market Revenue (US$ Mn) and Y-o-Y Growth (%), 2015–2025
Figure 117: Latin America Others STDs Drug Market Revenue (US$ Mn) and Y-o-Y Growth (%), 2015–2025
Figure 118: Latin America STDs Drug Market Attractiveness Analysis, by Distribution Channel
Figure 119: Latin America STDs Drug Market Value Share Analysis, by Region, 2016 and 2025
Figure 120: Latin America STDs Drug Market Attractiveness Analysis, by Region
Figure 121: Middle East & Africa STDs Drug Market Value Share Analysis, by Disease Type, 2016 and 2025
Figure 122: Middle East & Africa STDs Chlamydia Market Revenue (US$ Mn) and Y-o-Y Growth (%), 2015–2025
Figure 123: Middle East & Africa STDs Gonorrhea Market Revenue (US$ Mn) and Y-o-Y Growth (%), 2015–2025
Figure 124: Middle East & Africa STDs Syphilis Market Revenue (US$ Mn) and Y-o-Y Growth (%), 2015–2025
Figure 125: Middle East & Africa STDs Genital herpes Market Revenue (US$ Mn) and Y-o-Y Growth (%), 2015–2025
Figure 126: Middle East & Africa STDs HPV Market Revenue (US$ Mn) and Y-o-Y Growth (%), 2015–2025
Figure 127: Middle East & Africa STDs HIV/AIDS Market Revenue (US$ Mn) and Y-o-Y Growth (%), 2015–2025
Figure 128: Middle East & Africa STDs Others Market Revenue (US$ Mn) and Y-o-Y Growth (%), 2015–2025
Figure 129: Middle East & Africa STDs Drug Market Attractiveness Analysis, by Disease Type
Figure 130: Middle East & Africa STDs Drug Market Value Share Analysis, by Therapy Class, 2016 and 2025
Figure 131: Middle East & Africa STDs Antibiotics Market Revenue (US$ Mn) and Y-o-Y Growth (%), 2015–2025
Figure 132: Middle East & Africa STDs Antiviral/Antiretrovirals Market Revenue (US$ Mn) and Y-o-Y Growth (%), 2015–2025
Figure 133: Middle East & Africa STDs Vaccines Market Revenue (US$ Mn) and Y-o-Y Growth (%), 2015–2025
Figure 134: Middle East & Africa STDs Others Market Revenue (US$ Mn) and Y-o-Y Growth (%), 2015–2025
Figure 135: Middle East & Africa STDs Drug Market Attractiveness Analysis, by Therapy Class
Figure 136: Middle East & Africa STDs Drug Market Value Share Analysis, by Distribution Channel, 2016 and 2025
Figure 137: Middle East & Africa Hospitals STDs Drug Market Revenue (US$ Mn) and Y-o-Y Growth (%), 2015–2025
Figure 138: Middle East & Africa Retail Pharmacies STDs Drug Market Revenue (US$ Mn) and Y-o-Y Growth (%), 2015–2025
Figure 139: Middle East & Africa Online Pharmacies STDs Drug Market Revenue (US$ Mn) and Y-o-Y Growth (%), 2015–2025
Figure 140: Middle East & Africa Others STDs Drug Market Revenue (US$ Mn) and Y-o-Y Growth (%), 2015–2025
Figure 141: Middle East & Africa STDs Drug Market Attractiveness Analysis, by Distribution Channel
Figure 142: Middle East & Africa STDs Drug Market Value Share Analysis, by Region, 2016 and 2025
Figure 143: Middle East & Africa STDs Drug Market Attractiveness Analysis, by Region
Figure 144: Global STDs Market Share Analysis By Company (2016)
Copyright © Transparency Market Research, Inc. All Rights reserved
Trust Online

Sexually Transmitted Diseases (STDs) Drug Market
