Analysts’ Viewpoint on Refurbished Electronics Market Scenario
Leading electronics equipment manufacturers and e-commerce platforms, such as Dell, Samsung, Apple, and Amazon, are focusing on refurbishing and recycling electronic devices to reduce e-waste. The global refurbished electronics market is driven by the affordability of refurbished devices. Surge in demand for refurbished computers and laptops from both individuals and ITES industry is accelerating the demand for refurbished electronics. The secondary market allows buyers to acquire refurbished consumer electronics at average selling price (ASP), i.e., 40% to 60% lower than new versions. This has a significant impact on the growth of the market. Expansion of the refurbished market presents ample growth opportunity for companies; however, it can quickly become a barrier and challenge to companies that are unprepared without a strategy in place. Aligning with best practices for rebuilt electronics is likely to improve the results of companies and ensure a positive customer experience in secondary markets. Product manufacturers and retailers are striving to offer better user experiences for best refurbished electronics, thus reinforcing their brand strength and enhancing consumer trust.
Refurbished electronics refer to the distribution of previously used electronic products that are returned to the manufacturer or refurbisher in exchange for a new product. The used electronic products are generally tested for defects and functionality before bringing them into the system again.
Refurbished electronics are used in residential and commercial sectors for personal use or official use, respectively. OEMs as well as refurbished electronics distributors offer refurbished products for personal and commercial use.
Rise in e-waste offers a huge opportunity to refurbishers. E-waste that would otherwise be dumped in landfills is now being refurbished to make the most of its lifecycle.
Consumers want to contribute to the greater cause of sustainability and seek cost-effective and affordable solutions for laptops, computers, and smartphones. Refurbished electronics fit in well in this scenario.
The best refurbished electronics come with warranties that not only safeguard users from dubious product quality, but also provide a sense of comfort in owning a refurbished product.
Pre-owned and refurbished goods, such as computers, laptops, and smartphones are gaining growing traction. The desire to own high-quality superior brands at reasonable price is also propelling the demand for refurbished products. The urban population in developing regions wishes to own high-quality aspirational products at affordable prices. This population is a key consumer set driving demand for refurbished products.
Individual computer users and companies exhibited least acceptance for refurbished tablets and laptops until 2015-2016, attributed to lack of awareness and information about the best refurbished electronics. However, in recent years, an increasing urban population is inclining toward rebuilt electronics owing to their quality and affordable price.
Growing environmental concerns due to huge e-waste generation is also a prime factor encouraging consumers to select refurbished tablets and laptops. This trend is promoted by the growing number of companies that provide warranties on refurbished electronics, which safeguards users against low quality or faulty products.
Increased usage of computer and laptops in schools, colleges, and universities creates substantial opportunity for the refurbished electronics market in the U.S. Resource sharing programs allow students to take home refurbished computers and laptops from the institution for a limited time period. For instance, public schools in the city of Spokane in Washington, U.S., have collaborated with the Spokane Public Library, which offers refurbished computers and laptops to students for educational purposes.
In August 2022, Cashify, a re-commerce company based in India, stated in the Cashify White Paper 2022 report that for 70% of customers, affordability is the primary factor to purchase refurbished cell phones in India. Average selling price (ASP) of refurbished and used mobile phones in India was INR 6,913 (US$ 84.76), while ASP of new mobile phones was INR 13,943 (US$ 170.96) in 2021. Thus, affordability has an impact on refurbished electronics market growth.
Sale of refurbished products is surging rapidly owing to increase in consumer awareness that refurbished smart watches, cell phones, laptops, refrigerators, air conditioners, TVs, and refurbished printers are more cost effective than new products.
Leading players in the market, such as Amazon, eBay, and Fnac, have introduced Amazon Renewed, eBay Refurbished, and Fnac Refurbished Products, bringing numerous growth opportunities to the market.
According to an article published on modernretail.co, in July 2021, Amazon Renewed is the third-most popular electronics brand on Amazon’s platform. Back Market, a French marketplace for refurbished electronics also reported that year-on-year sales surged 10 times between 2019 and 2020.
OEMs and marketplaces are encouraging consumers to trade in their old devices by providing lucrative offers on their new products. Consequently, consumers are increasingly trading their older devices to avail the offers and buy new generation devices on discounted price offered by the OEMs and online platforms.
New companies are also being established. These companies are involved in cleaning, repairing, testing, inspecting, grading, repackaging, and reselling refurbished electronics, thus strengthening the supply side, which is a critical area for refurbished electronics.
Growth in number of refurbished electronics distributors, manufacturers, and marketplaces for refurbished consumer electronics is creating significant opportunities for refurbished electronics distributors in the market.
Asia Pacific is estimated to hold the largest share of the global refurbished electronics market. Asia Pacific has a large number of re-commerce and online marketplaces for refurbished electronics with significant manufacturing capabilities. It is one of the world’s most populous regions, with majority of the population in the middle and lower income brackets. This class of population is more likely to opt for refurbished products owing to affordability, sustainability, and reliability. People in India are increasingly purchasing refurbished and used mobile phones in order to upgrade their premium smartphones and switch from feature phones to smartphones.
South America is the most attractive market for refurbished electronics due to establishment of various government backed refurbished electronics manufacturing facilities. Countries such as Brazil, Chile, and Colombia, are creating significant work opportunities and adopting a circular economy approach with the help of UNIDO-GEF (United Nations Industrial Development Organization-Global Environment Facility) to recover raw materials from e-waste and manufacture affordable refurbished consumer electronics in the region.
Detailed profiles of companies offering refurbished electronics have been provided in the market report to evaluate their financials, key product offerings, recent developments, and strategies. Top refurbished electronics companies are expanding their product portfolio to increase their market share. Leading companies in the refurbished electronics market are Apple Inc., Acer Inc., Back Market, Overcart, Dell, Inc., HP Inc., Amazon.com, Inc., ASUSTeK Computer Inc., Samsung Electronics Co., Ltd., Lenovo Group Ltd., and Reboot Systems India Private Limited, among others.
Each of these players has been profiled in the refurbished electronics market report based on parameters such as company overview, financial overview, business strategies, product portfolio, business segments, and recent developments.
Global Refurbished Electronics Market Snapshot
|
Attribute |
Detail |
|
Market Size Value in 2021 |
US$ 85.42 Bn |
|
Market Forecast Value in 2031 |
US$ 272.91 Bn |
|
Growth Rate (CAGR) |
12.1% |
|
Forecast Period |
2022–2031 |
|
Historical Data Available for |
2016–2020 |
|
Quantitative Units |
US$ Bn for Value |
|
Market Analysis |
Includes cross-segment analysis at global as well as regional level. Furthermore, the qualitative analysis includes drivers, restraints, opportunities, key trends, analysis, value chain analysis, and key trend analysis. |
|
Competition Landscape |
|
|
Format |
Electronic (PDF) + Excel |
|
Market Segmentation |
|
|
Regions Covered |
|
|
Countries Covered |
|
|
Companies Profiled |
|
|
Customization Scope |
Available upon request |
|
Pricing |
Available upon request |
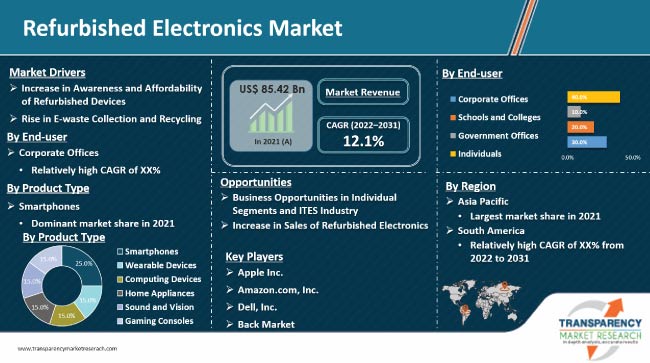
The global refurbished electronics market stood at US$ 85.42 Bn in 2021.
The refurbished electronics market is estimated to grow at a rate of 12.1% during the forecast period.
Increase in awareness and affordability of refurbished devices and increase in e-waste collection and recycling.
Individuals was the largest segment of the refurbished electronics market in 2021.
Asia Pacific is expected to dominate the refurbished electronics market during the forecast period.
Apple Inc., Acer Inc., Back Market, Overcart, Dell, Inc., HP Inc., Amazon.com, Inc., ASUSTeK Computer Inc., Samsung Electronics Co., Ltd., Lenovo Group Ltd., and Reboot Systems India Private Limited.
1. Preface
1.1. Market Introduction
1.2. Market Segmentation
1.3. Key Research Objectives
2. Assumptions and Research Methodology
2.1. Research Methodology
2.1.1. List of Primary and Secondary Sources
2.2. Key Assumptions for Data Modelling
3. Executive Summary: Global Refurbished Electronics Market
4. Market Overview
4.1. Market Definition
4.2. Technology/ Product Roadmap
4.3. Market Factor Analysis
4.3.1. Forecast Factors
4.3.2. Ecosystem/ Value Chain Analysis
4.3.3. Market Dynamics (Growth Influencers)
4.3.3.1. Drivers
4.3.3.2. Restraints
4.3.3.3. Opportunities
4.3.3.4. Impact Analysis of Drivers and Restraints
4.4. COVID-19 Impact Analysis
4.4.1. Impact of COVID-19 on Refurbished Electronics Market
4.4.2. End-user Sentiment Analysis: Comparative Analysis on Spending
4.4.2.1. Increase in Spending
4.4.2.2. Decrease in Spending
4.4.3. Short Term and Long Term Impact on the Market
4.5. Market Opportunity Assessment – by Region (North America/ Europe/ Asia Pacific/ Middle East & Africa/ South America)
4.5.1. By Product Type
4.5.2. By Distribution Channel
4.5.3. By End-user
4.6. Analysis on the Subscription Based Model for Refurbished Electronics
4.7. List of Refurbishers
5. Global Refurbished Electronics Market Analysis and Forecast
5.1. Market Revenue Analysis (US$ Bn), 2016-2031
5.1.1. Historic Growth Trends, 2016-2021
5.1.2. Forecast Trends, 2022-2031
6. Global Refurbished Electronics Market Analysis, by Product Type
6.1. Key Segment Analysis
6.2. Refurbished Electronics Market Size (US$ Bn) Forecast, by Product Type, 2018 - 2031
6.2.1. Smartphones
6.2.2. Wearable Devices
6.2.3. Computing Devices
6.2.4. Home Appliances
6.2.5. Sound and Vision
6.2.6. Gaming Consoles
7. Global Refurbished Electronics Market Analysis, by Distribution Channel
7.1. Key Segment Analysis
7.2. Refurbished Electronics Market Size (US$ Bn) Forecast, by Distribution Channel, 2018 - 2031
7.2.1. Offline Stores
7.2.2. Online Stores
8. Global Refurbished Electronics Market Analysis, by End-user
8.1. Key Segment Analysis
8.2. Refurbished Electronics Market Size (US$ Bn) Forecast, by End-user, 2018 - 2031
8.2.1. Corporate Offices
8.2.2. Schools and Colleges
8.2.3. Government Offices
8.2.4. Individuals
9. Global Refurbished Electronics Market Analysis and Forecasts, by Region
9.1. Key Findings
9.2. Market Size (US$ Bn) Forecast by Region, 2018-2031
9.2.1. North America
9.2.2. Europe
9.2.3. Asia Pacific
9.2.4. Middle East & Africa
9.2.5. South America
10. North America Refurbished Electronics Market Analysis and Forecast
10.1. Regional Outlook
10.2. Refurbished Electronics Market Size (US$ Bn) Analysis and Forecast, 2018 - 2031
10.2.1. By Product Type
10.2.2. By Distribution Channel
10.2.3. By End-user
10.3. Refurbished Electronics Market Size (US$ Bn) Forecast, by Country, 2018 - 2031
10.3.1. U.S.
10.3.2. Canada
10.3.3. Mexico
11. Europe Refurbished Electronics Market Analysis and Forecast
11.1. Regional Outlook
11.2. Refurbished Electronics Market Size (US$ Bn) Analysis and Forecast, 2018 - 2031
11.2.1. By Product Type
11.2.2. By Distribution Channel
11.2.3. By End-user
11.3. Refurbished Electronics Market Size (US$ Bn) Forecast, by Country/Sub-region, 2018 - 2031
11.3.1. Germany
11.3.2. UK
11.3.3. France
11.3.4. Italy
11.3.5. Spain
11.3.6. Rest of Europe
12. Asia Pacific Refurbished Electronics Market Analysis and Forecast
12.1. Regional Outlook
12.2. Refurbished Electronics Market Size (US$ Bn) Analysis and Forecast, 2018 - 2031
12.2.1. By Product Type
12.2.2. By Distribution Channel
12.2.3. By End-user
12.3. Refurbished Electronics Market Size (US$ Bn) Forecast, by Country/Sub-region, 2018 - 2031
12.3.1. China
12.3.2. India
12.3.3. Japan
12.3.4. ASEAN
12.3.5. Rest of Asia Pacific
13. Middle East & Africa Refurbished Electronics Market Analysis and Forecast
13.1. Regional Outlook
13.2. Refurbished Electronics Market Size (US$ Bn) Analysis and Forecast, 2018 - 2031
13.2.1. By Product Type
13.2.2. By Distribution Channel
13.2.3. By End-user
13.3. Refurbished Electronics Market Size (US$ Bn) Forecast, by Country/Sub-region, 2018 - 2031
13.3.1. Saudi Arabia
13.3.2. United Arab Emirates
13.3.3. South Africa
13.3.4. Rest of Middle East & Africa
14. South America Refurbished Electronics Market Analysis and Forecast
14.1. Regional Outlook
14.2. Refurbished Electronics Market Size (US$ Bn) Analysis and Forecast, 2018 - 2031
14.2.1. By Product Type
14.2.2. By Distribution Channel
14.2.3. By End-user
14.3. Refurbished Electronics Market Size (US$ Bn) Forecast, by Country/Sub-region, 2018 - 2031
14.3.1. Brazil
14.3.2. Argentina
14.3.3. Rest of South America
15. Competition Landscape
15.1. Market Competition Matrix, by Leading Players
15.2. Market Revenue Share Analysis (%), by Leading Players (2021)
15.3. Competitive Scenario
15.3.1. List of Emerging, Prominent and Leading Players
15.3.2. Major Mergers & Acquisitions, Expansions, Partnership, Contacts, Deals, etc.
16. Company Profiles
16.1. Apple, Inc.
16.1.1. Business Overview
16.1.2. Company Revenue
16.1.3. Product Portfolio
16.1.4. Geographic Footprint
16.1.5. Strategic Partnership, Merger & Acquisition, Business Expansion, New Product Launch, Innovation etc.
16.2. Acer, Inc.
16.2.1. Business Overview
16.2.2. Company Revenue
16.2.3. Product Portfolio
16.2.4. Geographic Footprint
16.2.5. Strategic Partnership, Merger & Acquisition, Business Expansion, New Product Launch, Innovation etc.
16.3. Back Market
16.3.1. Business Overview
16.3.2. Company Revenue
16.3.3. Product Portfolio
16.3.4. Geographic Footprint
16.3.5. Strategic Partnership, Merger & Acquisition, Business Expansion, New Product Launch, Innovation etc.
16.4. Overcart
16.4.1. Business Overview
16.4.2. Company Revenue
16.4.3. Product Portfolio
16.4.4. Geographic Footprint
16.4.5. Strategic Partnership, Merger & Acquisition, Business Expansion, New Product Launch, Innovation etc.
16.5. Dell, Inc.
16.5.1. Business Overview
16.5.2. Company Revenue
16.5.3. Product Portfolio
16.5.4. Geographic Footprint
16.5.5. Strategic Partnership, Merger & Acquisition, Business Expansion, New Product Launch, Innovation etc.
16.6. HP Inc.
16.6.1. Business Overview
16.6.2. Company Revenue
16.6.3. Product Portfolio
16.6.4. Geographic Footprint
16.6.5. Strategic Partnership, Merger & Acquisition, Business Expansion, New Product Launch, Innovation etc.
16.7. Amazon.com, Inc.
16.7.1. Business Overview
16.7.2. Company Revenue
16.7.3. Product Portfolio
16.7.4. Geographic Footprint
16.7.5. Strategic Partnership, Merger & Acquisition, Business Expansion, New Product Launch, Innovation etc.
16.8. ASUSTeK Computer Inc.
16.8.1. Business Overview
16.8.2. Company Revenue
16.8.3. Product Portfolio
16.8.4. Geographic Footprint
16.8.5. Strategic Partnership, Merger & Acquisition, Business Expansion, New Product Launch, Innovation etc.
16.9. Samsung Electronics Co., Ltd.
16.9.1. Business Overview
16.9.2. Company Revenue
16.9.3. Product Portfolio
16.9.4. Geographic Footprint
16.9.5. Strategic Partnership, Merger & Acquisition, Business Expansion, New Product Launch, Innovation etc.
16.10. Lenovo Group Ltd.
16.10.1. Business Overview
16.10.2. Company Revenue
16.10.3. Product Portfolio
16.10.4. Geographic Footprint
16.10.5. Strategic Partnership, Merger & Acquisition, Business Expansion, New Product Launch, Innovation etc.
16.11. Reboot Systems India Private Limited
16.11.1. Business Overview
16.11.2. Company Revenue
16.11.3. Product Portfolio
16.11.4. Geographic Footprint
16.11.5. Strategic Partnership, Merger & Acquisition, Business Expansion, New Product Launch, Innovation etc.
16.12. Others
16.12.1. Business Overview
16.12.2. Company Revenue
16.12.3. Product Portfolio
16.12.4. Geographic Footprint
16.12.5. Strategic Partnership, Merger & Acquisition, Business Expansion, New Product Launch, Innovation etc.
17. Key Takeaways
List of Tables
Table 1: Acronyms Used in Refurbished Electronics Market
Table 2: North America Refurbished Electronics Market Revenue Analysis, by Country, 2022 - 2031 (US$ Bn)
Table 3: Europe Refurbished Electronics Market Revenue Analysis, by Country/Sub-region, 2022 - 2031 (US$ Bn)
Table 4: Asia Pacific Refurbished Electronics Market Revenue Analysis, by Country/Sub-region, 2022 - 2031 (US$ Bn)
Table 5: Middle East & Africa Refurbished Electronics Market Revenue Analysis, by Country/Sub-region, 2022 and 2031 (US$ Bn)
Table 6: South America Refurbished Electronics Market Revenue Analysis, by Country/Sub-region, 2022 - 2031 (US$ Bn)
Table 7: Forecast Factors: Relevance and Impact
Table 8: Global Refurbished Electronics Market Value (US$ Bn) Forecast, by Product Type, 2018 – 2031
Table 9: Global Refurbished Electronics Market Value (US$ Bn) Forecast, by Distribution Channel, 2018 – 2031
Table 10: Global Refurbished Electronics Market Value (US$ Bn) Forecast, by End-user, 2018 – 2031
Table 11: Global Refurbished Electronics Market Volume (US$ Bn) Forecast, by Region, 2018 – 2031
Table 12: North America Refurbished Electronics Market Value (US$ Bn) Forecast, by Product Type, 2018 – 2031
Table 13: North America Refurbished Electronics Market Value (US$ Bn) Forecast, by Distribution Channel, 2018 – 2031
Table 14: North America Refurbished Electronics Market Value (US$ Bn) Forecast, by End-user, 2018 – 2031
Table 15: North America Refurbished Electronics Market Value (US$ Bn) Forecast, by Country, 2018 - 2031
Table 16: U.S. Refurbished Electronics Market Revenue CAGR Breakdown (%), by Growth Term
Table 17: Canada Refurbished Electronics Market Revenue CAGR Breakdown (%), by Growth Term
Table 18: Mexico Refurbished Electronics Market Revenue CAGR Breakdown (%), by Growth Term
Table 19: Europe Refurbished Electronics Market Value (US$ Bn) Forecast, by Product Type, 2018 – 2031
Table 20: Europe Refurbished Electronics Market Value (US$ Bn) Forecast, by Distribution Channel, 2018 – 2031
Table 21: Europe Refurbished Electronics Market Value (US$ Bn) Forecast, by End-user, 2018 – 2031
Table 22: Europe Refurbished Electronics Market Value (US$ Bn) Forecast, by Country/Sub-region, 2018 - 2031
Table 23: Germany Refurbished Electronics Market Revenue CAGR Breakdown (%), by Growth Term
Table 24: U.K. Refurbished Electronics Market Revenue CAGR Breakdown (%), by Growth Term
Table 25: France Refurbished Electronics Market Revenue CAGR Breakdown (%), by Growth Term
Table 26: Spain Refurbished Electronics Market Revenue CAGR Breakdown (%), by Growth Term
Table 27: Italy Refurbished Electronics Market Revenue CAGR Breakdown (%), by Growth Term
Table 28: Asia Pacific Refurbished Electronics Market Value (US$ Bn) Forecast, by Product Type, 2018 – 2031
Table 29: Asia Pacific Refurbished Electronics Market Value (US$ Bn) Forecast, by Distribution Channel, 2018 – 2031
Table 30: Asia Pacific Refurbished Electronics Market Value (US$ Bn) Forecast, by End-user, 2018 – 2031
Table 31: Asia Pacific Refurbished Electronics Market Value (US$ Bn) Forecast, by Country/Sub-region, 2018 - 2031
Table 32: China Refurbished Electronics Market Revenue CAGR Breakdown (%), by Growth Term
Table 33: India Refurbished Electronics Market Revenue CAGR Breakdown (%), by Growth Term
Table 34: Japan Refurbished Electronics Market Revenue CAGR Breakdown (%), by Growth Term
Table 35: ASEAN Refurbished Electronics Market Revenue CAGR Breakdown (%), by Growth Term
Table 36: Middle East & Africa Refurbished Electronics Market Value (US$ Bn) Forecast, by Product Type, 2018 – 2031
Table 37: Middle East & Africa Refurbished Electronics Market Value (US$ Bn) Forecast, by Distribution Channel, 2018 – 2031
Table 38: Middle East & Africa Refurbished Electronics Market Value (US$ Bn) Forecast, by End-user, 2018 – 2031
Table 39: Middle East & Africa Refurbished Electronics Market Value (US$ Bn) Forecast, by Country/Sub-region, 2018 - 2031
Table 40: Saudi Arabia Refurbished Electronics Market Revenue CAGR Breakdown (%), by Growth Term
Table 41: United Arab Emirates Refurbished Electronics Market Revenue CAGR Breakdown (%), by Growth Term
Table 42: South Africa Refurbished Electronics Market Revenue CAGR Breakdown (%), by Growth Term
Table 43: South America Refurbished Electronics Market Value (US$ Bn) Forecast, by Product Type, 2018 – 2031
Table 44: South America Refurbished Electronics Market Value (US$ Bn) Forecast, by Distribution Channel, 2018 – 2031
Table 45: South America Refurbished Electronics Market Value (US$ Bn) Forecast, by End-user, 2018 – 2031
Table 46: South America Refurbished Electronics Market Value (US$ Bn) Forecast, by Country/Sub-region, 2018 - 2031
Table 47: Brazil Emirates Refurbished Electronics Market Revenue CAGR Breakdown (%), by Growth Term
Table 48: Argentina Refurbished Electronics Market Revenue CAGR Breakdown (%), by Growth Term
Table 49: Mergers & Acquisitions, Expansions, Product Launch, etc. (1/2)
Table 50: Mergers & Acquisitions, Expansions, Product Launch, etc. (2/2)
List of Figures
Figure 1: Global Refurbished Electronics Market Size (US$ Bn) Forecast, 2018–2031
Figure 2: Global Refurbished Electronics Market Revenue (US$ Bn) Opportunity Assessment, by Region, 2022E
Figure 3: Top Segment Analysis of Refurbished Electronics Market
Figure 4: Global Refurbished Electronics Market Revenue (US$ Bn) Opportunity Assessment, by Region, 2031F
Figure 5: Global Refurbished Electronics Market Attractiveness Assessment, by Product Type
Figure 6: Global Refurbished Electronics Market Attractiveness Assessment, by Distribution Channel
Figure 7: Global Refurbished Electronics Market Attractiveness Assessment, by End-user
Figure 8: Global Refurbished Electronics Market Attractiveness Assessment, by Region
Figure 9: Global Refurbished Electronics Market Revenue (US$ Bn) Historic Trends, 2016 - 2021
Figure 10: Global Refurbished Electronics Market Revenue Opportunity (US$ Bn) Historic Trends, 2016 - 2021
Figure 11: Absolute Dollar Opportunity
Figure 12: Global Refurbished Electronics Market Value Share Analysis, by Product Type, 2022
Figure 13: Global Refurbished Electronics Market Value Share Analysis, by Product Type, 2031
Figure 14: Global Refurbished Electronics Market Absolute Opportunity (US$ Bn), by Smartphones, 2022 – 2031
Figure 15: Global Refurbished Electronics Market Absolute Opportunity (US$ Bn), by Wearable Devices, 2022 – 2031
Figure 16: Global Refurbished Electronics Market Absolute Opportunity (US$ Bn), by Computing Devices, 2022 – 2031
Figure 17: Global Refurbished Electronics Market Absolute Opportunity (US$ Bn), by Home Appliances, 2022 – 2031
Figure 18: Global Refurbished Electronics Market Absolute Opportunity (US$ Bn), by Sound and Vision, 2022 – 2031
Figure 19: Global Refurbished Electronics Market Absolute Opportunity (US$ Bn), by Gaming Consoles, 2022 – 2031
Figure 20: Global Refurbished Electronics Market Value Share Analysis, by Distribution Channel, 2022
Figure 21: Global Refurbished Electronics Market Value Share Analysis, by Distribution Channel, 2031
Figure 22: Global Refurbished Electronics Market Absolute Opportunity (US$ Bn), by Offline, 2022 – 2031
Figure 23: Global Refurbished Electronics Market Absolute Opportunity (US$ Bn), by Online, 2022 – 2031
Figure 24: Global Refurbished Electronics Market Value Share Analysis, by End-user, 2022
Figure 25: Global Refurbished Electronics Market Value Share Analysis, by End-user, 2031
Figure 26: Global Refurbished Electronics Market Absolute Opportunity (US$ Bn), by Corporate Offices, 2022 – 2031
Figure 27: Global Refurbished Electronics Market Absolute Opportunity (US$ Bn), by Schools and Colleges, 2022 – 2031
Figure 28: Global Refurbished Electronics Market Absolute Opportunity (US$ Bn), by Government Offices, 2022 – 2031
Figure 29: Global Refurbished Electronics Market Absolute Opportunity (US$ Bn), by Individuals, 2022 – 2031
Figure 30: Global Refurbished Electronics Market Opportunity (US$ Bn), by Region
Figure 31: Global Refurbished Electronics Market Opportunity Share (%), by Region, 2022–2031
Figure 32: Global Refurbished Electronics Market Size (US$ Bn), by Region, 2022 & 2031
Figure 33: Global Refurbished Electronics Market Value Share Analysis, by Region, 2022
Figure 34: Global Refurbished Electronics Market Value Share Analysis, by Region, 2031
Figure 35: North America Refurbished Electronics Market Absolute Opportunity (US$ Bn), 2022 – 2031
Figure 36: Europe Refurbished Electronics Market Absolute Opportunity (US$ Bn), 2022 – 2031
Figure 37: Asia Pacific Refurbished Electronics Market Absolute Opportunity (US$ Bn), 2022 – 2031
Figure 38: Middle East & Africa Refurbished Electronics Market Absolute Opportunity (US$ Bn), 2022 – 2031
Figure 39: South America Refurbished Electronics Market Absolute Opportunity (US$ Bn), 2022 – 2031
Figure 40: North America Absolute Dollar Opportunity
Figure 41: North America Refurbished Electronics Market Revenue Opportunity Share, by Product Type
Figure 42: North America Refurbished Electronics Market Revenue Opportunity Share, by Distribution Channel
Figure 43: North America Refurbished Electronics Market Revenue Opportunity Share, by End-user
Figure 44: North America Refurbished Electronics Market Revenue Opportunity Share, by Country
Figure 45: North America Refurbished Electronics Market Value Share Analysis, by Product Type, 2022
Figure 46: North America Refurbished Electronics Market Value Share Analysis, by Product Type, 2031
Figure 47: North America Refurbished Electronics Market Absolute Opportunity (US$ Bn), by Smartphones, 2022 – 2031
Figure 48: North America Refurbished Electronics Market Absolute Opportunity (US$ Bn), by Wearable Devices, 2022 – 2031
Figure 49: North America Refurbished Electronics Market Absolute Opportunity (US$ Bn), by Computing Devices, 2022 – 2031
Figure 50: Global Refurbished Electronics Market Absolute Opportunity (US$ Bn), by Home Appliances, 2022 – 2031
Figure 51: North America Refurbished Electronics Market Absolute Opportunity (US$ Bn), by Sound and Vision, 2022 – 2031
Figure 52: North America Refurbished Electronics Market Absolute Opportunity (US$ Bn), by Gaming Consoles, 2022 – 2031
Figure 53: North America Refurbished Electronics Market Value Share Analysis, by Distribution Channel, 2022
Figure 54: North America Refurbished Electronics Market Value Share Analysis, by Distribution Channel, 2031
Figure 55: North America Refurbished Electronics Market Absolute Opportunity (US$ Bn), by Offline, 2022 – 2031
Figure 56: North America Refurbished Electronics Market Absolute Opportunity (US$ Bn), by Online, 2022 – 2031
Figure 57: North America Refurbished Electronics Market Value Share Analysis, by End-user, 2022
Figure 58: North America Refurbished Electronics Market Value Share Analysis, by End-user, 2031
Figure 59: North America Refurbished Electronics Market Absolute Opportunity (US$ Bn), by Corporate Offices, 2022 – 2031
Figure 60: North America Refurbished Electronics Market Absolute Opportunity (US$ Bn), by Schools and Colleges, 2022 – 2031
Figure 61: North America Refurbished Electronics Market Absolute Opportunity (US$ Bn), by Government Offices, 2022 – 2031
Figure 62: North America Refurbished Electronics Market Absolute Opportunity (US$ Bn), by Individuals, 2022 – 2031
Figure 63: North America Refurbished Electronics Market Value Share Analysis, by Country, 2022
Figure 64: North America Refurbished Electronics Market Value Share Analysis, by Country, 2031
Figure 65: U.S. Refurbished Electronics Market Opportunity Growth Analysis (US$ Bn) Forecast, 2022 – 2031
Figure 66: Canada Refurbished Electronics Market Opportunity Growth Analysis (US$ Bn) Forecast, 2022 – 2031
Figure 67: Mexico Refurbished Electronics Market Opportunity Growth Analysis (US$ Bn) Forecast, 2022 – 2031
Figure 68: Europe Absolute Dollar Opportunity
Figure 69: Europe Refurbished Electronics Market Revenue Opportunity Share, by Product Type
Figure 70: Europe Refurbished Electronics Market Revenue Opportunity Share, by Distribution Channel
Figure 71: Europe Refurbished Electronics Market Revenue Opportunity Share, by End-user
Figure 72: Europe Refurbished Electronics Market Revenue Opportunity Share, by Country
Figure 73: Europe Refurbished Electronics Market Value Share Analysis, by Product Type, 2022
Figure 74: Europe Refurbished Electronics Market Value Share Analysis, by Product Type, 2031
Figure 75: Europe Refurbished Electronics Market Absolute Opportunity (US$ Bn), by Smartphones, 2022 – 2031
Figure 76: Europe Refurbished Electronics Market Absolute Opportunity (US$ Bn), by Wearable Devices, 2022 – 2031
Figure 77: Europe Refurbished Electronics Market Absolute Opportunity (US$ Bn), by Computing Devices, 2022 – 2031
Figure 78: Europe Refurbished Electronics Market Absolute Opportunity (US$ Bn), by Home Appliances, 2022 – 2031
Figure 79: Europe Refurbished Electronics Market Absolute Opportunity (US$ Bn), by Sound and Vision, 2022 – 2031
Figure 80: Europe Refurbished Electronics Market Absolute Opportunity (US$ Bn), by Gaming Consoles, 2022 – 2031
Figure 81: Europe Refurbished Electronics Market Value Share Analysis, by Distribution Channel, 2022
Figure 82: Europe Refurbished Electronics Market Value Share Analysis, by Distribution Channel, 2031
Figure 83: Europe Refurbished Electronics Market Absolute Opportunity (US$ Bn), by Offline, 2022 – 2031
Figure 84: Europe Refurbished Electronics Market Absolute Opportunity (US$ Bn), by Online, 2022 – 2031
Figure 85: Europe Refurbished Electronics Market Value Share Analysis, by End-user, 2022
Figure 86: Europe Refurbished Electronics Market Value Share Analysis, by End-user, 2031
Figure 87: Europe Refurbished Electronics Market Absolute Opportunity (US$ Bn), by Corporate Offices, 2022 – 2031
Figure 88: Europe Refurbished Electronics Market Absolute Opportunity (US$ Bn), by Schools and Colleges, 2022 – 2031
Figure 89: Europe Refurbished Electronics Market Absolute Opportunity (US$ Bn), by Government Offices, 2022 – 2031
Figure 90: Europe Refurbished Electronics Market Absolute Opportunity (US$ Bn), by Individuals, 2022 – 2031
Figure 91: Europe Refurbished Electronics Market Value Share Analysis, by Country/Sub-region, 2022
Figure 92: Europe Refurbished Electronics Market Value Share Analysis, by Country/Sub-region, 2031
Figure 93: Germany Refurbished Electronics Market Opportunity Growth Analysis (US$ Bn) Forecast, 2022 – 2031
Figure 94: U.K. Refurbished Electronics Market Opportunity Growth Analysis (US$ Bn) Forecast, 2022 – 2031
Figure 95: France Refurbished Electronics Market Opportunity Growth Analysis (US$ Bn) Forecast, 2022 – 2031
Figure 96: Spain Refurbished Electronics Market Opportunity Growth Analysis (US$ Bn) Forecast, 2022 – 2031
Figure 97: Italy Refurbished Electronics Market Opportunity Growth Analysis (US$ Bn) Forecast, 2022 – 2031
Figure 98: Asia Pacific Absolute Dollar Opportunity
Figure 99: Asia Pacific Refurbished Electronics Market Revenue Opportunity Share, by Product Type
Figure 100: Asia Pacific Refurbished Electronics Market Revenue Opportunity Share, by Distribution Channel
Figure 101: Asia Pacific Refurbished Electronics Market Revenue Opportunity Share, by End-user
Figure 102: Asia Pacific Refurbished Electronics Market Revenue Opportunity Share, by Country/Sub-region
Figure 103: Asia Pacific Refurbished Electronics Market Value Share Analysis, by Product Type, 2022
Figure 104: Asia Pacific Refurbished Electronics Market Value Share Analysis, by Product Type, 2031
Figure 105: Asia Pacific Refurbished Electronics Market Absolute Opportunity (US$ Bn), by Smartphones, 2022 – 2031
Figure 106: Asia Pacific Refurbished Electronics Market Absolute Opportunity (US$ Bn), by Wearable Devices, 2022 – 2031
Figure 107: Asia Pacific Refurbished Electronics Market Absolute Opportunity (US$ Bn), by Computing Devices, 2022 – 2031
Figure 108: Asia Pacific Refurbished Electronics Market Absolute Opportunity (US$ Bn), by Home Appliances, 2022 – 2031
Figure 109: Asia Pacific Refurbished Electronics Market Absolute Opportunity (US$ Bn), by Sound and Vision, 2022 – 2031
Figure 110: Asia Pacific Refurbished Electronics Market Absolute Opportunity (US$ Bn), by Gaming Consoles, 2022 – 2031
Figure 111: Asia Pacific Refurbished Electronics Market Value Share Analysis, by Distribution Channel, 2022
Figure 112: Asia Pacific Refurbished Electronics Market Value Share Analysis, by Distribution Channel, 2031
Figure 113: Asia Pacific Refurbished Electronics Market Absolute Opportunity (US$ Bn), by Offline, 2022 – 2031
Figure 114: Asia Pacific Refurbished Electronics Market Absolute Opportunity (US$ Bn), by Online, 2022 – 2031
Figure 115: Asia Pacific Refurbished Electronics Market Value Share Analysis, by End-user, 2022
Figure 116: Asia Pacific Refurbished Electronics Market Value Share Analysis, by End-user, 2031
Figure 117: Asia Pacific Refurbished Electronics Market Absolute Opportunity (US$ Bn), by Corporate Offices, 2022 – 2031
Figure 118: Asia Pacific Refurbished Electronics Market Absolute Opportunity (US$ Bn), by Schools and Colleges, 2022 – 2031
Figure 119: Asia Pacific Refurbished Electronics Market Absolute Opportunity (US$ Bn), by Government Offices, 2022 – 2031
Figure 120: Asia Pacific Refurbished Electronics Market Absolute Opportunity (US$ Bn), by Individuals, 2022 – 2031
Figure 121: Asia Pacific Refurbished Electronics Market Value Share Analysis, by Country/Sub-region, 2022
Figure 122: Asia Pacific Refurbished Electronics Market Value Share Analysis, by Country/Sub-region, 2031
Figure 123: China Refurbished Electronics Market Opportunity Growth Analysis (US$ Bn) Forecast, 2022 – 2031
Figure 124: India Refurbished Electronics Market Opportunity Growth Analysis (US$ Bn) Forecast, 2022 – 2031
Figure 125: Japan Refurbished Electronics Market Opportunity Growth Analysis (US$ Bn) Forecast, 2022 – 2031
Figure 126: ASEAN Refurbished Electronics Market Opportunity Growth Analysis (US$ Bn) Forecast, 2022 – 2031
Figure 127: Middle East & Africa Absolute Dollar Opportunity
Figure 128: Middle East & Africa Refurbished Electronics Market Revenue Opportunity Share, by Product Type
Figure 129: Middle East & Africa Refurbished Electronics Market Revenue Opportunity Share, by Distribution Channel
Figure 130: Middle East & Africa Refurbished Electronics Market Revenue Opportunity Share, by End-user
Figure 131: Middle East & Africa Refurbished Electronics Market Revenue Opportunity Share, by Country/Sub-region
Figure 132: Middle East & Africa Refurbished Electronics Market Value Share Analysis, by Product Type, 2022
Figure 133: Middle East & Africa Refurbished Electronics Market Value Share Analysis, by Product Type, 2031
Figure 134: Middle East & Africa Refurbished Electronics Market Absolute Opportunity (US$ Bn), by Smartphones, 2022 – 2031
Figure 135: Middle East & Africa Refurbished Electronics Market Absolute Opportunity (US$ Bn), by Wearable Devices, 2022 – 2031
Figure 136: Middle East & Africa Refurbished Electronics Market Absolute Opportunity (US$ Bn), by Computing Devices, 2022 – 2031
Figure 137: Middle East & Africa Refurbished Electronics Market Absolute Opportunity (US$ Bn), by Home Appliances, 2022 – 2031
Figure 138: Middle East & Africa Refurbished Electronics Market Absolute Opportunity (US$ Bn), by Sound and Vision, 2022 – 2031
Figure 139: Middle East & Africa Refurbished Electronics Market Absolute Opportunity (US$ Bn), by Gaming Consoles, 2022 – 2031
Figure 140: Middle East & Africa Refurbished Electronics Market Value Share Analysis, by Distribution Channel, 2022
Figure 141: Middle East & Africa Refurbished Electronics Market Value Share Analysis, by Distribution Channel, 2031
Figure 142: Middle East & Africa Refurbished Electronics Market Absolute Opportunity (US$ Bn), by Offline, 2022 – 2031
Figure 143: Middle East & Africa Refurbished Electronics Market Absolute Opportunity (US$ Bn), by Online, 2022 – 2031
Figure 144: Middle East & Africa Refurbished Electronics Market Value Share Analysis, by End-user, 2022
Figure 145: Middle East & Africa Refurbished Electronics Market Value Share Analysis, by End-user, 2031
Figure 146: Middle East & Africa Refurbished Electronics Market Absolute Opportunity (US$ Bn), by Corporate Offices, 2022 – 2031
Figure 147: Middle East & Africa Refurbished Electronics Market Absolute Opportunity (US$ Bn), by Schools and Colleges, 2022 – 2031
Figure 148: Middle East & Africa Refurbished Electronics Market Absolute Opportunity (US$ Bn), by Government Offices, 2022 – 2031
Figure 149: Middle East & Africa Refurbished Electronics Market Absolute Opportunity (US$ Bn), by Individuals, 2022 – 2031
Figure 150: Middle East & Africa Refurbished Electronics Market Value Share Analysis, by Country/Sub-region, 2022
Figure 151: Middle East & Africa Refurbished Electronics Market Value Share Analysis, by Country/Sub-region, 2031
Figure 152: Saudi Arabia Refurbished Electronics Market Opportunity Growth Analysis (US$ Bn) Forecast, 2022 – 2031
Figure 153: United Arab Emirates Refurbished Electronics Market Opportunity Growth Analysis (US$ Bn) Forecast, 2022 – 2031
Figure 154: South Africa Refurbished Electronics Market Opportunity Growth Analysis (US$ Bn) Forecast, 2022 – 2031
Figure 155: South America Absolute Dollar Opportunity
Figure 156: South America Refurbished Electronics Market Revenue Opportunity Share, by Product Type
Figure 157: South America Refurbished Electronics Market Revenue Opportunity Share, by Distribution Channel
Figure 158: South America Refurbished Electronics Market Revenue Opportunity Share, by End-user
Figure 159: South America Refurbished Electronics Market Revenue Opportunity Share, by Country/Sub-region
Figure 160: South America Refurbished Electronics Market Value Share Analysis, by Product Type, 2022
Figure 161: South America Refurbished Electronics Market Value Share Analysis, by Product Type, 2031
Figure 162: South America Refurbished Electronics Market Absolute Opportunity (US$ Bn), by Smartphones, 2022 – 2031
Figure 163: South America Refurbished Electronics Market Absolute Opportunity (US$ Bn), by Wearable Devices, 2022 – 2031
Figure 164: South America Refurbished Electronics Market Absolute Opportunity (US$ Bn), by Computing Devices, 2022 – 2031
Figure 165: South America Refurbished Electronics Market Absolute Opportunity (US$ Bn), by Home Appliances, 2022 – 2031
Figure 166: South America Refurbished Electronics Market Absolute Opportunity (US$ Bn), by Sound and Vision, 2022 – 2031
Figure 167: South America Refurbished Electronics Market Absolute Opportunity (US$ Bn), by Gaming Consoles, 2022 – 2031
Figure 168: South America Refurbished Electronics Market Value Share Analysis, by Distribution Channel, 2022
Figure 169: South America Refurbished Electronics Market Value Share Analysis, by Distribution Channel, 2031
Figure 170: South America Refurbished Electronics Market Absolute Opportunity (US$ Bn), by Offline, 2022 – 2031
Figure 171: South America Refurbished Electronics Market Absolute Opportunity (US$ Bn), by Online, 2022 – 2031
Figure 172: South America Refurbished Electronics Market Value Share Analysis, by End-user, 2022
Figure 173: South America Refurbished Electronics Market Value Share Analysis, by End-user, 2031
Figure 174: South America Refurbished Electronics Market Absolute Opportunity (US$ Bn), by Corporate Offices, 2022 – 2031
Figure 175: South America Refurbished Electronics Market Absolute Opportunity (US$ Bn), by Schools and Colleges, 2022 – 2031
Figure 176: South America Refurbished Electronics Market Absolute Opportunity (US$ Bn), by Government Offices, 2022 – 2031
Figure 177: South America Refurbished Electronics Market Absolute Opportunity (US$ Bn), by Individuals, 2022 – 2031
Figure 178: South America Refurbished Electronics Market Value Share Analysis, by Country/Sub-region, 2022
Figure 179: South America Refurbished Electronics Market Value Share Analysis, by Country/Sub-region, 2031
Figure 180: Brazil Refurbished Electronics Market Opportunity Growth Analysis (US$ Bn) Forecast, 2022 – 2031
Figure 181: Argentina Refurbished Electronics Market Opportunity Growth Analysis (US$ Bn) Forecast, 2022 – 2031
Copyright © Transparency Market Research, Inc. All Rights reserved
Trust Online

Refurbished Electronics Market
