Analysts’ Viewpoint on Red Biotechnology Market Scenario
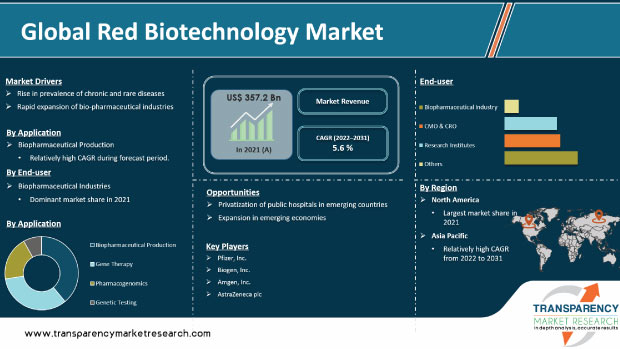
Introduction of recombinant DNA (rDNA) methods marked the beginning of the biotechnology era. Innumerable studies and tests on the potential of biotechnology to improve health have been undertaken since. Development of biotechnology has made it possible to design innovative therapeutic medications for effective disease treatment. Usage of red biotechnology products in individualized medical therapies is likely to create lucrative opportunities for market players. Rise in prevalence of chronic diseases, rapid growth of the biopharmaceutical sector, and increase in healthcare expenditure are expected to propel the global red biotechnology market in the next few years. Additionally, increase in technological advancements in the treatment of chronic diseases and rich pipeline of novel therapeutic compounds are likely to augment the global market.
Supporting sectors in the biotech industry, such as health services, are growing steadily. Investors are particularly interested in healthcare start-ups in the biotechnology field. Artificial intelligence (AI) is being used in various new ways. For instance, it has been used to progressively alter biotechnology research projects, as it helps reduce the cost and time taken to develop life-saving medications.
Stem cell research, which is one of the game-changing red biotechnology applications, is advancing at a heightened pace. It focuses on designing highly individualized therapies using a patient's own cells. Similarly, genetic engineering involves altering a patient's genetic makeup to find certain spots of interest. Steps are being taken to investigate and incorporate biotechnology into the development of individualized medical care. The implications of cloud-based technology, AI, and increasing focus on R&D have given businesses in the biotechnology sector a competitive edge.
The need for innovative drug molecules for effective disease treatment is expected to be driven by the increase in number of chronic and rare diseases globally. The WHO estimates that there are between 6,000 and 8,000 rare diseases, and over 80% of these are hereditary abnormalities. Hence, rise in incidence and prevalence of chronic and rare diseases and increase in need for diagnostics and treatments for quick and effective disease management are likely to drive the global red biotechnology market during the forecast period.
Increase in R&D efforts, rise in number of patients suffering from diseases such as cancer, and rapid expansion of health care and pharmaceutical sectors in developed and emerging markets are projected to augment the global red biotechnology market during the forecast period. According to India Brand Equity Foundation, the country’s biotechnology sector, which includes bio-pharmaceuticals, bio-services, bio-agriculture, bio-industrial, and bioinformatics, is expected to advance at a CAGR of 30% to reach US$ 100.0 Bn by 2025.
In terms of application, the global red biotechnology market has been classified into biopharmaceutical production, gene therapy, pharmacogenomics, and genetic testing. The biopharmaceutical production segment is likely to account for major share of the global market during the forecast period. Increase in demand for biologics and technological advancements are projected to drive the segment in the next few years. Furthermore, rise in disease prevalence in emerging and developed markets, and increase in healthcare spending are expected to boost the biopharmaceutical production segment.
Based on end-user, the global red biotechnology market has been divided into biopharmaceutical industry, CMO & CRO, research institutes, and others. The biopharmaceutical industry segment is expected to account for the major share of the global market during the forecast period. The segment is likely to be driven by the rise in demand for biologics in the treatment of chronic diseases and increase in clinical trial activities. Surge in adoption of expansion strategies by well-established players is also projected to augment the biopharmaceutical industry segment.
North America dominated the global red biotechnology market in 2021, led by the increase in adoption of red biotechnology, new product approvals, rise in mergers & acquisitions, and surge in healthcare expenditure.
Asia Pacific is expected to offer lucrative opportunities to leading players in the red biotechnology market during the forecast period. Growth in product approvals from regional governing authorities, rise in number of CMOs & CROs, and surge in investment by large biopharmaceutical manufacturers are the major drivers anticipated to propel the red biotechnology market in Asia Pacific in the near future.
Europe also held vital share of the global market in 2021. The market in the region is expected to be driven by research activities, increase in patient population, expansion of the healthcare infrastructure, and rise in number of clinical studies and product approvals.
The global red biotechnology market is fragmented, with significant presence of large-scale players. Leading players operating in the global red biotechnology market are Pfizer, Inc., Biogen, Inc., Amgen, Inc., AstraZeneca plc, Gilead Sciences, Inc., Celgene Corporation (Bristol-Myers Squibb Company), F. Hoffmann-La Roche, Ltd., Merck KGaA, Regeneron Pharmaceuticals, Inc., and Takeda Pharmaceutical Company Limited. These players are adopting growth strategies such as new product development, product launches, product approval, agreement, partnerships, and mergers to increase their market share.
Each of the players has been profiled in the red biotechnology market report based on parameters such as company overview, financial overview, business strategies, product portfolio, business segments, and recent developments.
|
Attribute |
Detail |
|
Market Size Value in 2021 |
US$ 357.2 Bn |
|
Market Forecast Value in 2031 |
More than US$ 609.6 Bn |
|
Growth Rate (CAGR) 2022-2031 |
5.6% |
|
Forecast Period |
2022–2031 |
|
Historical Data Available for |
2017–2021 |
|
Quantitative Units |
US$ Bn for Value |
|
Market Analysis |
It includes segment analysis as well as regional level analysis. Moreover, qualitative analysis includes drivers, restraints, opportunities, key trends, Porter’s Five Forces analysis, value chain analysis, and key trend analysis. |
|
Competition Landscape |
|
|
Format |
Electronic (PDF) + Excel |
|
Market Segmentation |
|
|
Regions Covered |
|
|
Countries Covered |
|
|
Companies Profiled |
|
|
Customization Scope |
Available upon request |
|
Pricing |
Available upon request |
The global red biotechnology market was valued at US$ 357.2 Bn in 2021
The global red biotechnology market is projected to reach more than US$ 609.6 Bn by 2031
The global red biotechnology market grew at a CAGR of 3.6% from 2017 to 2021
The global red biotechnology market is anticipated to grow at a CAGR of 5.6% from 2022 to 2031
The biopharmaceutical industry segment held around 42% share of the global red biotechnology market in 2021
North America is expected to account for major share of the global red biotechnology market during the forecast period.
Prominent players in the global red biotechnology market are Pfizer, Inc., Biogen, Inc., Amgen, Inc., AstraZeneca plc, Gilead Sciences, Inc., Celgene Corporation (Bristol-Myers Squibb Company), F. Hoffmann-La Roche, Ltd., Merck KGaA, Regeneron Pharmaceuticals, Inc., and Takeda Pharmaceutical, Company Limited.
1. Preface
1.1. Market Definition and Scope
1.2. Market Segmentation
1.3. Key Research Objectives
1.4. Research Highlights
2. Assumptions and Research Methodology
3. Executive Summary: Global Red Biotechnology Market
4. Market Overview
4.1. Introduction
4.1.1. Segment Definition
4.2. Overview
4.3. Market Dynamics
4.3.1. Drivers
4.3.2. Restraints
4.3.3. Opportunities
4.4. Global Red Biotechnology Market Analysis and Forecast, 2017–2031
4.4.1. Market Revenue Projections (US$ Mn)
5. Key Insights
5.1. Pipeline Analysis
5.2. Reimbursement Scenario by Region/globally
5.3. Key Industry Events (merger & acquisitions)
5.4. Covid-19 Impact Analysis
6. Global Red Biotechnology Market Analysis and Forecast, by Application
6.1. Introduction & Definition
6.2. Key Findings / Developments
6.3. Market Value Forecast, by Application, 2017–2031
6.3.1. Biopharmaceutical Production
6.3.2. Pharmacogenomics
6.3.3. Gene Therapy
6.3.4. Genetic Testing
6.4. Market Attractiveness Analysis, by Application
7. Global Red Biotechnology Market Analysis and Forecast, by End-user
7.1. Introduction & Definition
7.2. Key Findings / Developments
7.3. Market Value Forecast, by End-user, 2017–2031
7.3.1. Biopharmaceutical Industry
7.3.2. CMO & CRO
7.3.3. Research Institutes
7.3.4. Others
7.4. Market Attractiveness Analysis, by End-user
8. Global Red Biotechnology Market Analysis and Forecast, by Region
8.1. Key Findings
8.2. Market Value Forecast, by Region
8.2.1. North America
8.2.2. Europe
8.2.3. Asia Pacific
8.2.4. Latin America
8.2.5. Middle East & Africa
8.3. Market Attractiveness Analysis, by Region
9. North America Red Biotechnology Market Analysis and Forecast
9.1. Introduction
9.1.1. Key Findings
9.2. Market Value Forecast, by Application, 2017–2031
9.2.1. Biopharmaceutical Production
9.2.2. Pharmacogenomics
9.2.3. Gene Therapy
9.2.4. Genetic Testing
9.3. Market Value Forecast, by End-user, 2017–2031
9.3.1. Biopharmaceutical Industry
9.3.2. CMO & CRO
9.3.3. Research Institutes
9.3.4. Others
9.4. Market Value Forecast, by Country, 2017–2031
9.4.1. U.S.
9.4.2. Canada
9.5. Market Attractiveness Analysis
9.5.1. By Application
9.5.2. By End-user
9.5.3. By Country
10. Europe Red Biotechnology Market Analysis and Forecast
10.1. Introduction
10.1.1. Key Findings
10.2. Market Value Forecast, by Application, 2017–2031
10.2.1. Biopharmaceutical Production
10.2.2. Pharmacogenomics
10.2.3. Gene Therapy
10.2.4. Genetic Testing
10.3. Market Value Forecast, by End-user, 2017–2031
10.3.1. Biopharmaceutical Industry
10.3.2. CMO & CRO
10.3.3. Research Institutes
10.3.4. Others
10.4. Market Value Forecast, by Country/Sub-region, 2017–2031
10.4.1. Germany
10.4.2. U.K.
10.4.3. France
10.4.4. Spain
10.4.5. Italy
10.4.6. Rest of Europe
10.5. Market Attractiveness Analysis
10.5.1. By Application
10.5.2. By End-user
10.5.3. By Country/Sub-region
11. Asia Pacific Red Biotechnology Market Analysis and Forecast
11.1. Introduction
11.1.1. Key Findings
11.2. Market Value Forecast, by Application, 2017–2031
11.2.1. Biopharmaceutical Production
11.2.2. Pharmacogenomics
11.2.3. Gene Therapy
11.2.4. Genetic Testing
11.3. Market Value Forecast, by End-user, 2017–2031
11.3.1. Biopharmaceutical Industry
11.3.2. CMO & CRO
11.3.3. Research Institutes
11.3.4. Others
11.4. Market Value Forecast, by Country/Sub-region, 2017–2031
11.4.1. China
11.4.2. India
11.4.3. Japan
11.4.4. Australia & New Zealand
11.4.5. Rest of Asia Pacific
11.5. Market Attractiveness Analysis
11.5.1. By Application
11.5.2. By End-user
11.5.3. By Country/Sub-region
12. Latin America Red Biotechnology Market Analysis and Forecast
12.1. Introduction
12.1.1. Key Findings
12.2. Market Value Forecast, by Application, 2017–2031
12.2.1. Biopharmaceutical Production
12.2.2. Pharmacogenomics
12.2.3. Gene Therapy
12.2.4. Genetic Testing
12.3. Market Value Forecast, by End-user, 2017–2031
12.3.1. Biopharmaceutical Industry
12.3.2. CMO & CRO
12.3.3. Research Institutes
12.3.4. Others
12.4. Market Value Forecast, by Country/Sub-region, 2017–2031
12.4.1. Brazil
12.4.2. Mexico
12.4.3. Rest of Latin America
12.5. Market Attractiveness Analysis
12.5.1. By Application
12.5.2. By End-user
12.5.3. By Country/Sub-region
13. Middle East & Africa Red Biotechnology Market Analysis and Forecast
13.1. Introduction
13.1.1. Key Findings
13.2. Market Value Forecast, by Application, 2017–2031
13.2.1. Biopharmaceutical Production
13.2.2. Pharmacogenomics
13.2.3. Gene Therapy
13.2.4. Genetic Testing
13.3. Market Value Forecast, by End-user, 2017–2031
13.3.1. Biopharmaceutical Industry
13.3.2. CMO & CRO
13.3.3. Research Institutes
13.3.4. Others
13.4. Market Value Forecast, by Country/Sub-region, 2017–2031
13.4.1. GCC Countries
13.4.2. South Africa
13.4.3. Rest of Middle East & Africa
13.5. Market Attractiveness Analysis
13.5.1. By Application
13.5.2. By End-user
13.5.3. By Country/Sub-region
14. Competition Landscape
14.1. Market Player – Competition Matrix (by tier and size of companies)
14.2. Market Share Analysis, by Company, 2021
14.3. Company Profiles
14.3.1. Pfizer, Inc.
14.3.1.1. Company Overview
14.3.1.2. Financial Overview
14.3.1.3. Product Portfolio
14.3.1.4. Business Strategies
14.3.1.5. Recent Developments
14.3.2. Biogen, Inc.
14.3.2.1. Company Overview
14.3.2.2. Financial Overview
14.3.2.3. Product Portfolio
14.3.2.4. Business Strategies
14.3.2.5. Recent Developments
14.3.3. Amgen, Inc.
14.3.3.1. Company Overview
14.3.3.2. Financial Overview
14.3.3.3. Product Portfolio
14.3.3.4. Business Strategies
14.3.3.5. Recent Developments
14.3.4. AstraZeneca plc
14.3.4.1. Company Overview
14.3.4.2. Financial Overview
14.3.4.3. Product Portfolio
14.3.4.4. Business Strategies
14.3.4.5. Recent Developments
14.3.5. Gilead Sciences, Inc.
14.3.5.1. Company Overview
14.3.5.2. Financial Overview
14.3.5.3. Product Portfolio
14.3.5.4. Business Strategies
14.3.5.5. Recent Developments
14.3.6. Celgene Corporation (Bristol-Myers Squibb Company)
14.3.6.1. Company Overview
14.3.6.2. Financial Overview
14.3.6.3. Product Portfolio
14.3.6.4. Business Strategies
14.3.6.5. Recent Developments
14.3.7. F. Hoffmann-La Roche, Ltd.
14.3.7.1. Company Overview
14.3.7.2. Financial Overview
14.3.7.3. Product Portfolio
14.3.7.4. Business Strategies
14.3.7.5. Recent Developments
14.3.8. Merck KGaA
14.3.8.1. Company Overview
14.3.8.2. Financial Overview
14.3.8.3. Product Portfolio
14.3.8.4. Business Strategies
14.3.8.5. Recent Developments
14.3.9. Regeneron Pharmaceuticals, Inc.
14.3.9.1. Company Overview
14.3.9.2. Financial Overview
14.3.9.3. Product Portfolio
14.3.9.4. Business Strategies
14.3.9.5. Recent Developments
14.3.10. Takeda Pharmaceutical Company Limited
14.3.10.1. Company Overview
14.3.10.2. Financial Overview
14.3.10.3. Product Portfolio
14.3.10.4. Business Strategies
14.3.10.5. Recent Developments
List of Tables
Table 01: Global Red Biotechnology Market Value (US$ Bn) Forecast, by Application, 2022–2031
Table 02: Global Red Biotechnology Market Value (US$ Bn) Forecast, by End-user, 2022–2031
Table 03: Global Red Biotechnology Market Value (US$ Bn) Forecast, by Region, 2022–2031
Table 04: North America Red Biotechnology Market Value (US$ Bn) Forecast, by Country, 2022–2031
Table 05: North America Red Biotechnology Market Value (US$ Bn) Forecast, by Application, 2022–2031
Table 06: North America Red Biotechnology Market Value (US$ Bn) Forecast, by End-user, 2022–2031
Table 07: Europe Red Biotechnology Market Value (US$ Bn) Forecast, by Country/Sub-region, 2022–2031
Table 08: Europe Red Biotechnology Market Value (US$ Bn) Forecast, by Application, 2022–2031
Table 09: Europe Red Biotechnology Market Value (US$ Bn) Forecast, by End-user, 2022–2031
Table 10: Asia Pacific Red Biotechnology Market Value (US$ Bn) Forecast, by Country/Sub-region, 2022–2031
Table 11: Asia Pacific Red Biotechnology Market Value (US$ Bn) Forecast, by Application, 2022–2031
Table 12: Asia Pacific Red Biotechnology Market Value (US$ Bn) Forecast, by End-user, 2022–2031
Table 13: Latin America Red Biotechnology Market Value (US$ Bn) Forecast, by Country/Sub-region, 2022–2031
Table 14: Latin America Red Biotechnology Market Value (US$ Bn) Forecast, by Application, 2022–2031
Table 15: Latin America Red Biotechnology Market Value (US$ Bn) Forecast, by End-user, 2022–2031
Table 16: Middle East & Africa Red Biotechnology Market Value (US$ Bn) Forecast, by Country/Sub-region, 2022–2031
Table 17: Middle East & Africa Red Biotechnology Market Value (US$ Bn) Forecast, by Application, 2022–2031
Table 18: Middle East & Africa Red Biotechnology Market Value (US$ Bn) Forecast, by End-user, 2022–2031
List of Figures
Figure 01: Global Red Biotechnology Market Value (US$ Bn) Forecast, 2022–2031
Figure 02: Global Red Biotechnology Market Value Share (%), by Application, 2021
Figure 03: Global Red Biotechnology Market Value Share (%), by End-user, 2021
Figure 04: Global Red Biotechnology Market Value Share (%), by Region, 2021
Figure 05: Global Red Biotechnology Market Value Share (%), by Application, 2021 and 2031
Figure 06: Global Red Biotechnology Market Attractiveness Analysis, by Application, 2021–2031
Figure 07: Global Red Biotechnology Market Value (US$ Bn) and Y-o-Y Growth (%), by Biopharmaceutical Production, 2022–2031
Figure 08: Global Red Biotechnology Market Value (US$ Bn) and Y-o-Y Growth (%), by Gene Therapy, 2022–2031
Figure 09: Global Red Biotechnology Market Value (US$ Bn) and Y-o-Y Growth (%), by Pharmacogenomics, 2022–2031
Figure 10: Global Red Biotechnology Market Value (US$ Bn) and Y-o-Y Growth (%), by Genetic Testing, 2022–2031
Figure 11: Global Red Biotechnology Market Value Share Analysis, by End-user, 2021–2031
Figure 12: Global Red Biotechnology Market Value (US$ Bn) and Y-o-Y Growth (%), by Biopharmaceutical Industry, 2022–2031
Figure 13: Global Red Biotechnology Market Value (US$ Bn) and Y-o-Y Growth (%), by CMO & CRO, 2022–2031
Figure 14: Global Red Biotechnology Market Value (US$ Bn) and Y-o-Y Growth (%), by Research Institutes, 2022–2031
Figure 15: Global Red Biotechnology Market Value (US$ Bn) and Y-o-Y Growth (%), by Others, 2022–2031
Figure 16: Global Red Biotechnology Market Attractiveness Analysis, by End-user, 2021–2031
Figure 17: Global Red Biotechnology Market Value Share Analysis, by Region, 2021 and 2031
Figure 18: Global Red Biotechnology Market Attractiveness Analysis, by Region, 2021–2031
Figure 19: North America Red Biotechnology Market Value (US$ Bn) and Y-o-Y Growth (%) Forecast, 2022–2031
Figure 20: North America Red Biotechnology Market Value Share Analysis, by Country, 2021 and 2031
Figure 21: North America Red Biotechnology Market Attractiveness Analysis, by Country, 2021–2031
Figure 22: North America Red Biotechnology Market Value Share (%), by Application, 2021 and 2031
Figure 23: North America Red Biotechnology Market Attractiveness Analysis, by Application, 2021–2031
Figure 24: North America Red Biotechnology Market Value Share Analysis, by End-user, 2021–2031
Figure 25: North America Red Biotechnology Market Attractiveness Analysis, by End-user, 2021–2031
Figure 26: Europe Red Biotechnology Market Value (US$ Bn) and Y-o-Y Growth (%) Forecast, 2022–2031
Figure 27: Europe Red Biotechnology Market Value Share Analysis, by Country/Sub-region, 2021 and 2031
Figure 28: Europe Red Biotechnology Market Attractiveness Analysis, by Country/Sub-region, 2021–2031
Figure 29: Europe Red Biotechnology Market Value Share (%), by Application, 2021 and 2031
Figure 30: Europe Red Biotechnology Market Attractiveness Analysis, by Application, 2021–2031
Figure 31: Europe Red Biotechnology Market Value Share Analysis, by End-user, 2022–2031
Figure 32: Europe Red Biotechnology Market Attractiveness Analysis, by End-user, 2022–2031
Figure 33: Asia Pacific Red Biotechnology Market Value (US$ Bn) and Y-o-Y Growth (%) Forecast, 2022–2031
Figure 34: Asia Pacific Red Biotechnology Market Value Share Analysis, by Country/Sub-region, 2021 and 2031
Figure 35: Asia Pacific Red Biotechnology Market Attractiveness Analysis, by Country/Sub-region, 2021–2031
Figure 36: Asia Pacific Red Biotechnology Market Value Share (%), by Application, 2021 and 2031
Figure 37: Asia Pacific Red Biotechnology Market Attractiveness Analysis, by Application, 2021–2031
Figure 38: Asia Pacific Red Biotechnology Market Value Share Analysis, by End-user, 2022–2031
Figure 39: Asia Pacific Red Biotechnology Market Attractiveness Analysis, by End-user, 2021–2031
Figure 40: Latin America Red Biotechnology Market Value (US$ Bn) and Y-o-Y Growth (%) Forecast, 2022–2031
Figure 41: Latin America Red Biotechnology Market Value Share Analysis, by Country/Sub-region, 2021 and 2031
Figure 42: Latin America Red Biotechnology Market Attractiveness Analysis, by Country/Sub-region, 2021–2031
Figure 43: Latin America Red Biotechnology Market Value Share (%), by Application, 2021 and 2031
Figure 44: Latin America Red Biotechnology Market Attractiveness Analysis, by Application, 2021–2031
Figure 45: Latin America Red Biotechnology Market Value Share Analysis, by End-user, 2022–2031
Figure 46: Latin America Red Biotechnology Market Attractiveness Analysis, by End-user, 2021–2031
Figure 47: Middle East & Africa Red Biotechnology Market Value (US$ Bn) and Y-o-Y Growth (%) Forecast, 2022–2031
Figure 48: Middle East & Africa Red Biotechnology Market Value Share Analysis, by Country/Sub-region, 2021 and 2031
Figure 49: Middle East & Africa Red Biotechnology Market Attractiveness Analysis, by Country/Sub-region, 2021–2031
Figure 50: Middle East & Africa Red Biotechnology Market Value Share (%), by Application, 2021 and 2031
Figure 51: Middle East & Africa Red Biotechnology Market Attractiveness Analysis, by Application, 2021–2031
Figure 52: Middle East & Africa Red Biotechnology Market Value Share Analysis, by End-user, 2022–2031
Figure 53: Middle East & Africa Red Biotechnology Market Attractiveness Analysis, by End-user, 2021–2031
Figure 54: Global Red Biotechnology Market Share, by Company, 2021
Copyright © Transparency Market Research, Inc. All Rights reserved
Trust Online

Red Biotechnology Market
