Quantum computing holds promising potentials in discovering possible COVID-19 treatments. Funding from the Penn State Institute for Computational and Data Sciences, coordinated through the Penn State Huck Institutes of the Life Sciences is gaining popularity to explore new methods for drug discovery. Such trends are translating into revenue opportunities for companies in the quantum computing market during the developing pandemic.
The combination of machine learning with quantum physics is giving rise to research projects that are helping to screen billions of chemical compounds to find relevant drug candidates. In order to support these researches, stakeholders in the quantum computing market are increasing the availability of supercomputers and increasing R&D in artificial intelligence (AI).
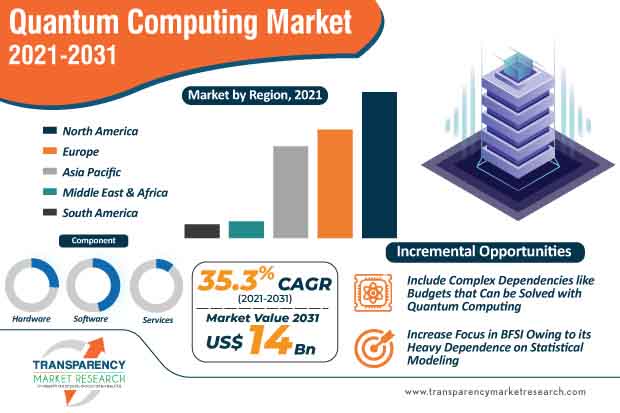
The global quantum computing market is projected to advance at a CAGR of 35.3% during the forecast period. However, it has been found that quantum computing is a threat to current cryptographic algorithms, thus affecting security. This has increased the need for quantum-safe algorithms. As enterprises are ensuring a practical plan to protect their businesses from security threats, currently, encrypted assets need to be re-evaluated and secured in a quantum-resistant way.
Though quantum computing is currently in its nascent stage, its impact is anticipated to grow in finance, pharmaceuticals, AI and automotive sectors. Companies in the quantum computing market are unlocking incremental opportunities in financial services organizations and other businesses that are heavily dependent on statistical modeling of future outcomes.
The quantum computing market is projected to reach US$ 14 Bn by 2031. Quantum computing is expected to develop breakthrough products & services that will disrupt and revolutionize manufacturing. Product development, chemical discovery, and process optimization are among the many applications that are anticipated to be redefined by quantum computing.
The early adopters of quantum computing are anticipated to gain advantage over other stakeholders in the long run. The quantum computing market is undergoing a crucial change with companies such as Microsoft, AWS, and IBM who are introducing their quantum computing cloud platforms, which help individuals to use their services without the need for hardware.
Companies in the quantum computing market are tapping into revenue opportunities in the energy & power sector. This technology is helping stakeholders in the energy & power industry to take important investment decisions related to whole assets, workovers, and infrastructure. These decisions may include dependencies on budgets, resource availability, and contractual obligations that can be resolved with the help of quantum computing.
Moreover, with the help of quantum computing, stakeholders in the energy & power sector are seeking to maximize the value from complex dependency decisions and minimize the risks incurred by those decisions. For instance, NASA is using quantum computing to best schedule a set of tasks performed by planetary explorers, which involves tasks related to battery power.
Analysts’ Viewpoint
There is a surge in research projects in the quantum computing market that are exploring quantum machine learning to unlock new capabilities in COVID-19 drug discovery by generating possible chemical compounds quickly. Although the adoption of quantum computing is relatively slow among enterprises, its application is predicted to grow exponentially in BFSI, healthcare, and manufacturing industries. Quantum communications hold promising potentials for significant protection against eavesdropping. Since quantum computing is still in its nascent stage, it is evident that a quantum computer might figure the most probable answer for breaking an encryption algorithm, but will need the classical computer to test the answer to determine whether it actually breaks the algorithm.
|
Attribute |
Detail |
|
Market Size Value in 2020 (Base Year) |
US$ 517.13 Mn |
|
Market Forecast Value in 2031 |
US$ 14 Bn |
|
Growth Rate (CAGR) |
35.3% |
|
Forecast Period |
2021-2031 |
|
Quantitative Units |
US$ Mn for Value |
|
Market Analysis |
It includes market size assessment for the historic period 2016-2019, along with base year and forecast period, in terms of value (US$ Mn). It also provides insights such as regional analysis, opportunity assessment, product development and innovation, and ecosystem analysis. |
|
Competition Landscape |
|
|
Format |
Electronic (PDF) + Excel |
|
Market Segmentation |
|
|
Regions Covered |
|
|
Countries Covered |
|
|
Companies Profiled |
|
|
Customization Scope |
Available upon Request |
|
Pricing |
Available upon Request |
1. Preface
1.1. Market Introduction
1.2. Market Segmentation
1.3. Key Research Objectives
2. Assumptions and Research Methodology
2.1. Research Methodology
2.1.1. List of Primary and Secondary Sources
2.2. Key Assumptions for Data Modelling
3. Executive Summary - Global Quantum Computing Market
4. Market Overview
4.1. Market Definition
4.2. Technology Roadmap
4.3. Market Factor Analysis
4.3.1. Forecast Factors
4.3.2. Ecosystem Analysis
4.3.3. Market Dynamics (Growth Influencers)
4.3.3.1. Drivers
4.3.3.2. Restraints
4.3.3.3. Opportunities
4.3.3.4. Impact Analysis of Drivers and Restraints
4.4. COVID-19 Impact Analysis
4.4.1. Impact of COVID-19 on Quantum Computing Market
4.4.2. End use Sentiment Analysis: Comparative Analysis on Spending
4.4.2.1. Increase in Spending
4.4.2.2. Decrease in Spending
4.4.3. Short Term and Long Term Impact on the Market
4.5. Market Opportunity Assessment – by Region (North America/ Europe/ Asia Pacific/ Middle East & Africa/ South America)
4.5.1. By Component
4.5.2. By Application
4.5.3. By End-use Industry
4.6. Market Outlook
5. Global Quantum Computing Market Analysis and Forecast
5.1. Market Revenue Analysis (US$ Mn), 2016-2031
5.1.1. Historic Growth Trends, 2016-2020
5.1.2. Forecast Trends, 2021-2031
5.2. Pricing Model Analysis/ Price Trend Analysis
6. Global Quantum Computing Market Analysis, by Component
6.1. Overview and Definitions
6.2. Key Segment Analysis
6.3. Quantum Computing Market Size (US$ Mn) Forecast, by Component, 2018 - 2031
6.3.1. Hardware (Systems)
6.3.2. Software
6.3.3. Services
6.3.3.1. Training & Consulting
6.3.3.2. Integration & Implementation
6.3.3.3. Support & Maintenance
7. Global Quantum Computing Market Analysis, by Application
7.1. Overview and Definitions
7.2. Key Segment Analysis
7.3. Quantum Computing Market Size (US$ Mn) Forecast, by Application, 2018 - 2031
7.3.1. Optimization
7.3.2. Machine Learning
7.3.3. Material Simulation
8. Global Quantum Computing Market Analysis, by End-use Industry
8.1. Key Segment Analysis
8.2. Quantum Computing Market Size (US$ Mn) Forecast, by End-use Industry, 2018 - 2031
8.2.1. Aerospace & Defense
8.2.2. Automotive
8.2.3. BFSI
8.2.4. Healthcare
8.2.5. Chemicals
8.2.6. Manufacturing
8.2.7. Energy & Power
8.2.8. Others
9. Global Quantum Computing Market Analysis and Forecast, by Region
9.1. Key Findings
9.2. Quantum Computing Market Size (US$ Mn) Forecast, by Region, 2018 - 2031
9.2.1. North America
9.2.2. Europe
9.2.3. Asia Pacific
9.2.4. Middle East & Africa
9.2.5. South America
10. North America Quantum Computing Market Analysis
10.1. Regional Outlook
10.2. Quantum Computing Market Size (US$ Mn) Analysis and Forecast (2018 - 2031)
10.2.1. By Component
10.2.2. By Application
10.2.3. By End-use Industry
10.3. Quantum Computing Market Size (US$ Mn) Forecast, by Country, 2018 - 2031
10.3.1. U.S.
10.3.2. Canada
10.3.3. Mexico
11. Europe Quantum Computing Market Analysis and Forecast
11.1. Regional Outlook
11.2. Quantum Computing Market Size (US$ Mn) Analysis and Forecast (2018 - 2031)
11.2.1. By Component
11.2.2. By Application
11.2.3. By End-use Industry
11.3. Quantum Computing Market Size (US$ Mn) Forecast, by Country & Sub-region, 2018 - 2031
11.3.1. Germany
11.3.2. U.K.
11.3.3. France
11.3.4. Spain
11.3.5. Italy
11.3.6. Rest of Europe
12. APAC Quantum Computing Market Analysis and Forecast
12.1. Regional Outlook
12.2. Quantum Computing Market Size (US$ Mn) Analysis and Forecast (2018 - 2031)
12.2.1. By Component
12.2.2. By Application
12.2.3. By End use Industry
12.3. Quantum Computing Market Size (US$ Mn) Forecast, by Country & Sub-region, 2018 - 2031
12.3.1. China
12.3.2. India
12.3.3. Japan
12.3.4. ASEAN
12.3.5. Rest of Asia Pacific
13. Middle East & Africa (MEA) Quantum Computing Market Analysis and Forecast
13.1. Regional Outlook
13.2. Quantum Computing Market Size (US$ Mn) Analysis and Forecast (2018 - 2031)
13.2.1. By Component
13.2.2. By Application
13.2.3. By End-use Industry
13.3. Quantum Computing Market Size (US$ Mn) Forecast, by Country & Sub-region, 2018 - 2031
13.3.1. Saudi Arabia
13.3.2. The United Arab Emirates
13.3.3. South Africa
13.3.4. Rest of Middle East & Africa (MEA)
14. South America Quantum Computing Market Analysis and Forecast
14.1. Regional Outlook
14.2. Quantum Computing Market Size (US$ Mn) Analysis and Forecast (2018 - 2031)
14.2.1. By Component
14.2.2. By Application
14.2.3. By End-use Industry
14.3. Quantum Computing Market Size (US$ Mn) Forecast, by Country & Sub-region, 2018 - 2031
14.3.1. Brazil
14.3.2. Argentina
14.3.3. Rest of South America
15. Competition Landscape
15.1. Market Competition Matrix, by Leading Players
15.2. Market Revenue Share Analysis (%), by Leading Players (2020)
16. Company Profiles
16.1. 1qb Information Technologies, Inc.
16.1.1. Business Overview
16.1.2. Product Portfolio
16.1.3. Geographical Footprint
16.1.4. Revenue and Strategy
16.2. Accenture
16.2.1. Business Overview
16.2.2. Product Portfolio
16.2.3. Geographical Footprint
16.2.4. Revenue and Strategy
16.3. Atos SE
16.3.1. Business Overview
16.3.2. Product Portfolio
16.3.3. Geographical Footprint
16.3.4. Revenue and Strategy
16.4. Cambridge Quantum Computing Ltd.
16.4.1. Business Overview
16.4.2. Product Portfolio
16.4.3. Geographical Footprint
16.4.4. Revenue and Strategy
16.5. D-Wave Systems, Inc.
16.5.1. Business Overview
16.5.2. Product Portfolio
16.5.3. Geographical Footprint
16.5.4. Revenue and Strategy
16.6. Fujitsu
16.6.1. Business Overview
16.6.2. Product Portfolio
16.6.3. Geographical Footprint
16.6.4. Revenue and Strategy
16.7. Hewlett Packard Enterprise (HP)
16.7.1. Business Overview
16.7.2. Product Portfolio
16.7.3. Geographical Footprint
16.7.4. Revenue and Strategy
16.8. Hitachi Ltd.
16.8.1. Business Overview
16.8.2. Product Portfolio
16.8.3. Geographical Footprint
16.8.4. Revenue and Strategy
16.9. Honeywell, Inc.
16.9.1. Business Overview
16.9.2. Product Portfolio
16.9.3. Geographical Footprint
16.9.4. Revenue and Strategy
16.10. IBM Corporation
16.10.1. Business Overview
16.10.2. Product Portfolio
16.10.3. Geographical Footprint
16.10.4. Revenue and Strategy
16.11. Intel Corporation
16.11.1. Business Overview
16.11.2. Product Portfolio
16.11.3. Geographical Footprint
16.11.4. Revenue and Strategy
16.12. Magiq Technologies Inc.
16.12.1. Business Overview
16.12.2. Product Portfolio
16.12.3. Geographical Footprint
16.12.4. Revenue and Strategy
16.13. QC Ware Corp.
16.13.1. Business Overview
16.13.2. Product Portfolio
16.13.3. Geographical Footprint
16.13.4. Revenue and Strategy
16.14. Quantum Circuits, Inc.
16.14.1. Business Overview
16.14.2. Product Portfolio
16.14.3. Geographical Footprint
16.14.4. Revenue and Strategy
16.15. Qxbranch, LLC
16.15.1. Business Overview
16.15.2. Product Portfolio
16.15.3. Geographical Footprint
16.15.4. Revenue and Strategy
16.16. Google Research
16.16.1. Business Overview
16.16.2. Product Portfolio
16.16.3. Geographical Footprint
16.16.4. Revenue and Strategy
16.17. Rigetti Computing
16.17.1. Business Overview
16.17.2. Product Portfolio
16.17.3. Geographical Footprint
16.17.4. Revenue and Strategy
16.18. River Lane Research
16.18.1. Business Overview
16.18.2. Product Portfolio
16.18.3. Geographical Footprint
16.18.4. Revenue and Strategy
16.19. Station Q – Microsoft Corporation
16.19.1. Business Overview
16.19.2. Product Portfolio
16.19.3. Geographical Footprint
16.19.4. Revenue and Strategy
16.20. Toshiba Corporation
16.20.1. Business Overview
16.20.2. Product Portfolio
16.20.3. Geographical Footprint
16.20.4. Revenue and Strategy
17. Key Takeaways
List of Tables
Table 1: Acronyms Used in Quantum Computing Market
Table 2: North America Quantum Computing Market Revenue Analysis, by Country, 2021 - 2031 (US$ Mn)
Table 3: Europe Quantum Computing Market Revenue Analysis, by Country, 2021 - 2031 (US$ Mn)
Table 4: Asia Pacific Quantum Computing Market Revenue Analysis, by Country, 2021 - 2031 (US$ Mn)
Table 5: Middle East & Africa Quantum Computing Market Revenue Analysis, by Country, 2021 and 2031 (US$ Mn)
Table 6: South America Quantum Computing Market Revenue Analysis, by Country, 2021 - 2031 (US$ Mn)
Table 7: Forecast Factors Relevance and Impact (1/2)
Table 8: Forecast Factors Relevance and Impact (2/2)
Table 9: Impact Analysis of Drivers & Restraints
Table 10: Global Quantum Computing Market Value (US$ Mn) Forecast, by Component, 2018 – 2031
Table 11: Global Quantum Computing Market Value (US$ Mn) Forecast, by Application, 2018 – 2031
Table 12: Global Quantum Computing Market Value (US$ Mn) Forecast, by End-use Industry, 2018 – 2031
Table 13: Global Quantum Computing Market Volume (US$ Mn) Forecast, by Region, 2018 – 2031
Table 14: North America Quantum Computing Market Value (US$ Mn) Forecast, by Component, 2018 – 2031
Table 15: North America Quantum Computing Market Value (US$ Mn) Forecast, by Application, 2018 – 2031
Table 16: North America Quantum Computing Market Value (US$ Mn) Forecast, by End-use Industry, 2018 – 2031
Table 17: North America Quantum Computing Market Volume (US$ Mn) Forecast, by Country, 2018 – 2031
Table 18: U.S. Quantum Computing Market Revenue CAGR Breakdown (%), by Growth Term
Table 19: Canada Quantum Computing Market Revenue CAGR Breakdown (%), by Growth Term
Table 20: Mexico Quantum Computing Market Revenue CAGR Breakdown (%), by Growth Term
Table 21: Europe Quantum Computing Market Value (US$ Mn) Forecast, by Component, 2018 – 2031
Table 22: Europe Quantum Computing Market Value (US$ Mn) Forecast, by Application, 2018 – 2031
Table 23: Europe Quantum Computing Market Value (US$ Mn) Forecast, by End-use Industry, 2018 – 2031
Table 24: Europe Quantum Computing Market Volume (US$ Mn) Forecast, by Country, 2018 – 2031
Table 25: Germany Quantum Computing Market Revenue CAGR Breakdown (%), by Growth Term
Table 26: U.K. Quantum Computing Market Revenue CAGR Breakdown (%), by Growth Term
Table 27: France Quantum Computing Market Revenue CAGR Breakdown (%), by Growth Term
Table 28: Spain Quantum Computing Market Revenue CAGR Breakdown (%), by Growth Term
Table 29: Italy Quantum Computing Market Revenue CAGR Breakdown (%), by Growth Term
Table 30: Asia Pacific Quantum Computing Market Value (US$ Mn) Forecast, by Component, 2018 – 2031
Table 31: Asia Pacific Quantum Computing Market Value (US$ Mn) Forecast, by Application, 2018 – 2031
Table 32: Asia Pacific Quantum Computing Market Value (US$ Mn) Forecast, by End-use Industry, 2018 – 2031
Table 33: Asia Pacific Quantum Computing Market Volume (US$ Mn) Forecast, by Country, 2018 – 2031
Table 34: China Quantum Computing Market Revenue CAGR Breakdown (%), by Growth Term
Table 35: India Quantum Computing Market Revenue CAGR Breakdown (%), by Growth Term
Table 36: Japan Quantum Computing Market Revenue CAGR Breakdown (%), by Growth Term
Table 37: ASEAN Quantum Computing Market Revenue CAGR Breakdown (%), by Growth Term
Table 38: Middle East & Africa Quantum Computing Market Value (US$ Mn) Forecast, by Component, 2018 – 2031
Table 39: Middle East & Africa Quantum Computing Market Value (US$ Mn) Forecast, by Application, 2018 – 2031
Table 40: Middle East & Africa Quantum Computing Market Value (US$ Mn) Forecast, by End-use Industry, 2018 – 2031
Table 41: Middle East & Africa Quantum Computing Market Volume (US$ Mn) Forecast, by Country, 2018 – 2031
Table 42: Saudi Arabia Quantum Computing Market Revenue CAGR Breakdown (%), by Growth Term
Table 43: The United Arab Emirates Quantum Computing Market Revenue CAGR Breakdown (%), by Growth Term
Table 44: South Africa Quantum Computing Market Revenue CAGR Breakdown (%), by Growth Term
Table 45: South America Quantum Computing Market Value (US$ Mn) Forecast, by Component, 2018 – 2031
Table 46: South America Quantum Computing Market Value (US$ Mn) Forecast, by Application, 2018 – 2031
Table 47: South America Quantum Computing Market Value (US$ Mn) Forecast, by End-use Industry, 2018 – 2031
Table 48: South America Quantum Computing Market Volume (US$ Mn) Forecast, by Country, 2018 – 2031
Table 49: Brazil Emirates Quantum Computing Market Revenue CAGR Breakdown (%), by Growth Term
Table 50: Argentina Quantum Computing Market Revenue CAGR Breakdown (%), by Growth Term
Table 51: 1Qb Information Technologies Inc. Product Portfolio
Table 52: Accenture plc Product Portfolio
Table 53: Atos SE Product Portfolio
Table 54: Cambridge Quantum Computing Ltd Product Portfolio
Table 55: D-Wave Systems Inc. Product Portfolio
Table 56: Fujitsu Product Portfolio
Table 57: Hewlett Packard Enterprise Product Portfolio
Table 58: Hitachi Ltd. Product Portfolio
Table 59: Honeywell Inc. Product Portfolio
Table 60: IBM Corporation Product Portfolio
Table 61: Intel Corporation Product Portfolio
Table 62: MagiQ Technologies Inc. Product Portfolio
Table 63: QC Ware Corp. Product Portfolio
Table 64: Quantum Circuits, Inc. Product Portfolio
Table 65: Qxbranch, LLC Product Portfolio
Table 66: Google Research Product Portfolio
Table 67: Rigetti Computing Product Portfolio
Table 68: Riverlane Research Product Portfolio
Table 69: Station Q - Microsoft Corporation Product Portfolio
Table 70: Toshiba Corporation Product Portfolio
List of Figures
Figure 1: Global Quantum Computing Market Size (US$ Mn) Forecast, 2018–2031
Figure 2: Global Quantum Computing Market Revenue (US$ Mn) Opportunity Assessment, by Region, 2021E
Figure 3: Top Segment Analysis of Quantum Computing Market
Figure 4: Global Quantum Computing Market Revenue (US$ Mn) Opportunity Assessment, by Region, 2031F
Figure 5: Global Quantum Computing Market Attractiveness Assessment, by Component
Figure 6: Global Quantum Computing Market Attractiveness Assessment, by Application
Figure 7: Global Quantum Computing Market Attractiveness Assessment, by End-use Industry
Figure 8: Global Quantum Computing Market Attractiveness Assessment, by Region
Figure 9: Global Quantum Computing Market, by Component, CAGR (%) (2020 – 2030)
Figure 10: Global Quantum Computing Market, by Application, CAGR (%) (2020 – 2030)
Figure 11: Global Quantum Computing Market, by End-use Industry, CAGR (%) (2020 – 2030)
Figure 12: Global Quantum Computing Market, by Region, CAGR (%) (2020 – 2030)
Figure 13: Global Quantum Computing Market Revenue (US$ Mn) Historic Trends, 2016 - 2020
Figure 14: Global Quantum Computing Market Revenue Opportunity (US$ Mn) Historic Trends, 2016 - 2020
Figure 15: Global Quantum Computing Market Value Share Analysis, by Component, 2021
Figure 16: Global Quantum Computing Market Value Share Analysis, by Component, 2031
Figure 17: Global Quantum Computing Market Absolute Opportunity (US$ Mn), by Hardware, 2021 – 2031
Figure 18: Global Quantum Computing Market Absolute Opportunity (US$ Mn), by Software, 2021 – 2031
Figure 19: Global Quantum Computing Market Absolute Opportunity (US$ Mn), by Services, 2021 – 2031
Figure 20: Global Quantum Computing Market Value Share Analysis, by Application, 2021
Figure 21: Global Quantum Computing Market Value Share Analysis, by Application, 2031
Figure 22: Global Quantum Computing Market Absolute Opportunity (US$ Mn), by Optimization, 2021 – 2031
Figure 23: Global Quantum Computing Market Absolute Opportunity (US$ Mn), by Machine Learning, 2021 – 2031
Figure 24: Global Quantum Computing Market Absolute Opportunity (US$ Mn), by Material Simulation, 2021 – 2031
Figure 25: Global Quantum Computing Market Value Share Analysis, by End use Industry, 2021
Figure 26: Global Quantum Computing Market Value Share Analysis, by End use Industry, 2031
Figure 27: Global Quantum Computing Market Absolute Opportunity (US$ Mn), by Aerospace & Defense, 2021 – 2031
Figure 28: Global Quantum Computing Market Absolute Opportunity (US$ Mn), by Automotive, 2021 – 2031
Figure 29: Global Quantum Computing Market Absolute Opportunity (US$ Mn), by BFSI, 2021 – 2031
Figure 30: Global Quantum Computing Market Absolute Opportunity (US$ Mn), by Healthcare, 2021 – 2031
Figure 31: Global Quantum Computing Market Absolute Opportunity (US$ Mn), by Chemicals, 2021 – 2031
Figure 32: Global Quantum Computing Market Absolute Opportunity (US$ Mn), by Manufacturing, 2021 – 2031
Figure 33: Global Quantum Computing Market Absolute Opportunity (US$ Mn), by Energy & Power, 2021 – 2031
Figure 34: Global Quantum Computing Market Absolute Opportunity (US$ Mn), by Others, 2021 – 2031
Figure 35: Global Quantum Computing Market Opportunity (US$ Mn), by Region
Figure 36: Global Quantum Computing Market Opportunity Share (%), by Region, 2021–2031
Figure 37: Global Quantum Computing Market Size (US$ Mn), by Region, 2021 & 2031
Figure 38: Global Quantum Computing Market Value Share Analysis, by Region, 2021
Figure 39: Global Quantum Computing Market Value Share Analysis, by Region, 2031
Figure 40: North America Quantum Computing Market Absolute Opportunity (US$ Mn), 2021 – 2031
Figure 41: Europe Quantum Computing Market Absolute Opportunity (US$ Mn), 2021 – 2031
Figure 42: Asia Pacific Quantum Computing Market Absolute Opportunity (US$ Mn), 2021 – 2031
Figure 43: Middle East & Africa Quantum Computing Market Absolute Opportunity (US$ Mn), 2021 – 2031
Figure 44: South America Quantum Computing Market Absolute Opportunity (US$ Mn), 2021 – 2031
Figure 45: North America Quantum Computing Revenue Opportunity Share, by Application
Figure 46: North America Quantum Computing Revenue Opportunity Share, by Country
Figure 47: North America Quantum Computing Revenue Opportunity Share, by Component
Figure 48: North America Quantum Computing Revenue Opportunity Share, by End-use Industry
Figure 49: North America Quantum Computing Market Value Share Analysis, by Component, 2021
Figure 50: North America Quantum Computing Market Value Share Analysis, by Component, 2031
Figure 51: North America Quantum Computing Market Absolute Opportunity (US$ Mn), by Hardware, 2021 – 2031
Figure 52: North America Quantum Computing Market Absolute Opportunity (US$ Mn), by Software, 2021 – 2031
Figure 53: North America Quantum Computing Market Absolute Opportunity (US$ Mn), by Services, 2021 – 2031
Figure 54: North America Quantum Computing Market Value Share Analysis, by Application, 2021
Figure 55: North America Quantum Computing Market Value Share Analysis, by Application, 2031
Figure 56: North America Quantum Computing Market Absolute Opportunity (US$ Mn), by Optimization, 2021 – 2031
Figure 57: North America Quantum Computing Market Absolute Opportunity (US$ Mn), by Machine Learning, 2021 – 2031
Figure 58: North America Quantum Computing Market Absolute Opportunity (US$ Mn), by Material Simulation, 2021 – 2031
Figure 59: North America Quantum Computing Market Value Share Analysis, by End use Industry, 2021
Figure 60: North America Quantum Computing Market Value Share Analysis, by End use Industry, 2031
Figure 61: North America Quantum Computing Market Absolute Opportunity (US$ Mn), by Aerospace & Defense, 2021 – 2031
Figure 62: North America Quantum Computing Market Absolute Opportunity (US$ Mn), by Automotive, 2021 – 2031
Figure 63: North America Quantum Computing Market Absolute Opportunity (US$ Mn), by BFSI, 2021 – 2031
Figure 64: North America Quantum Computing Market Absolute Opportunity (US$ Mn), by Healthcare, 2021 – 2031
Figure 65: North America Quantum Computing Market Absolute Opportunity (US$ Mn), by Chemicals, 2021 – 2031
Figure 66: North America Quantum Computing Market Absolute Opportunity (US$ Mn), by Manufacturing, 2021 – 2031
Figure 67: North America Quantum Computing Market Absolute Opportunity (US$ Mn), by Energy & Power, 2021 – 2031
Figure 68: North America Quantum Computing Market Absolute Opportunity (US$ Mn), by Others, 2021 – 2031
Figure 69: North America Quantum Computing Market Value Share Analysis, by Country, 2021
Figure 70: North America Quantum Computing Market Value Share Analysis, by Country, 2031
Figure 71: North America Quantum Computing Market Absolute Opportunity (US$ Mn), by U.S. 2021 – 2031
Figure 72: North America Quantum Computing Market Absolute Opportunity (US$ Mn), by Canada 2021 – 2031
Figure 73: North America Quantum Computing Market Absolute Opportunity (US$ Mn), by Mexico 2021 – 2031
Figure 74: U.S. Quantum Computing Market Opportunity Growth Analysis (US$ Mn) Forecast, 2021 – 2031
Figure 75: Canada Quantum Computing Market Opportunity Growth Analysis (US$ Mn) Forecast, 2021 – 2031
Figure 76: Mexico Quantum Computing Market Opportunity Growth Analysis (US$ Mn) Forecast, 2021 – 2031
Figure 77: Europe Quantum Computing Revenue Opportunity Share, by Application
Figure 78: Europe Quantum Computing Revenue Opportunity Share, by Country
Figure 79: Europe Quantum Computing Revenue Opportunity Share, by Component
Figure 80: Europe Quantum Computing Revenue Opportunity Share, by End-use Industry
Figure 81: Europe Quantum Computing Market Value Share Analysis, by Component, 2021
Figure 82: Europe Quantum Computing Market Value Share Analysis, by Component, 2031
Figure 83: Europe Quantum Computing Market Absolute Opportunity (US$ Mn), by Hardware, 2021 – 2031
Figure 84: Europe Quantum Computing Market Absolute Opportunity (US$ Mn), by Software, 2021 – 2031
Figure 85: Europe Quantum Computing Market Absolute Opportunity (US$ Mn), by Services, 2021 – 2031
Figure 86: Europe Quantum Computing Market Value Share Analysis, by Application, 2021
Figure 87: Europe Quantum Computing Market Value Share Analysis, by Application, 2031
Figure 88: Europe Quantum Computing Market Absolute Opportunity (US$ Mn), by Optimization, 2021 – 2031
Figure 89: Europe Quantum Computing Market Absolute Opportunity (US$ Mn), by Machine Learning, 2021 – 2031
Figure 90: Europe Quantum Computing Market Absolute Opportunity (US$ Mn), by Material Simulation, 2021 – 2031
Figure 91: Europe Quantum Computing Market Value Share Analysis, by End use Industry, 2021
Figure 92: Europe Quantum Computing Market Value Share Analysis, by End use Industry, 2031
Figure 93: Europe Quantum Computing Market Absolute Opportunity (US$ Mn), by Aerospace & Defense, 2021 – 2031
Figure 94: Europe Quantum Computing Market Absolute Opportunity (US$ Mn), by Automotive, 2021 – 2031
Figure 95: Europe Quantum Computing Market Absolute Opportunity (US$ Mn), by BFSI, 2021 – 2031
Figure 96: Europe Quantum Computing Market Absolute Opportunity (US$ Mn), by Healthcare, 2021 – 2031
Figure 97: Europe Quantum Computing Market Absolute Opportunity (US$ Mn), by Chemicals, 2021 – 2031
Figure 98: Europe Quantum Computing Market Absolute Opportunity (US$ Mn), by Manufacturing, 2021 – 2031
Figure 99: Europe Quantum Computing Market Absolute Opportunity (US$ Mn), by Energy & Power, 2021 – 2031
Figure 100: Europe Quantum Computing Market Absolute Opportunity (US$ Mn), by Others, 2021 – 2031
Figure 101: Europe Quantum Computing Market Value Share Analysis, by Country, 2021
Figure 102: Europe Quantum Computing Market Value Share Analysis, by Country, 2031
Figure 103: Europe Quantum Computing Market Absolute Opportunity (US$ Mn), by Germany. 2021 – 2031
Figure 104: Europe Quantum Computing Market Absolute Opportunity (US$ Mn), by U.K. 2021 – 2031
Figure 105: Europe Quantum Computing Market Absolute Opportunity (US$ Mn), by France. 2021 – 2031
Figure 106: Europe Quantum Computing Market Absolute Opportunity (US$ Mn), by Spain. 2021 – 2031
Figure 107: Europe Quantum Computing Market Absolute Opportunity (US$ Mn), by Italy 2021 – 2031
Figure 108: Germany Quantum Computing Market Opportunity Growth Analysis (US$ Mn) Forecast, 2021 – 2031
Figure 109: U.K. Quantum Computing Market Opportunity Growth Analysis (US$ Mn) Forecast, 2021 – 2031
Figure 110: France Quantum Computing Market Opportunity Growth Analysis (US$ Mn) Forecast, 2021 – 2031
Figure 111: Spain Quantum Computing Market Opportunity Growth Analysis (US$ Mn) Forecast, 2021 – 2031
Figure 112: Italy Quantum Computing Market Opportunity Growth Analysis (US$ Mn) Forecast, 2021 – 2031
Figure 113: Asia Pacific Quantum Computing Revenue Opportunity Share, by Application
Figure 114: Asia Pacific Quantum Computing Revenue Opportunity Share, by Country
Figure 115: Asia Pacific Quantum Computing Revenue Opportunity Share, by Component
Figure 116: Asia Pacific Quantum Computing Revenue Opportunity Share, by End-use Industry
Figure 117: Asia Pacific Quantum Computing Market Value Share Analysis, by Component, 2021
Figure 118: Asia Pacific Quantum Computing Market Value Share Analysis, by Component, 2031
Figure 119: Asia Pacific Quantum Computing Market Absolute Opportunity (US$ Mn), by Hardware, 2021 – 2031
Figure 120: Asia Pacific Quantum Computing Market Absolute Opportunity (US$ Mn), by Software, 2021 – 2031
Figure 121: Asia Pacific Quantum Computing Market Absolute Opportunity (US$ Mn), by Services, 2021 – 2031
Figure 122: Asia Pacific Quantum Computing Market Value Share Analysis, by Application, 2021
Figure 123: Asia Pacific Quantum Computing Market Value Share Analysis, by Application, 2031
Figure 124: Asia Pacific Quantum Computing Market Absolute Opportunity (US$ Mn), by Optimization, 2021 – 2031
Figure 125: Asia Pacific Quantum Computing Market Absolute Opportunity (US$ Mn), by Machine Learning, 2021 – 2031
Figure 126: Asia Pacific Quantum Computing Market Absolute Opportunity (US$ Mn), by Material Simulation, 2021 – 2031
Figure 127: Asia Pacific Quantum Computing Market Value Share Analysis, by End use Industry, 2021
Figure 128: Asia Pacific Quantum Computing Market Value Share Analysis, by End use Industry, 2031
Figure 129: Asia Pacific Quantum Computing Market Absolute Opportunity (US$ Mn), by Aerospace & Defense, 2021 – 2031
Figure 130: Asia Pacific Quantum Computing Market Absolute Opportunity (US$ Mn), by Automotive, 2021 – 2031
Figure 131: Asia Pacific Quantum Computing Market Absolute Opportunity (US$ Mn), by BFSI, 2021 – 2031
Figure 132: Asia Pacific Quantum Computing Market Absolute Opportunity (US$ Mn), by Healthcare, 2021 – 2031
Figure 133: Asia Pacific Quantum Computing Market Absolute Opportunity (US$ Mn), by Chemicals, 2021 – 2031
Figure 134: Asia Pacific Quantum Computing Market Absolute Opportunity (US$ Mn), by Manufacturing, 2021 – 2031
Figure 135: Asia Pacific Quantum Computing Market Absolute Opportunity (US$ Mn), by Energy & Power, 2021 – 2031
Figure 136: Asia Pacific Quantum Computing Market Absolute Opportunity (US$ Mn), by Others, 2021 – 2031
Figure 137: Asia Pacific Quantum Computing Market Value Share Analysis, by Country, 2021
Figure 138: Asia Pacific Quantum Computing Market Value Share Analysis, by Country, 2031
Figure 139: Asia Pacific Quantum Computing Market Absolute Opportunity (US$ Mn), by China. 2021 – 2031
Figure 140: Asia Pacific Quantum Computing Market Absolute Opportunity (US$ Mn), by India. 2021 – 2031
Figure 141: Asia Pacific Quantum Computing Market Absolute Opportunity (US$ Mn), by Japan. 2021 – 2031
Figure 142: Asia Pacific Quantum Computing Market Absolute Opportunity (US$ Mn), by ASEAN. 2021 – 2031
Figure 143: China Quantum Computing Market Opportunity Growth Analysis (US$ Mn) Forecast, 2021 – 2031
Figure 144: India Quantum Computing Market Opportunity Growth Analysis (US$ Mn) Forecast, 2021 – 2031
Figure 145: Japan Quantum Computing Market Opportunity Growth Analysis (US$ Mn) Forecast, 2021 – 2031
Figure 146: ASEAN Quantum Computing Market Opportunity Growth Analysis (US$ Mn) Forecast, 2021 – 2031
Figure 147: Middle East & Africa Quantum Computing Revenue Opportunity Share, by Application
Figure 148: Middle East & Africa Quantum Computing Revenue Opportunity Share, by Country
Figure 149: Middle East & Africa Quantum Computing Revenue Opportunity Share, by Component
Figure 150: Middle East & Africa Quantum Computing Revenue Opportunity Share, by End-use Industry
Figure 151: Middle East & Africa Quantum Computing Market Value Share Analysis, by Component, 2021
Figure 152: Middle East & Africa Quantum Computing Market Value Share Analysis, by Component, 2031
Figure 153: Middle East & Africa Quantum Computing Market Absolute Opportunity (US$ Mn), by Hardware, 2021 – 2031
Figure 154: Middle East & Africa Quantum Computing Market Absolute Opportunity (US$ Mn), by Software, 2021 – 2031
Figure 155: Middle East & Africa Quantum Computing Market Absolute Opportunity (US$ Mn), by Services, 2021 – 2031
Figure 156: Middle East & Africa Quantum Computing Market Value Share Analysis, by Application, 2021
Figure 157: Middle East & Africa Quantum Computing Market Value Share Analysis, by Application, 2031
Figure 158: Middle East & Africa Quantum Computing Market Absolute Opportunity (US$ Mn), by Optimization, 2021 – 2031
Figure 159: Middle East & Africa Quantum Computing Market Absolute Opportunity (US$ Mn), by Machine Learning, 2021 – 2031
Figure 160: Middle East & Africa Quantum Computing Market Absolute Opportunity (US$ Mn), by Material Simulation, 2021 – 2031
Figure 161: Middle East & Africa Quantum Computing Market Value Share Analysis, by End use Industry, 2021
Figure 162: Middle East & Africa Quantum Computing Market Value Share Analysis, by End use Industry, 2031
Figure 163: Middle East & Africa Quantum Computing Market Absolute Opportunity (US$ Mn), by Aerospace & Defense, 2021 – 2031
Figure 164: Middle East & Africa Quantum Computing Market Absolute Opportunity (US$ Mn), by Automotive, 2021 – 2031
Figure 165: Middle East & Africa Quantum Computing Market Absolute Opportunity (US$ Mn), by BFSI, 2021 – 2031
Figure 166: Middle East & Africa Quantum Computing Market Absolute Opportunity (US$ Mn), by Healthcare, 2021 – 2031
Figure 167: Middle East & Africa Quantum Computing Market Absolute Opportunity (US$ Mn), by Chemicals, 2021 – 2031
Figure 168: Middle East & Africa Quantum Computing Market Absolute Opportunity (US$ Mn), by Manufacturing, 2021 – 2031
Figure 169: Middle East & Africa Quantum Computing Market Absolute Opportunity (US$ Mn), by Energy & Power, 2021 – 2031
Figure 170: Middle East & Africa Quantum Computing Market Absolute Opportunity (US$ Mn), by Others, 2021 – 2031
Figure 171: Middle East & Africa Quantum Computing Market Value Share Analysis, by Country, 2021
Figure 172: Middle East & Africa Quantum Computing Market Value Share Analysis, by Country, 2031
Figure 173: Middle East & Africa Quantum Computing Market Absolute Opportunity (US$ Mn), by Saudi Arabia. 2021 – 2031
Figure 174: Middle East & Africa Quantum Computing Market Absolute Opportunity (US$ Mn), by The United Arab Emirates. 2021 – 2031
Figure 175: Middle East & Africa Quantum Computing Market Absolute Opportunity (US$ Mn), by South Africa2021 – 2031
Figure 176: Saudi Arabia Quantum Computing Market Opportunity Growth Analysis (US$ Mn) Forecast, 2021 – 2031
Figure 177: The United Arab Emirates Quantum Computing Market Opportunity Growth Analysis (US$ Mn) Forecast, 2021 – 2031
Figure 178: South Africa Quantum Computing Market Opportunity Growth Analysis (US$ Mn) Forecast, 2021 – 2031
Figure 179: South America Quantum Computing Revenue Opportunity Share, by Application
Figure 180: South America Quantum Computing Revenue Opportunity Share, by Country
Figure 181: South America Quantum Computing Revenue Opportunity Share, by Component
Figure 182: South America Quantum Computing Revenue Opportunity Share, by End-use Industry
Figure 183: South America Quantum Computing Market Value Share Analysis, by Component, 2021
Figure 184: South America Quantum Computing Market Value Share Analysis, by Component, 2031
Figure 185: South America Quantum Computing Market Absolute Opportunity (US$ Mn), by Hardware, 2021 – 2031
Figure 186: South America Quantum Computing Market Absolute Opportunity (US$ Mn), by Software, 2021 – 2031
Figure 187: South America Quantum Computing Market Absolute Opportunity (US$ Mn), by Services, 2021 – 2031
Figure 188: South America Quantum Computing Market Value Share Analysis, by Application, 2021
Figure 189: South America Quantum Computing Market Value Share Analysis, by Application, 2031
Figure 190: South America Quantum Computing Market Absolute Opportunity (US$ Mn), by Optimization, 2021 – 2031
Figure 191: South America Quantum Computing Market Absolute Opportunity (US$ Mn), by Machine Learning, 2021 – 2031
Figure 192: South America Quantum Computing Market Absolute Opportunity (US$ Mn), by Material Simulation, 2021 – 2031
Figure 193: South America Quantum Computing Market Value Share Analysis, by End use Industry, 2021
Figure 194: South America Quantum Computing Market Value Share Analysis, by End use Industry, 2031
Figure 195: South America Quantum Computing Market Absolute Opportunity (US$ Mn), by Aerospace & Defense, 2021 – 2031
Figure 196: South America Quantum Computing Market Absolute Opportunity (US$ Mn), by Automotive, 2021 – 2031
Figure 197: South America Quantum Computing Market Absolute Opportunity (US$ Mn), by BFSI, 2021 – 2031
Figure 198: South America Quantum Computing Market Absolute Opportunity (US$ Mn), by Healthcare, 2021 – 2031
Figure 199: South America Quantum Computing Market Absolute Opportunity (US$ Mn), by Chemicals, 2021 – 2031
Figure 200: South America Quantum Computing Market Absolute Opportunity (US$ Mn), by Manufacturing, 2021 – 2031
Figure 201: South America Quantum Computing Market Absolute Opportunity (US$ Mn), by Energy & Power, 2021 – 2031
Figure 202: South America Quantum Computing Market Absolute Opportunity (US$ Mn), by Others, 2021 – 2031
Figure 203: South America Quantum Computing Market Value Share Analysis, by Country, 2021
Figure 204: South America Quantum Computing Market Value Share Analysis, by Country, 2031
Figure 205: South America Quantum Computing Market Absolute Opportunity (US$ Mn), by Brazil. 2021 – 2031
Figure 206: South America Quantum Computing Market Absolute Opportunity (US$ Mn), by Argentina. 2021 – 2031
Figure 207: Brazil Quantum Computing Market Opportunity Growth Analysis (US$ Mn) Forecast, 2021 – 2031
Figure 208: Argentina Quantum Computing Market Opportunity Growth Analysis (US$ Mn) Forecast, 2021 – 2031
Copyright © Transparency Market Research, Inc. All Rights reserved
Trust Online

Quantum Computing Market Growth, Forecast 2021-2031
