The global Product Lifecycle Management Consumer Packaged Goods & Retail (PLM CP&R) market is projected to be driven by expansion in the consumer electronics industry. According to TMR analysis, the global consumer electronics industry has witnessed significant Y-o-Y growth at the rate of around 7% in 2017, in terms of revenue. The consumer electronics industry in Asia is expanding at a rapid pace. Rise in disposable income and increase in population are driving demand for consumer electronics. India had a population of 1,314 million in 2015, and it is anticipated to reach 1,530 million by 2030.
A rise in the population is expected to create opportunities for the personal and portable consumer electronics market. The expanding consumer electronics industry would need process automation, thus creating attractive opportunities for PLM solution providers.
Additionally, the use of PLM as a strategic enabler is revolutionary for companies. Most retail, footwear, and apparel companies have ‘revenue growth’ as their corporate strategic goal. It is achieved through continuous product innovations, for which, robust product development integrated with PLM is a must. Companies need to deploy strategies such as high stock keeping unit (SKU) counts and global collaboration to keep a pace with rapidly changing customer demands. However, these strategies can make innovative processes and systems appear like a barrier. PLM is used as a strategic enabler as it helps transform processes and people. It enables technology for driving digitalization in order to support businesses in achieving innovation-driven revenue growth through an innovative, cost-effective, and time saving product management process.
Expansion in the Product Lifecycle Management Consumer Packaged Goods & Retail (PLM CP&R) market is coupled with a rise in demand for product lifecycle management (PLM). The consumer packaged goods (CPG) and retail industries are increasingly seeking sophisticated technological innovations in key areas of their operations such as design, fabrication/manufacture, and merchandise pricing, with an aim to retain competitive advantage. This, in turn, is augmenting demand for PLM solutions.
Significant investment in the Asian food & beverage industry is creating lucrative market opportunities for PLM solution providers. Sales growth in the Asian food & beverage industry is expected to be rapid in the near future, aggregating to 8% to 9% by 2018. Retail sales in Asia are anticipated to rise to over US$ 10 Trn by 2018. The retail market in China is expected to contribute significantly to revenue share by 2018. This significant growth across Asia is likely to increase the need for digitization. Demand for digital processes such as product lifecycle management, process automation, and data analytics is estimated to increase. This, in turn, is projected to drive the PLM market from 2018 to 2026.
The global Product Lifecycle Management Consumer Packaged Goods & Retail (PLM CP&R) market has been segmented based on technology, deployment, industry, and region. In terms of technology, the global Product Lifecycle Management Consumer Packaged Goods & Retail (PLM CP&R) market has been classified into formula design and management, laboratory information management, artwork & labeling, CAD/CAM/CAE, simulation & test, PDM/cPDM/PLM, eCAD/EDA, application lifecycle management, digital manufacturing/plant simulation, MOM: MES, quality, advanced planning & scheduling, iOT (Consumer and Industrial), and RAD. Based on deployment, the global PLM CP&R market has been categorized into enterprise, cloud, and SaaS. In terms of industry, the global PLM CP&R market has been divided into consumer packaged goods, consumer goods, apparel, footwear & accessories, and retail.
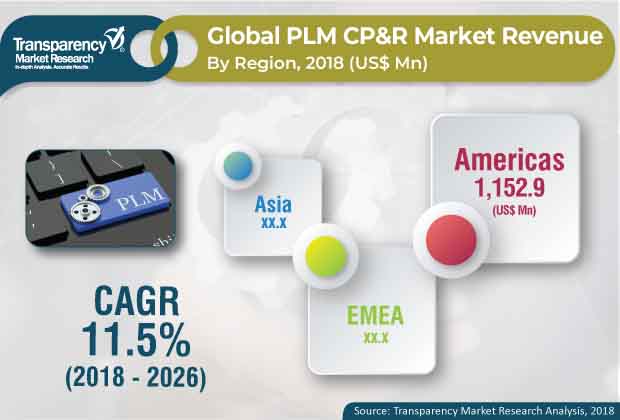
Based on region, the global Product Lifecycle Management Consumer Packaged Goods & Retail (PLM CP&R) market has been segmented into the Americas, Europe, Middle East & Africa (EMEA), and Asia. The report provides in-depth segment analysis of the global Product Lifecycle Management Consumer Packaged Goods & Retail (PLM CP&R) market, thereby providing valuable insights at the macro as well as micro levels.
In terms of region, the Americas is projected to lead the global PLM CP&R market during the forecast period. In the Americas, a revolutionary shift has been observed toward ‘Factory 4.0 or Digital Factory.’ The technology helps in reducing costs through process simplification, operations flexibility, accelerating process to process alterations, tracking products across the lifecycle, and quality improvement. It also enables better interaction and collaboration through constant information sharing. The region is expected to dominate the global Product Lifecycle Management Consumer Packaged Goods & Retail (PLM CP&R) market in the coming years. The market in Europe, Middle East & Africa is also expected to expand at a steady pace during the forecast period. The PLM CP&R market in Asia is anticipated to expand at a rapid rate. China is expected to be a prominent country of the Product Lifecycle Management Consumer Packaged Goods & Retail (PLM CP&R) market in Asia, followed by India. The presence of a large number of large and small scale enterprises in these countries is expected to boost the market. The market in Japan is expected to contribute significantly to revenue.
The global Product Lifecycle Management Consumer Packaged Goods & Retail (PLM CP&R) market is largely driven by the adoption of new technology across industries and the move toward automation. Key players profiled in the report include Accenture, IBM Corporation, Oracle Corporation, SAP S.E., Dassault Systems, Autodesk Inc., HP Inc. Dell, Cisco Systems, Inc., 10ZiG Technology, Acer Inc., and Advantech Co., Ltd.
1. Preface
1.1. Market Scope
1.2. Market Segmentation
1.3. Key Research Objectives
1.4. Research Highlights
2. Assumptions and Research Methodology
2.1. Market Taxonomy - Segment Definitions
2.2. Research Methodology
2.2.1. List of Primary and Secondary Sources
2.3. Key Assumptions for Data Modelling
3. Executive Summary: Global PLM CP&R (Software and Services) Market
4. Market Overview
4.1. Introduction
4.2. Global Market – Macro Economic Factors Overview
4.2.1. World GDP Indicator – For Top 20 Economies
4.2.2. Global ICT Spending (US$ Mn), 2012, 2018, 2026
4.2.3. Key Regional Socio-political-technological Developments and Their Impact Considerations
4.3. Technology/Product Roadmap
4.4. Market Factor Analysis
4.4.1. Porter’s Five Forces Analysis
4.4.2. PESTEL Analysis
4.4.3. Ecosystem Analysis
4.4.4. Market Dynamics (Growth Influencers)
4.4.4.1. Drivers
4.4.4.2. Restraints
4.4.4.3. Opportunities
4.4.4.4. Impact Analysis of Drivers & Restraints
4.5. Regulations and Policies
4.6. Key End-users of PLM CP&R (Software and Services) Market
4.7. Potential Customers of PLM CP&R (Software and Services) Market
4.8. Analysis of Total Addressable Market
4.9. Adoption of Global PLM CP&R (Software and Services) Market, by Industry
4.10. Global PLM CP&R (Software and Services) Market Analysis and Forecast, 2018 – 2026
4.10.1. Global PLM CP&R Market, Absolute Incremental Opportunity Analysis, 2016-2026
4.11. Market Opportunity Assessment
4.11.1. By Technology
4.11.2. By Deployment Type
4.11.3. By Industry
4.11.4. By Region
4.12. Competitive Scenario and Trends
4.12.1. PLM CP&R (Software and Services) Market Concentration Rate
4.12.1.1. List of Emerging and Prominent Vendors
4.12.2. Mergers & Acquisitions, Expansions
4.13. Market Outlook
5. Global PLM CP&R (Software and Services) Market Analysis and Forecast, by Technology
5.1. Overview and Definitions
5.2. Key Segment Analysis
5.3. PLM CP&R (Software and Services) Market Value (US$ Mn) Forecast, by Technology, 2016 - 2026
5.3.1. Formula Design and Management
5.3.2. Laboratory Information Management
5.3.3. Artwork & Labeling
5.3.4. CAD/CAM/CAE
5.3.5. Simulation & Test
5.3.6. PDM/cPDM/PLM
5.3.7. eCAD/EDA
5.3.8. Application Lifecycle Management
5.3.9. Digital Manufacturing/Plant Simulation
5.3.10. MOM: MES, Quality, Advanced Planning & Scheduling
5.3.11. iOT (Consumer and Industrial)
5.3.12. RAD
6. Global PLM CP&R (Software and Services) Market Analysis and Forecast, by Deployment Type
6.1. Overview and Definitions
6.2. Key Segment Analysis
6.3. PLM CP&R (Software and Services) Market Value (US$ Mn) Forecast, by Deployment Type, 2016 - 2026
6.3.1. Enterprise
6.3.2. Cloud
6.3.3. SaaS
7. Global PLM CP&R (Software and Services) Market Analysis and Forecast, by Industry
7.1. Overview
7.2. Key Segment Analysis
7.3. PLM CP&R (Software and Services) Market Value (US$ Mn) Forecast, by Industry, 2016 - 2026
7.3.1. Consumer Packaged Goods
7.3.1.1. Food and Beverage
7.3.1.2. Beauty
7.3.1.3. Home & Personal Care
7.3.1.4. Chemicals
7.3.2. Consumer Goods
7.3.2.1. Sporting Goods & Toys
7.3.2.2. Appliances & Tools
7.3.2.3. Home & Office Goods
7.3.2.4. Wearable Devices
7.3.3. Apparel, Footwear & Accessories
7.3.3.1. Footwear
7.3.3.2. Apparel
7.3.3.3. Accessories
7.3.4. Retail
8. Global PLM CP&R (Software and Services) Market Analysis and Forecast, by Region
8.1. Overview
8.2. Key Segment Analysis
8.3. PLM CP&R (Software and Services) Market Value (US$ Mn) Forecast, by Region, 2016 -2026
8.3.1. Americas
8.3.2. EMEA & Germany
8.3.3. Asia
9. Americas PLM CP&R (Software and Services) Market Analysis and Forecast
9.1. Key Findings
9.2. PLM CP&R (Software and Services) Market Value (US$ Mn) Forecast, by Technology, 2016 - 2026
9.2.1. Formula Design and Management
9.2.2. Laboratory Information Management
9.2.3. Artwork & Labeling
9.2.4. CAD/CAM/CAE
9.2.5. Simulation & Test
9.2.6. PDM/cPDM/PLM
9.2.7. eCAD/EDA
9.2.8. Application Lifecycle Management
9.2.9. Digital Manufacturing/Plant Simulation
9.2.10. MOM: MES, Quality, Advanced Planning & Scheduling
9.2.11. iOT (Consumer and Industrial)
9.2.12. RAD
9.3. PLM CP&R (Software and Services) Market Value (US$ Mn) Forecast, by Deployment Type, 2016 - 2026
9.3.1. Enterprise
9.3.2. Cloud
9.3.3. SaaS
9.4. PLM CP&R (Software and Services) Market Value (US$ Mn) Forecast, by Industry, 2016 - 2026
9.4.1. Consumer Packaged Goods
9.4.1.1. Food and Beverage
9.4.1.2. Beauty
9.4.1.3. Home & Personal Care
9.4.1.4. Chemicals
9.4.2. Consumer Goods
9.4.2.1. Sporting Goods & Toys
9.4.2.2. Appliances & Tools
9.4.2.3. Home & Office Goods
9.4.2.4. Wearable Devices
9.4.3. Apparel, Footwear & Accessories
9.4.3.1. Footwear
9.4.3.2. Apparel
9.4.3.3. Accessories
9.4.4. Retail
9.5. PLM CP&R (Software and Services) Market Value (US$ Mn) Forecast, by Country, 2016 - 2026
9.5.1. The U.S.
9.5.2. Canada
9.5.3. Rest of Americas
10. EMEA & Germany PLM CP&R (Software and Services) Market Analysis and Forecast
10.1. Key Findings
10.2. PLM CP&R (Software and Services) Market Value (US$ Mn) Forecast, by Technology, 2016 - 2026
10.2.1. Formula Design and Management
10.2.2. Laboratory Information Management
10.2.3. Artwork & Labeling
10.2.4. CAD/CAM/CAE
10.2.5. Simulation & Test
10.2.6. PDM/cPDM/PLM
10.2.7. eCAD/EDA
10.2.8. Application Lifecycle Management
10.2.9. Digital Manufacturing/Plant Simulation
10.2.10. MOM: MES, Quality, Advanced Planning & Scheduling
10.2.11. iOT (Consumer and Industrial)
10.2.12. RAD
10.3. PLM CP&R (Software and Services) Market Value (US$ Mn) Forecast, by Deployment Type, 2016 - 2026
10.3.1. Enterprise
10.3.2. Cloud
10.3.3. SaaS
10.4. PLM CP&R (Software and Services) Market Value (US$ Mn) Forecast, by Industry, 2016 - 2026
10.4.1. Consumer Packaged Goods
10.4.1.1. Food and Beverage
10.4.1.2. Beauty
10.4.1.3. Home & Personal Care
10.4.1.4. Chemicals
10.4.2. Consumer Goods
10.4.2.1. Sporting Goods & Toys
10.4.2.2. Appliances & Tools
10.4.2.3. Home & Office Goods
10.4.2.4. Wearable Devices
10.4.3. Apparel, Footwear & Accessories
10.4.3.1. Footwear
10.4.3.2. Apparel
10.4.3.3. Accessories
10.4.4. Retail
10.5. PLM CP&R (Software and Services) Market Value (US$ Mn) Forecast, by Country, 2016 - 2026
10.5.1. Germany
10.5.2. The U.K.
10.5.3. France
10.5.4. Italy
10.5.5. Rest of EMEA
11. Asia Pacific PLM CP&R (Software and Services) Market Analysis and Forecast
11.1. Key Findings
11.2. PLM CP&R (Software and Services) Market Value (US$ Mn) Forecast, by Technology, 2016 - 2026
11.2.1. Formula Design and Management
11.2.2. Laboratory Information Management
11.2.3. Artwork & Labeling
11.2.4. CAD/CAM/CAE
11.2.5. Simulation & Test
11.2.6. PDM/cPDM/PLM
11.2.7. eCAD/EDA
11.2.8. Application Lifecycle Management
11.2.9. Digital Manufacturing/Plant Simulation
11.2.10. MOM: MES, Quality, Advanced Planning & Scheduling
11.2.11. iOT (Consumer and Industrial)
11.2.12. RAD
11.3. PLM CP&R (Software and Services) Market Value (US$ Mn) Forecast, by Deployment Type, 2016 - 2026
11.3.1. Enterprise
11.3.2. Cloud
11.3.3. SaaS
11.4. PLM CP&R (Software and Services) Market Value (US$ Mn) Forecast, by Industry, 2016 - 2026
11.4.1. Consumer Packaged Goods
11.4.1.1. Food and Beverage
11.4.1.2. Beauty
11.4.1.3. Home & Personal Care
11.4.1.4. Chemicals
11.4.2. Consumer Goods
11.4.2.1. Sporting Goods & Toys
11.4.2.2. Appliances & Tools
11.4.2.3. Home & Office Goods
11.4.2.4. Wearable Devices
11.4.3. Apparel, Footwear & Accessories
11.4.3.1. Footwear
11.4.3.2. Apparel
11.4.3.3. Accessories
11.4.4. Retail
11.5. PLM CP&R (Software and Services) Market Value (US$ Mn) Forecast, by Country, 2016 - 2026
11.5.1. China
11.5.2. India
11.5.3. Japan
11.5.4. Australia & New Zealand
11.5.5. Thailand
11.5.6. Vietnam
11.5.7. South Korea
11.5.8. Rest of ASEAN
11.5.9. Rest of Asia
12. Competition Landscape
12.1. Market Player – Competition Matrix
12.2. Key Vendor Mapping
12.3. Market Revenue Share Assessment (%), by Company (2017)
12.4. Regional Presence (Intensity Map)
13. Company Profiles
13.1. Accenture
13.1.1. Overview
13.1.2. Key Competitors
13.1.3. Geographical Presence
13.1.4. Revenue
13.1.5. Strategy
13.2. IBM Corporation
13.2.1. Overview
13.2.2. Key Competitors
13.2.3. Geographical Presence
13.2.4. Revenue
13.2.5. Strategy
13.3. Oracle Corporation
13.3.1. Overview
13.3.2. Key Competitors
13.3.3. Geographical Presence
13.3.4. Revenue
13.3.5. Strategy
13.4. SAP S.E.
13.4.1. Overview
13.4.2. Key Competitors
13.4.3. Geographical Presence
13.4.4. Revenue
13.4.5. Strategy
13.5. Dassault Systems
13.5.1. Overview
13.5.2. Key Competitors
13.5.3. Geographical Presence
13.5.4. Revenue
13.5.5. Strategy
13.6. Autodesk Inc.
13.6.1. Overview
13.6.2. Key Competitors
13.6.3. Geographical Presence
13.6.4. Revenue
13.6.5. Strategy
13.7. HP Inc.
13.7.1. Overview
13.7.2. Key Competitors
13.7.3. Geographical Presence
13.7.4. Revenue
13.7.5. Strategy
13.8. Advantech Co., Ltd.
13.8.1. Overview
13.8.2. Key Competitors
13.8.3. Geographical Presence
13.8.4. Revenue
13.8.5. Strategy
13.9. Cisco Systems, Inc.
13.9.1. Overview
13.9.2. Key Competitors
13.9.3. Geographical Presence
13.9.4. Revenue
13.9.5. Strategy
13.10. Dell Technologies Inc.
13.10.1. Overview
13.10.2. Key Competitors
13.10.3. Geographical Presence
13.10.4. Revenue
13.10.5. Strategy
14. Key Takeaways
List of Tables
Table 1: North America ICT Spending (US$ Mn)
Table 2: Europe ICT Spending (US$ Mn)
Table 3: Asia Pacific ICT Spending (US$ Mn)
Table 4: MEA ICT Spending (US$ Mn)
Table 5: South America ICT Spending (US$ Mn)
Table 6: Key End Users
Table 7: Emerging and Prominent Vendors
Table 8: Key Alliances in the Global PLM Market
Table 9: Global CP&R PLM Market Size (US$ Mn), by Deployment
Table 10: Global CP&R PLM Market Size (US$ Mn), by Technology
Table 11: Global CP&R PLM Market Size (US$ Mn), by Industry
Table 12: Global CP&R PLM Market Services, by Region (US$ Mn)
Table 13: Global CP&R PLM Market Size (US$ Mn), by Deployment
Table 14: Global CP&R PLM Market Size (US$ Mn), by Region (US$ Mn)
Table 15: Americas CP&R PLM Market Size (US$ Mn), by Country
Table 16: Americas CP&R PLM Market Size (US$ Mn), by Technology
Table 17: Americas CP&R PLM Market Size (US$ Mn), by Industry
Table 18: Americas CP&R PLM Market Services, by Country
Table 19: Americas CP&R PLM Market Size (US$ Mn), by Enterprise Deployment
Table 20: Americas CP&R PLM Market Size (US$ Mn), by Cloud Deployment
Table 21: Americas CP&R PLM Market Size (US$ Mn), by SAAS Deployment
Table 22: The U.S. CP&R PLM Market Size (US$ Mn), by Technology
Table 23: The U.S. CP&R PLM Market Size (US$ Mn), by Industry
Table 24: Canada CP&R PLM Market Size (US$ Mn), by Technology
Table 25: Canada CP&R PLM Market Size (US$ Mn), by Industry
Table 26: Rest of Americas CP&R PLM Market Size (US$ Mn), by Technology
Table 27: Rest of Americas CP&R PLM Market Size (US$ Mn), by Industry
Table 28: EMEA CP&R PLM Market Size (US$ Mn), by Country
Table 29: EMEA CP&R PLM Market Size (US$ Mn), by Technology
Table 30: EMEA CP&R PLM Market Size (US$ Mn), by Industry
Table 31: EMEA CP&R PLM Market Services, by Country
Table 32: EMEA CP&R PLM Market Size (US$ Mn), by Enterprise Deployment
Table 33: EMEA CP&R PLM Market Size (US$ Mn), by Cloud Deployment
Table 34: EMEA CP&R PLM Market Size (US$ Mn), by SAAS Deployment
Table 35: Germany CP&R PLM Market Size (US$ Mn), by Technology
Table 36: Germany CP&R PLM Market Size (US$ Mn), by Industry
Table 37: The U.K. CP&R PLM Market Size (US$ Mn), by Technology
Table 38: The U.K. CP&R PLM Market Size (US$ Mn), by Industry
Table 39: France CP&R PLM Market Size (US$ Mn), by Technology
Table 40: France CP&R PLM Market Size (US$ Mn), by Industry
Table 41: Italy CP&R PLM Market Size (US$ Mn), by Technology
Table 42: Italy CP&R PLM Market Size (US$ Mn), by Industry
Table 43: Rest of EMEA CP&R PLM Market Size (US$ Mn), by Technology
Table 44: Rest of EMEA CP&R PLM Market Size (US$ Mn), by Industry
Table 45: Asia CP&R PLM Market Size (US$ Mn), by Country
Table 46: ASEAN CP&R PLM Market Size (US$ Mn), by Country
Table 47: Asia CP&R PLM Market Size (US$ Mn), by Technology
Table 48: Asia CP&R PLM Market Size (US$ Mn), by Industry
Table 49: Asia CP&R PLM Market Services, by Country
Table 50: Asia CP&R PLM Market Size (US$ Mn), by Enterprise Deployment
Table 51: Asia CP&R PLM Market Size (US$ Mn), by Cloud Deployment
Table 52: Asia CP&R PLM Market Size (US$ Mn), by SAAS Deployment
Table 53: China CP&R PLM Market Size (US$ Mn), by Technology
Table 54: China CP&R PLM Market Size (US$ Mn), by Industry
Table 55: India CP&R PLM Market Size (US$ Mn), by Technology
Table 56: India CP&R PLM Market Size (US$ Mn), by Industry
Table 57: Japan CP&R PLM Market Size (US$ Mn), by Technology
Table 58: Japan CP&R PLM Market Size (US$ Mn), by Industry
Table 59: Australia & New Zealand CP&R PLM Market Size (US$ Mn), by Technology
Table 60: Australia & New Zealand CP&R PLM Market Size (US$ Mn), by Industry
Table 61: Thailand_ASEAN CP&R PLM Market Size (US$ Mn), by Technology
Table 62: Thailand_ASEAN CP&R PLM Market Size (US$ Mn), by Industry
Table 63: Vietnam_ASEAN CP&R PLM Market Size (US$ Mn), by Technology
Table 64: Vietnam_ASEAN CP&R PLM Market Size (US$ Mn), by Industry
Table 65: Korea CP&R PLM Market Size (US$ Mn), by Technology
Table 66: Korea CP&R PLM Market Size (US$ Mn), by Industry
Table 67: Rest of ASEAN CP&R PLM Market Size (US$ Mn), by Technology
Table 68: Rest of ASEAN CP&R PLM Market Size (US$ Mn), by Industry
Table 69: Rest of Asia CP&R PLM Market Size (US$ Mn), by Technology
Table 70: Rest of Asia CP&R PLM Market Size (US$ Mn), by Industry
List of Figures
Figure 1: Global PLM CP&R Market Size (US$ Mn) and Forecast, 2016–2026
Figure 2: Global CAGR Breakdown
Figure 3: GDP (US$ Bn), Top Economies (2012-2017)
Figure 4: Top Economies GDP Landscape
Figure 5: Gross Domestic Product (GDP) per Capita; Analysis (1/2) (US$ Tn), by Major Countries, 2012-2017
Figure 6: Roadmap
Figure 7: Porter’s Five Forces
Figure 8: PESTLE Analysis
Figure 9: Ecosystem
Figure 10: Market Dynamics
Figure 11: Impact Analysis
Figure 12: Major Revenue Contributors of PLM
Figure 13: Total Addressable Market Chart
Figure 14: Adoption Rate (%), 2018 and 2026
Figure 15: Global CP&R PLM Market Forecast trends, 2018-2026 (US$ Mn)
Figure 16: Global CP&R PLM Market, Absolute Incremental Opportunity Analysis, 2016-2026
Figure 17: Global PLM CP&R Opportunity Assessment, by Technology
Figure 18: Global PLM CP&R Opportunity Assessment, by Deployment Type
Figure 19: Global PLM CP&R Opportunity Assessment, by Industry
Figure 20: Opportunity Assessment, By Region
Figure 21: Global Leading Segments
Figure 22: Global Market Share - 2017
Figure 23: Americas Leading Segments
Figure 24: Americas Market Share - 2017
Figure 25: EMEA Leading Segments
Figure 26: EMEA Market Share - 2017
Figure 27: Asia Leading Segments
Figure 28: Asia Market Share - 2017
Figure 29: Competition Matrix
Figure 30: Market Share Analysis
Figure 31: Regional Presence of Major Players in the Market
Copyright © Transparency Market Research, Inc. All Rights reserved
Trust Online

Product Lifecycle Management Consumer Packaged Goods and Retail (PLM CP&R) Market
