Process safety refers to the protection of property and people from catastrophic and episodic incidents that may result from unexpected or unplanned deviations in process conditions. Process safety services help customers in meeting their health, safety, and environmental compliance needs in a systematic manner. Major services offered by the process safety services market include consulting, auditing, training, and certification. Process safety service providers offer a mechanism for understanding and controlling the risks associated with processes as well as assistance in increasing productivity and reliability, improving safety and security, and enhancing overall business performance. The process manufacturing segment is expected to account for a significant share of the process safety services market over the forecast period. The global process safety services market is currently driven by increasing global awareness regarding employee and process safety.
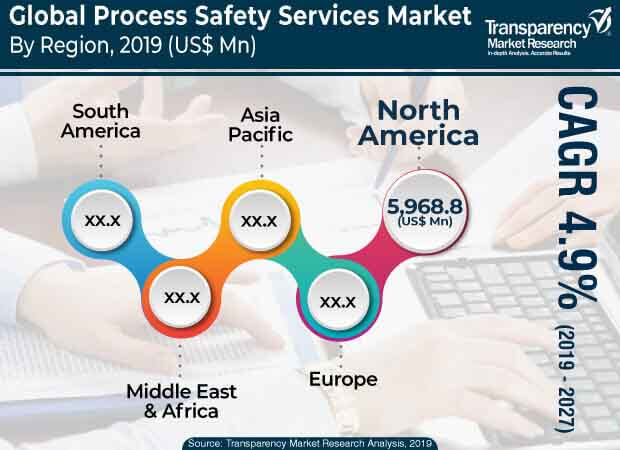
The global process safety services market was valued at US$ 18,337.7 Mn in 2018 and is expected to expand at a CAGR of 4.9% during the forecast period.
Growing safety demands in the oil & gas and chemical industry is expected to drive the process safety services market. However, operational silos, budget allocation models, and lack of skilled labor are some of the major factors restraining the market. Budget allocated by small and mid-size industries specifically for primary safety does not cover allocation for precise and on time monitoring of incidents. Thus, the budget scope may not address the safety of information, technology, and workplace health adequately, leading to competing priorities and lack of collaboration. Shifting focus toward safety in APAC is anticipated to present significant opportunities for the process safety services market. In the Asia Pacific (APAC) region, attitude toward process safety has been of some concern especially in emerging economies such as India and China. A replacement worker is easily available in case of injury or accident in the region due to low labor cost and a fast growing population. Moreover, serious incidents in the past in the region such as the Bhopal Gas Tragedy, and the Fukushima earthquake have raised concerns about process hazards.
The global process safety services market is expected to be driven by significant growth in Asia Pacific. The region is projected to constitute a significant market share during the forecast period, with China, Japan, and India contributing most to the region’s revenue. The process safety services market in Asia Pacific is mainly driven by growing adoption of new technologies by emerging countries such as China, India, and Malaysia. As the manufacturing environment continues to change, process safety services are also evolving to fulfill new technology expectations and demands. Growing requirement to drive manufacturing management and production efficiency is one of the major factors that accelerates the demand for process safety services in the manufacturing sector. Moreover, adoption of Dust Hazard Analysis (DHA) solutions is expected to see high penetration in the Asia Pacific region.The market in Asia Pacific is estimated to expand at a rapid CAGR of 5.8% from 2019 to 2027. Growing consulting services for better project management and claims management is driving the process safety market in Europe. Moreover, regulations and policies in Europe are very stringent and industry verticals are bound to follow these rules. Awareness and safety related to the company, processes, and assets is high in this region. Europe has dominance in the mechanical integrity industry due to dominance of the manufacturing industry vertical in this region. Europe has the world’s best car manufacturing industry especially in Germany and France. This domination in the mechanical sector is driving the process safety service market in this region.
Major players operating in the process safety services market include Honeywell Process Solutions, RRC International, ABB Ltd., Bureau Veritas S.A., HIMA Paul Hildebrandt GmbH + Co KG, Intertek Group PLC, SGS Group, Rockwell Automation, Inc., TUV SUD, SOCOTEC Certification International, DEKRA, Smith & Burgess Process Safety Consulting, Process Engineering Associates, LLC, ioKinetic, LLC., and Ingenero, Inc.
1. Preface
1.1. Market Scope
1.2. Market Segmentation
1.3. Key Research Objectives
2. Assumptions and Research Methodology
2.1. Market Taxonomy - Segment Definitions
2.2. Research Methodology
2.2.1. List of Primary and Secondary Sources
2.3. Key Assumptions for Data Modeling
3. Executive Summary : Global Process Safety Services Market
4. Market Overview
4.1. Introduction
4.2. Global Market – Macro Economic Factors Overview
4.2.1. World GDP Indicator – For Top 20 Economies
4.2.2. Global ICT Spending (US$ Mn), 2012, 2018, 2026
4.3. Technology/Product Roadmap
4.4. Key Market Indicators
4.5. Market Factor Analysis
4.5.1. Porter’s Five Forces Analysis
4.5.2. PESTEL Analysis
4.5.3. Value Chain Analysis
4.5.4. Market Dynamics (Growth Influencers)
4.5.4.1. Drivers
4.5.4.2. Restraints
4.5.4.3. Opportunities
4.5.4.4. Impact Analysis of Drivers & Restraints
4.6. Regulations and Policies – By Region
4.7. Standards and Directives Analysis
4.7.1. SEVESO (Risk assessment, MOC, PTW, PHA, Contractor Management, Operational Procedures etc.)
4.7.2. HAZOP
4.7.3. Sif-Pro
4.7.4. ATEX
4.7.5. DSEAR
4.7.6. COMAH
4.8. Global Process Safety Services Market Analysis and Forecast, 2015 – 2027
4.8.1. Market Revenue Analysis (US$ Mn)
4.8.1.1. Historic Growth Trends, 2015-2018
4.8.1.2. Forecast Trends, 2019-2027
4.9. Market Opportunity Assessment– By Region (Global/North America/Europe/: Asia Pacific/Middle East & Africa/South America)
4.9.1. By Services
4.9.2. By Solutions
4.9.3. By Industry
4.9.4. By Region/Country
4.10. Market Outlook
4.11. Competitive Scenario and Trends
4.11.1. Process Safety Services Market Concentration Rate
4.11.1.1. List of New Entrants
4.11.2. Mergers & Acquisitions, Expansions
5. Global Process Safety Services Market Analysis and Forecast, By Services
5.1. Overview and Definition
5.2. Key Segment Analysis
5.3. Process Safety Services Market Size (US$ Mn) Forecast, By Services, 2016 – 2027
5.3.1. Consulting
5.3.2. Training
5.3.3. Certification
5.3.4. Auditing
6. Global Process Safety Services Market Analysis and Forecast, By Solutions
6.1. Overview and Definition
6.2. Key Segment Analysis
6.3. Process Safety Services Market Size (US$ Mn) Forecast, By Solutions, 2016 – 2027
6.3.1. Compliance Management
6.3.2. Process Hazard Analysis (PHA)
6.3.3. Safety Instrumented Systems (SIS)
6.3.4. Dust Hazard Analysis (DHA)
6.3.5. Risk Management Programs (RMP)
6.3.6. Facility Siting
6.3.7. Audits, Incident Investigation and Response
6.3.8. Mechanical Integrity
6.3.9. PSM Program Implementation
6.3.10. Others
7. Global Process Safety Services Market Analysis and Forecast, By Industry
7.1. Overview and Definition
7.2. Key Segment Analysis
7.3. Process Safety Services Market Size (US$ Mn) Forecast, By Industry, 2016 – 2027
7.3.1. Automotive & Discrete Manufacturing
7.3.1.1. Mechanical & Plant Engineering
7.3.1.2. Aviation
7.3.1.3. Defense
7.3.2. Process Manufacturing
7.3.2.1. Metal
7.3.2.2. Chemicals
7.3.2.3. Pharmaceuticals
7.3.2.4. Oil, Gas & Mining
7.3.2.5. Pulp & Paper
7.3.2.6. Consumer Goods
7.3.2.6.1. Food and Beverage
7.3.2.6.2. Personal Care Manufacturing
7.3.2.6.3. Others
7.3.3. Government (incl. federal, regional, and local administration, education, etc.)
7.3.4. Utilities
7.3.4.1. Electricity
7.3.4.2. Water
7.3.4.3. Gas
7.3.4.4. Waste disposal
7.3.4.5. Heat
7.3.5. Retail (food)
7.3.6. Construction & Real Estate
8. Global Process Safety Services Market Analysis and Forecast, by Region
8.1. Overview
8.2. Key Segment Analysis
8.3. Process Safety Services Market Size (US$ Mn) Forecast, by Region, 2016 - 2027
8.3.1. North America
8.3.2. Europe
8.3.3. : Asia Pacific
8.3.4. Middle East & Africa
8.3.5. South America
9. North America Process Safety Services Market Analysis and Forecast
9.1. Key Findings
9.2. Impact Analysis of Drivers and Restraint
9.3. Process Safety Services Market Size (US$ Mn) Forecast, By Services, 2016 – 2027
9.3.1. Consulting
9.3.2. Training
9.3.3. Certification
9.3.4. Auditing
9.4. Process Safety Services Market Size (US$ Mn) Forecast, By Solutions, 2016 – 2027
9.4.1. Compliance Management
9.4.2. Process Hazard Analysis (PHA)
9.4.3. Safety Instrumented Systems (SIS)
9.4.4. Dust Hazard Analysis (DHA)
9.4.5. Risk Management Programs (RMP)
9.4.6. Facility Siting
9.4.7. Audits, Incident Investigation and Response
9.4.8. Mechanical Integrity
9.4.9. PSM Program Implementation
9.4.10. Others
9.5. Process Safety Services Market Size (US$ Mn) Forecast, By Industry, 2016 – 2027
9.5.1. Automotive & Discrete Manufacturing
9.5.1.1. Mechanical & Plant Engineering
9.5.1.2. Aviation
9.5.1.3. Defense
9.5.2. Process Manufacturing
9.5.2.1. Metal
9.5.2.2. Chemicals
9.5.2.3. Pharmaceuticals
9.5.2.4. Oil, Gas & Mining
9.5.2.5. Pulp & Paper
9.5.2.6. Consumer Goods
9.5.2.6.1. Food and Beverage
9.5.2.6.2. Personal Care Manufacturing
9.5.2.6.3. Others
9.5.3. Government (incl. federal, regional, and local administration, education, etc.)
9.5.4. Utilities
9.5.4.1. Electricity
9.5.4.2. Water
9.5.4.3. Gas
9.5.4.4. Waste disposal
9.5.4.5. Heat
9.5.5. Retail (food)
9.5.6. Construction & Real Estate
9.6. Process Safety Services Market Size (US$ Mn) Forecast, by Country & Sub-region, 2016 - 2027
9.6.1. The U.S.
9.6.2. Canada
9.6.3. Rest of North America
10. Europe Process Safety Services Market Analysis and Forecast
10.1. Key Findings
10.2. Impact Analysis of Drivers and Restraint
10.3. Process Safety Services Market Size (US$ Mn) Forecast, By Services, 2016 – 2027
10.3.1. Consulting
10.3.2. Training
10.3.3. Certification
10.3.4. Auditing
10.4. Process Safety Services Market Size (US$ Mn) Forecast, By Solutions, 2016 – 2027
10.4.1. Compliance Management
10.4.2. Process Hazard Analysis (PHA)
10.4.3. Safety Instrumented Systems (SIS)
10.4.4. Dust Hazard Analysis (DHA)
10.4.5. Risk Management Programs (RMP)
10.4.6. Facility Siting
10.4.7. Audits, Incident Investigation and Response
10.4.8. Mechanical Integrity
10.4.9. PSM Program Implementation
10.4.10. Others
10.5. Process Safety Services Market Size (US$ Mn) Forecast, By Industry, 2016 – 2027
10.5.1. Automotive & Discrete Manufacturing
10.5.1.1. Mechanical & Plant Engineering
10.5.1.2. Aviation
10.5.1.3. Defense
10.5.2. Process Manufacturing
10.5.2.1. Metal
10.5.2.2. Chemicals
10.5.2.3. Pharmaceuticals
10.5.2.4. Oil, Gas & Mining
10.5.2.5. Pulp & Paper
10.5.2.6. Consumer Goods
10.5.2.6.1. Food and Beverage
10.5.2.6.2. Personal Care Manufacturing
10.5.2.6.3. Others
10.5.3. Government (incl. federal, regional, and local administration, education, etc.)
10.5.4. Utilities
10.5.4.1. Electricity
10.5.4.2. Water
10.5.4.3. Gas
10.5.4.4. Waste disposal
10.5.4.5. Heat
10.5.5. Retail (food)
10.5.6. Construction & Real Estate
10.6. Process Safety Services Market Size (US$ Mn) Forecast, By Country & Sub-region, 2016 - 2027
10.6.1. Italy
10.6.2. Spain
10.6.3. Netherlands
10.6.4. Germany
10.6.5. U.K.
10.6.6. France
10.6.7. Rest of Europe
11. Asia Pacific Process Safety Services Market Analysis and Forecast
11.1. Key Findings
11.2. Impact Analysis of Drivers and Restraint
11.3. Process Safety Services Market Size (US$ Mn) Forecast, By Services, 2016 – 2027
11.3.1. Consulting
11.3.2. Training
11.3.3. Certification
11.3.4. Auditing
11.4. Process Safety Services Market Size (US$ Mn) Forecast, By Solutions, 2016 – 2027
11.4.1. Compliance Management
11.4.2. Process Hazard Analysis (PHA)
11.4.3. Safety Instrumented Systems (SIS)
11.4.4. Dust Hazard Analysis (DHA)
11.4.5. Risk Management Programs (RMP)
11.4.6. Facility Siting
11.4.7. Audits, Incident Investigation and Response
11.4.8. Mechanical Integrity
11.4.9. PSM Program Implementation
11.4.10. Others
11.5. Process Safety Services Market Size (US$ Mn) Forecast, By Industry, 2016 – 2027
11.5.1. Automotive & Discrete Manufacturing
11.5.1.1. Mechanical & Plant Engineering
11.5.1.2. Aviation
11.5.1.3. Defense
11.5.2. Process Manufacturing
11.5.2.1. Metal
11.5.2.2. Chemicals
11.5.2.3. Pharmaceuticals
11.5.2.4. Oil, Gas & Mining
11.5.2.5. Pulp & Paper
11.5.2.6. Consumer Goods
11.5.2.6.1. Food and Beverage
11.5.2.6.2. Personal Care Manufacturing
11.5.2.6.3. Others
11.5.3. Government (incl. federal, regional, and local administration, education, etc.)
11.5.4. Utilities
11.5.4.1. Electricity
11.5.4.2. Water
11.5.4.3. Gas
11.5.4.4. Waste disposal
11.5.4.5. Heat
11.5.5. Retail (food)
11.5.6. Construction & Real Estate
11.6. Process Safety Services Market Size (US$ Mn) Forecast, By Country & Sub-region, 2016 - 2027
11.6.1. China
11.6.2. Japan
11.6.3. India
11.6.4. Australia
11.6.5. Singapore
11.6.6. Malaysia
11.6.7. Rest of Asia Pacific
12. Middle East &Africa ( MEA ) Process Safety Services Market Analysis and Forecast
12.1. Key Findings
12.2. Impact Analysis of Drivers and Restraint
12.3. Process Safety Services Market Size (US$ Mn) Forecast, By Services, 2016 – 2027
12.3.1. Consulting
12.3.2. Training
12.3.3. Certification
12.3.4. Auditing
12.4. Process Safety Services Market Size (US$ Mn) Forecast, By Solutions, 2016 – 2027
12.4.1. Compliance Management
12.4.2. Process Hazard Analysis (PHA)
12.4.3. Safety Instrumented Systems (SIS)
12.4.4. Dust Hazard Analysis (DHA)
12.4.5. Risk Management Programs (RMP)
12.4.6. Facility Siting
12.4.7. Audits, Incident Investigation and Response
12.4.8. Mechanical Integrity
12.4.9. PSM Program Implementation
12.4.10. Others
12.5. Process Safety Services Market Size (US$ Mn) Forecast, By Industry, 2016 – 2027
12.5.1. Automotive & Discrete Manufacturing
12.5.1.1. Mechanical & Plant Engineering
12.5.1.2. Aviation
12.5.1.3. Defense
12.5.2. Process Manufacturing
12.5.2.1. Metal
12.5.2.2. Chemicals
12.5.2.3. Pharmaceuticals
12.5.2.4. Oil, Gas & Mining
12.5.2.5. Pulp & Paper
12.5.2.6. Consumer Goods
12.5.2.6.1. Food and Beverage
12.5.2.6.2. Personal Care Manufacturing
12.5.2.6.3. Others
12.5.3. Government (incl. federal, regional, and local administration, education, etc.)
12.5.4. Utilities
12.5.4.1. Electricity
12.5.4.2. Water
12.5.4.3. Gas
12.5.4.4. Waste disposal
12.5.4.5. Heat
12.5.5. Retail (food)
12.5.6. Construction & Real Estate
12.6. Process Safety Services Market Size (US$ Mn) Forecast, by Country & Sub-region, 2016 - 2026
12.6.1. Saudi Arabia
12.6.2. UAE
12.6.3. South Africa
12.6.4. Rest of MEA
13. South America Process Safety Services Market Analysis and Forecast
13.1. Key Findings
13.2. Impact Analysis of Drivers and Restraint
13.3. Process Safety Services Market Size (US$ Mn) Forecast, By Services, 2016 – 2027
13.3.1. Consulting
13.3.2. Training
13.3.3. Certification
13.3.4. Auditing
13.4. Process Safety Services Market Size (US$ Mn) Forecast, By Solutions, 2016 – 2027
13.4.1. Compliance Management
13.4.2. Process Hazard Analysis (PHA)
13.4.3. Safety Instrumented Systems (SIS)
13.4.4. Dust Hazard Analysis (DHA)
13.4.5. Risk Management Programs (RMP)
13.4.6. Facility Siting
13.4.7. Audits, Incident Investigation and Response
13.4.8. Mechanical Integrity
13.4.9. PSM Program Implementation
13.4.10. Others
13.5. Process Safety Services Market Size (US$ Mn) Forecast, By Industry, 2016 – 2027
13.5.1. Automotive & Discrete Manufacturing
13.5.1.1. Mechanical & Plant Engineering
13.5.1.2. Aviation
13.5.1.3. Defense
13.5.2. Process Manufacturing
13.5.2.1. Metal
13.5.2.2. Chemicals
13.5.2.3. Pharmaceuticals
13.5.2.4. Oil, Gas & Mining
13.5.2.5. Pulp & Paper
13.5.2.6. Consumer Goods
13.5.2.6.1. Food and Beverage
13.5.2.6.2. Personal Care Manufacturing
13.5.2.6.3. Others
13.5.3. Government (incl. federal, regional, and local administration, education, etc.)
13.5.4. Utilities
13.5.4.1. Electricity
13.5.4.2. Water
13.5.4.3. Gas
13.5.4.4. Waste disposal
13.5.4.5. Heat
13.5.5. Retail (food)
13.5.6. Construction & Real Estate
13.6. Process Safety Services Market Size (US$ Mn) Forecast, by Country & Sub-region, 2016 - 2026
13.6.1. Brazil
13.6.2. Rest of South America
14. Competition Landscape
14.1. Market Player – Competition Matrix
14.2. Market Revenue Share Analysis (%), By Company (2017)
14.3. Regional Presence (Intensity Map)
15. Company Profiles
15.1. Honeywell Process Solutions
15.1.1. Basic Overview
15.1.2. Sales Area/Geographical Presence
15.1.3. Key Competitors
15.1.4. Revenue
15.1.5. Strategy
15.2. RRC International
15.2.1. Basic Overview
15.2.2. Sales Area/Geographical Presence
15.2.3. Key Competitors
15.2.4. Revenue
15.2.5. Strategy
15.3. ABB Ltd.
15.3.1. Basic Overview
15.3.2. Sales Area/Geographical Presence
15.3.3. Key Competitors
15.3.4. Revenue
15.3.5. Strategy
15.4. Bureau Veritas S.A.
15.4.1. Basic Overview
15.4.2. Sales Area/Geographical Presence
15.4.3. Key Competitors
15.4.4. Revenue
15.4.5. Strategy
15.5. HIMA Paul Hildebrandt GmbH + Co KG
15.5.1. Basic Overview
15.5.2. Sales Area/Geographical Presence
15.5.3. Key Competitors
15.5.4. Revenue
15.5.5. Strategy
15.6. Intertek Group PLC
15.6.1. Basic Overview
15.6.2. Sales Area/Geographical Presence
15.6.3. Key Competitors
15.6.4. Revenue
15.6.5. Strategy
15.7. SGS Group
15.7.1. Basic Overview
15.7.2. Sales Area/Geographical Presence
15.7.3. Key Competitors
15.7.4. Revenue
15.7.5. Strategy
15.8. Rockwell Automation, Inc.
15.8.1. Basic Overview
15.8.2. Sales Area/Geographical Presence
15.8.3. Key Competitors
15.8.4. Revenue
15.8.5. Strategy
15.9. TUV SUD
15.9.1. Basic Overview
15.9.2. Sales Area/Geographical Presence
15.9.3. Key Competitors
15.9.4. Revenue
15.9.5. Strategy
15.10. SOCOTEC Certification International
15.10.1. Basic Overview
15.10.2. Sales Area/Geographical Presence
15.10.3. Key Competitors
15.10.4. Revenue
15.10.5. Strategy
15.11. DEKRA
15.11.1. Basic Overview
15.11.2. Sales Area/Geographical Presence
15.11.3. Key Competitors
15.11.4. Revenue
15.11.5. Strategy
15.12. Smith & Burgess Process Safety Consulting
15.12.1. Basic Overview
15.12.2. Sales Area/Geographical Presence
15.12.3. Key Competitors
15.12.4. Revenue
15.12.5. Strategy
15.13. Process Engineering Associates, LLC
15.13.1. Basic Overview
15.13.2. Sales Area/Geographical Presence
15.13.3. Key Competitors
15.13.4. Revenue
15.13.5. Strategy
15.14. ioKinetic, LLC.
15.14.1. Basic Overview
15.14.2. Sales Area/Geographical Presence
15.14.3. Key Competitors
15.14.4. Revenue
15.14.5. Strategy
15.15. Ingenero, Inc.
15.15.1. Basic Overview
15.15.2. Sales Area/Geographical Presence
15.15.3. Key Competitors
15.15.4. Revenue
15.15.5. Strategy
16. Key Takeaways
List of Tables
Table No. 1: North America ICT Spending (US$ Mn)
Table No. 2: Europe ICT Spending (US$ Mn)
Table No. 3: Asia Pacific ICT Spending (US$ Mn)
Table No. 4: MEA ICT Spending (US$ Mn)
Table No. 5: South America ICT Spending (US$ Mn)
Table No. 6: Mergers & Acquisitions, Expansions
Table No. 7: Global Process Safety Services Market Size (US$ Mn) Forecast, by Services, 2016 – 2027
Table No. 8: Global Process Safety Services Market Size (US$ Mn) Forecast, by Solution, 2016 – 2027
Table No. 9: Global Process Safety Services Market Size (US$ Mn) Forecast, by Industry, 2016 – 2027
Table No. 10: Global Process Safety Services Market Size (US$ Mn) Forecast, by Industry, by Automotive & Discrete Manufacturing, 2016 – 2027
Table No. 11: Global Process Safety Services Market Size (US$ Mn) Forecast, by Industry, by Process Manufacturing, 2016 – 2027
Table No. 12: Global Process Safety Services Market Size (US$ Mn) Forecast, by Industry, by Utilities, 2016 – 2027
Table No.: 13: Global Process Safety Services Market Size (US$ Mn) Forecast, by Region, 2016 – 2027
Table No. 14: North America Process Safety Services Market Size (US$ Mn) Forecast, by Services, 2016 – 2027
Table No. 15: North America Process Safety Services Market Size (US$ Mn) Forecast, by Solution, 2016 – 2027
Table No. 16: North America Process Safety Services Market Size (US$ Mn) Forecast, by Industry, 2016 – 2027
Table No. 17: North America Process Safety Services Market Size (US$ Mn) Forecast, by Industry, by Automotive & Discrete Manufacturing, 2016 – 2027
Table No. 18: North America Process Safety Services Market Size (US$ Mn) Forecast, by Industry, by Process Manufacturing, 2016 – 2027
Table No. 19: North America Process Safety Services Market Size (US$ Mn) Forecast, by Industry, by Utilities, 2016 – 2027
Table No. 20: North America Process Safety Services Market Size (US$ Mn) Forecast, by Country, 2016 – 2027
Table No. 21: Europe Process Safety Services Market Size (US$ Mn) Forecast, by Services, 2016 – 2027
Table No. 22: Europe Process Safety Services Market Size (US$ Mn) Forecast, by Solution, 2016 – 2027
Table No. 23: Europe Process Safety Services Market Size (US$ Mn) Forecast, by Industry, 2016 – 2027
Table No. 24: Europe Process Safety Services Market Size (US$ Mn) Forecast, by Industry, by Automotive & Discrete Manufacturing, 2016 – 2027
Table No. 25: Europe Process Safety Services Market Size (US$ Mn) Forecast, by Industry, by Process Manufacturing, 2016 – 2027
Table No. 26: Europe Process Safety Services Market Size (US$ Mn) Forecast, by Industry, by Utilities, 2016 – 2027
Table No. 27: Europe Process Safety Services Market Size (US$ Mn) Forecast, by Country, 2016 – 2027
Table No. 28: Asia Pacific Process Safety Services Market Size (US$ Mn) Forecast, by Services, 2016 – 2027
Table No. 29: Asia Pacific Process Safety Services Market Size (US$ Mn) Forecast, by Solution, 2016 – 2027
Table No. 30: Asia Pacific Process Safety Services Market Size (US$ Mn) Forecast, by Industry, 2016 – 2027
Table No. 31: Asia Pacific Process Safety Services Market Size (US$ Mn) Forecast, by Industry, by Automotive & Discrete Manufacturing, 2016 – 2027
Table No. 32: Asia Pacific Process Safety Services Market Size (US$ Mn) Forecast, by Industry, by Process Manufacturing, 2016 – 2027
Table No. 33: Asia Pacific Process Safety Services Market Size (US$ Mn) Forecast, by Industry, by Utilities, 2016 – 2027
Table No. 34: Asia Pacific Process Safety Services Market Size (US$ Mn) Forecast, by Country, 2016 – 2027
Table No. 35: MEA Process Safety Services Market Size (US$ Mn) Forecast, by Services, 2016 – 2027
Table No. 36: MEA Process Safety Services Market Size (US$ Mn) Forecast, by Solution, 2016 – 2027
Table No. 37: MEA Process Safety Services Market Size (US$ Mn) Forecast, by Industry, 2016 – 2027
Table No. 38: MEA Process Safety Services Market Size (US$ Mn) Forecast, by Industry, by Automotive & Discrete Manufacturing, 2016 – 2027
Table No. 39: MEA Process Safety Services Market Size (US$ Mn) Forecast, by Industry, by Process Manufacturing, 2016 – 2027
Table No. 40: MEA Process Safety Services Market Size (US$ Mn) Forecast, by Industry, by Utilities, 2016 – 2027
Table No. 41: MEA Process Safety Services Market Size (US$ Mn) Forecast, by Country, 2016 – 2027
Table No. 42: South America Process Safety Services Market Size (US$ Mn) Forecast, by Services, 2016 – 2027
Table No. 43: South America Process Safety Services Market Size (US$ Mn) Forecast, by Solution, 2016 – 2027
Table No. 44: South America Process Safety Services Market Size (US$ Mn) Forecast, by Industry, 2016 – 2027
Table No. 45: South America Process Safety Services Market Size (US$ Mn) Forecast, by Industry, by Automotive & Discrete Manufacturing, 2016 – 2027
Table No. 46: South America Process Safety Services Market Size (US$ Mn) Forecast, by Industry, by Process Manufacturing, 2016 – 2027
Table No. 47: South America Process Safety Services Market Size (US$ Mn) Forecast, by Industry, by Utilities, 2016 – 2027
Table No. 48: South America Process Safety Services Market Size (US$ Mn) Forecast, by Country, 2016 – 2027
Table No. 49: Company Profile, RCC International, Business Overview / Portfolio
Table No. 50: Company Profile, Smith & Burgess Process Safety Consulting, Business Overview / Portfolio
Table No. 51: Company Profile, Socotec Certification International, Business Overview / Portfolio
Table No. 52: Company Profile, HIMA Paul Hildebrandt GmbH + Co KG, Business Overview / Portfolio
Table No. 53: Company Profile, Ingenero, Inc., Business Overview / Portfolio
Table No. 54: Company Profile, ioKinetic, LLC, Business Overview / Portfolio
Table No. 55: Company Profile, Process Engineering Associates, LLC, Business Overview / Portfolio
List of Figures
Figure No. 1: Global Process Safety Services Size (US$ Mn) Forecast, 2017–2027
Figure No. 2: GDP (US$ Bn), Top Economies (2012-2017)
Figure No. 3: Top Economies GDP Landscape
Figure No. 4: Gross Domestic Product (GDP) per Capita; Analysis (1/2) (US$ Tn), By Major Countries, 2012-2017
Figure No. 5: Global Process Safety Services Market Attractiveness Analysis, by Region (from the year 2019- 2027)
Figure No. 6: Global Process Safety Services Market Attractiveness Analysis, by Services (from the year 2019- 2027)
Figure No. 7: Global Process Safety Services Market Attractiveness Analysis, by Solution (from the year 2019- 2027)
Figure No. 8: Global Process Safety Services Market Attractiveness Analysis, by Industry (from the year 2019- 2027)
Figure No. 9: Revenue (US$ Mn), 2019
Figure No. 10: Market Share, 2019 (%)
Figure No. 11: Y-O-Y Growth, 2019-2027 (%)
Figure No. 12: Revenue (US$ Mn), 2019
Figure No. 13: Market Share, 2019 (%)
Figure No. 14: Y-O-Y Growth, 2019-2027 (%)
Figure No. 15: Revenue (US$ Mn), 2019
Figure No. 16: Market Share, 2019 (%)
Figure No. 17:Y-O-Y Growth, 2019-2027 (%)
Figure No. 18: Revenue (US$ Mn), 2019
Figure No. 19: Market Share, 2019 (%)
Figure No. 20: Y-O-Y Growth, 2019-2027 (%)
Figure No. 21: Process safety services Market Concentration Ratio: 62.3
Figure No. 22: Global Process Safety Services Market Share Analysis, by Services (2019)
Figure No. 23: Global Process Safety Services Market Share Analysis, by Services (2027)
Figure No. 24: Global Process Safety Services Market Share Analysis, by Solution (2019)
Figure No. 25: Global Process Safety Services Market Share Analysis, by Solution (2027)
Figure No. 26: Global Process Safety Services Market Share Analysis, by Industry (2019)
Figure No. 27: Global Process Safety Services Market Share Analysis, by Industry (2027)
Figure No. 28: Global Process Safety Services Market Share Analysis, by Industry, by Automotive & Discrete Manufacturing (2019)
Figure No. 29: Global Process Safety Services Market Share Analysis, by Industry, by Automotive & Discrete Manufacturing (2027)
Figure No. 30: Global Process Safety Services Market Share Analysis, by Industry, by Process Manufacturing (2019)
Figure No. 31: Global Process Safety Services Market Share Analysis, by Industry, by Process Manufacturing (2027)
Figure No. 32: Global Process Safety Services Market Share Analysis, by Industry, by Utilities (2019)
Figure No. 33: Global Process Safety Services Market Share Analysis, by Industry, by Utilities (2027)
Figure No. 34: Global Process Safety Services Market Share Analysis, by Region (2019)
Figure No. 35: Global Process Safety Services Market Share Analysis, by Region (2027)
Figure No. 36: North America Process Safety Services Market Share Analysis, by Services (2019)
Figure No. 37: North America Process Safety Services Market Share Analysis, by Services (2027)
Figure No. 38: North America Process Safety Services Market Share Analysis, by Solution (2019)
Figure No. 39: North America Process Safety Services Market Share Analysis, by Solution (2027)
Figure No. 40: North America Process Safety Services Market Share Analysis, by Industry (2019)
Figure No. 41: North America Process Safety Services Market Share Analysis, by Industry (2027)
Figure No. 42: North America Process Safety Services Market Share Analysis, by Industry, by Automotive & Discrete Manufacturing (2019)
Figure No. 43: North America Process Safety Services Market Share Analysis, by Industry, by Automotive & Discrete Manufacturing (2027)
Figure No. 44: North America Process Safety Services Market Share Analysis, by Industry, by Process Manufacturing (2019)
Figure No. 45: North America Process Safety Services Market Share Analysis, by Industry, by Process Manufacturing (2027)
Figure No. 46: North America Process Safety Services Market Share Analysis, by Industry, by Utilities (2019)
Figure No. 47: North America Process Safety Services Market Share Analysis, by Industry, by Utilities (2027)
Figure No. 48: North America Process Safety Services Market Share Analysis, by Country (2019)
Figure No. 49: North America Process Safety Services Market Share Analysis, by Country (2027)
Figure No. 50: Europe Process Safety Services Market Share Analysis, by Services (2019)
Figure No. 51: Europe Process Safety Services Market Share Analysis, by Services (2027)
Figure No. 52: Europe Process Safety Services Market Share Analysis, by Solution (2019)
Figure No. 53: Europe Process Safety Services Market Share Analysis, by Solution (2027)
Figure No. 54: Europe Process Safety Services Market Share Analysis, by Industry (2019)
Figure No. 55: Europe Process Safety Services Market Share Analysis, by Industry (2027)
Figure No. 56: Europe Process Safety Services Market Share Analysis, by Industry, by Automotive & Discrete Manufacturing (2019)
Figure No. 57: Europe Process Safety Services Market Share Analysis, by Industry, by Automotive & Discrete Manufacturing (2027)
Figure No. 58: Europe Process Safety Services Market Share Analysis, by Industry, by Process Manufacturing (2019)
Figure No. 59: Europe Process Safety Services Market Share Analysis, by Industry, by Process Manufacturing (2027)
Figure No. 60: Europe Process Safety Services Market Share Analysis, by Industry, by Utilities (2019)
Figure No. 61: Europe Process Safety Services Market Share Analysis, by Industry, by Utilities (2027)
Figure No. 62: Europe Process Safety Services Market Share Analysis, by Country (2019)
Figure No. 63: Europe Process Safety Services Market Share Analysis, by Country (2027)
Figure No. 64: Asia Pacific Process Safety Services Market Share Analysis, by Services (2019)
Figure No. 65: Asia Pacific Process Safety Services Market Share Analysis, by Services (2027)
Figure No. 66: Asia Pacific Process Safety Services Market Share Analysis, by Solution (2019)
Figure No. 67: Asia Pacific Process Safety Services Market Share Analysis, by Solution (2027)
Figure No. 68: Asia Pacific Process Safety Services Market Share Analysis, by Industry (2019)
Figure No. 69: Asia Pacific Process Safety Services Market Share Analysis, by Industry (2027)
Figure No. 70: Asia Pacific Process Safety Services Market Share Analysis, by Industry, by Automotive & Discrete Manufacturing (2019)
Figure No. 71: Asia Pacific Process Safety Services Market Share Analysis, by Industry, by Automotive & Discrete Manufacturing (2027)
Figure No. 72: Asia Pacific Process Safety Services Market Share Analysis, by Industry, by Process Manufacturing (2019)
Figure No. 73: Asia Pacific Process Safety Services Market Share Analysis, by Industry, by Process Manufacturing (2027)
Figure No. 74: Asia Pacific Process Safety Services Market Share Analysis, by Industry, by Utilities (2019)
Figure No. 75: Asia Pacific Process Safety Services Market Share Analysis, by Industry, by Utilities (2027)
Figure No. 76: Asia Pacific Process Safety Services Market Share Analysis, by Country (2019)
Figure No. 77: Asia Pacific Process Safety Services Market Share Analysis, by Country (2027)
Figure No. 78: MEA Process Safety Services Market Share Analysis, by Services (2019)
Figure No. 79: MEA Process Safety Services Market Share Analysis, by Services (2027)
Figure No. 80: MEA Process Safety Services Market Share Analysis, by Solution (2019)
Figure No. 81: MEA Process Safety Services Market Share Analysis, by Solution (2027)
Figure No. 82: MEA Process Safety Services Market Share Analysis, by Industry (2019)
Figure No. 83: MEA Process Safety Services Market Share Analysis, by Industry (2027)
Figure No. 84: MEA Process Safety Services Market Share Analysis, by Industry, by Automotive & Discrete Manufacturing (2019)
Figure No. 85: MEA Process Safety Services Market Share Analysis, by Industry, by Automotive & Discrete Manufacturing (2027)
Figure No. 86: MEA Process Safety Services Market Share Analysis, by Industry, by Process Manufacturing (2019)
Figure No. 87: MEA Process Safety Services Market Share Analysis, by Industry, by Process Manufacturing (2027)
Figure No. 88: MEA Process Safety Services Market Share Analysis, by Industry, by Utilities (2019)
Figure No. 89: MEA Process Safety Services Market Share Analysis, by Industry, by Utilities (2027)
Figure No. 90: MEA Process Safety Services Market Share Analysis, by Country (2019)
Figure No. 91: MEA Process Safety Services Market Share Analysis, by Country (2027)
Figure No. 92: South America Process Safety Services Market Share Analysis, by Services (2019)
Figure No. 93: South America Process Safety Services Market Share Analysis, by Services (2027)
Figure No. 94: South America Process Safety Services Market Share Analysis, by Solution (2019)
Figure No. 95: South America Process Safety Services Market Share Analysis, by Solution (2027)
Figure No. 96: South America Process Safety Services Market Share Analysis, by Industry (2019)
Figure No. 97: South America Process Safety Services Market Share Analysis, by Industry (2027)
Figure No. 98: South America Process Safety Services Market Share Analysis, by Industry, by Automotive & Discrete Manufacturing (2019)
Figure No. 99: South America Process Safety Services Market Share Analysis, by Industry, by Automotive & Discrete Manufacturing (2027)
Figure No. 100: South America Process Safety Services Market Share Analysis, by Industry, by Process Manufacturing (2019)
Figure No. 101: South America Process Safety Services Market Share Analysis, by Industry, by Process Manufacturing (2027)
Figure No. 102: South America Process Safety Services Market Share Analysis, by Industry, by Utilities (2019)
Figure No. 103: South America Process Safety Services Market Share Analysis, by Industry, by Utilities (2027)
Figure No. 104: South America Process Safety Services Market Share Analysis, by Country (2019)
Figure No. 105: South America Process Safety Services Market Share Analysis, by Country (2027)
Figure No. 106: Company Profile, TUV SUD AG, Revenue (US$ Mn) & Y-o-Y Growth (%), 2016–2018
Figure No. 107: Company Profile, SGS Group, Revenue (US$ Mn) & Y-o-Y Growth (%), 2016–2018
Figure No. 108: Company Profile, ABB Ltd., Figure No. 108 Revenue (US$ Mn) & Y-o-Y Growth (%), 2013–2018
Figure No. 109: Company Profile, Bureau Veritas SA, Revenue (US$ Bn) & Y-o-Y Growth (%), 2013–2018
Figure No. 110: Company Profile, Dekra SE, Revenue (US$ Bn) & Y-o-Y Growth (%), 2013–2018
Figure No. 111: Company Profile, Honeywell Process Solutions, and Revenue (US$ Bn) & Y-o-Y Growth (%), 2013–2018
Figure No. 112: Company Profile, Intertek Group PLC, Revenue (US$ Mn) & Y-o-Y Growth (%), 2016–2018
Figure No. 113: Company Profile, Rockwell Automation, Inc., Revenue (US$ Mn) & Y-o-Y Growth (%), 2016–2018
Copyright © Transparency Market Research, Inc. All Rights reserved
Trust Online

Process Safety Services Market Insights, 2019 - 2027
