Analysts at Transparency Market Research opine that 2020 was supposed to be the semiconductor industry’s year of recovery after a series of merger & acquisition (M&A) deal made in 2019. However, the COVID-19 crisis has greatly influenced business decisions, thus affecting many M&A deals. Nevertheless, companies in the traction transformer market are taking data-driven decisions before entering into mergers and acquisitions.
Companies in the traction transformer market are focusing on positive or limited negative sectors such as high-speed commuter & regional applications, trains, and electric locomotives to keep the economies running. Mission-critical projects related to engineering and infrastructure are creating income sources for market stakeholders. Companies are rethinking supply networks and diversifying their supply chains to avoid putting all eggs in one geographical basket.
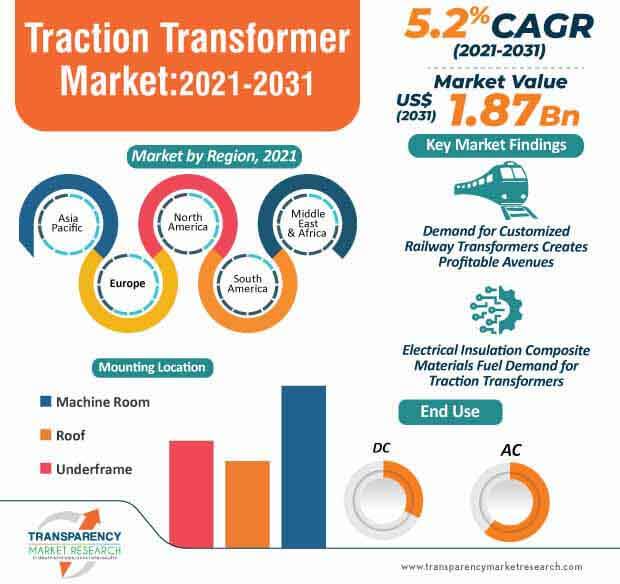
The traction transformer market is projected to advance at a CAGR of 5.2% during the forecast period. This is evident since there is a need of special components for traction transformers. Elektro-Isola - a materials company in Vejle, Denmark, is capitalizing on this opportunity to provide electromechanical composite materials for traction transformers in the range of Etronit, Etronax, and G-Etronax, respectively.
There is a demand for electrical insulation composite materials in the traction transformer market based on paper and glass materials. Excellent electrotechnical properties of these materials play a crucial role in the production of traction transformer components.
Traction transformers are critical components in the traction chain, affecting both train performance and operator services. Hitachi ABB Power Grids - a global pioneer in power technologies, is being recognized for its comprehensive portfolio of traction transformers that are being extensively used in tram trains, AC metros and high speed, commuter & regional trains.
Engineers are looking for companies with decades of experience in the field of traction transformers. In order to boost credibility, companies in the traction transformer market are offering custom-made solutions to withstand physical and operating constraints. The burgeoning growth of the high-speed rail sector is creating revenue opportunities for semiconductor companies. The total weight of transformers is a crucial factor in the development of high-speed trains.
The traction transformer market is predicted to mature from a revenue of US$ 1.08 Bn in 2020 and reach US$ 1.87 Bn by 2031. There is a demand for customized and state-of-the-art railway transformers. Siemens Energy— a multinational energy technology company, is increasing efforts to meet this demand to offer maximum reliability, economic efficiency, and safety in railway transformers.
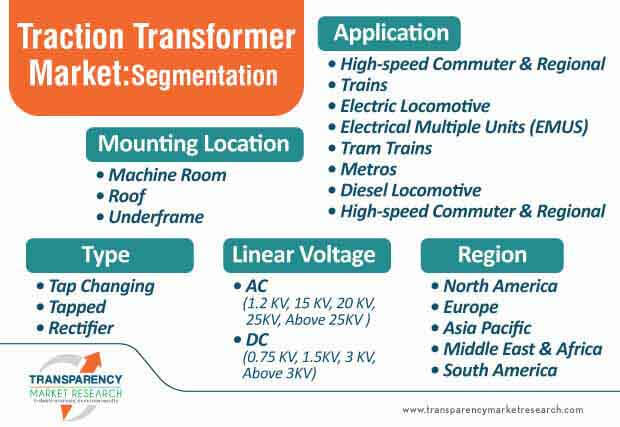
Manufacturers in the traction transformer market are designing single-phase and multi-phase units for rail operators and train manufacturers. Companies are maintaining a stellar track record by establishing a refined system for global logistics and by adhering to internationally binding quality standards.
Compact, lightweight, and exceptionally reliable traction transformers are being preferred for locomotives. Manufacturers in the traction transformer market are increasing their R&D capabilities to engineer units that help to withstand harsh and demanding environments. Traction transformers for locomotives are being designed to power heavy freight loads over long distances and on tracks with many challenges such as excessive wear, steep profiles, and short curve radii, among others.
Stakeholders in the traction transformer market are providing high level technical experience that facilitates the delivery of traction transformer technology regardless of the constraints faced by commuter train suppliers.
On the other hand, natural and sustainable cooling systems are gaining popularity in traction transformers that optimize cost and improves reliability. Constant innovation and technological enhancement is necessary in the field of traction transformers. Next-gen traction transformers are increasingly replacing traditional fan-based cooling systems by offering a natural and sustainable airflow of the trains’ motion.
Analysts’ Viewpoint
Companies in the traction transformers are pursuing M&A deals that will help to build a more sustainable and forward-thinking company, owing to the disruptions caused by the COVID-19 outbreak. Conventional traction transformers are subject to substantial energy losses, which heat-up the internal windings. Hence, companies in the traction transformer market should innovate in natural and sustainable cooling systems for traction transformers that reduce cost associated with the maintenance of traditional units. On the other hand, there is a growing demand for electrical insulation composite materials that play a pivotal role in the production of traction transformers. Customer-specific materials are being developed to provide exceptional electrical insulation and mechanical properties in traction transformers.
|
Attribute |
Detail |
|
Market Size Value in 2020 (base year) |
US$ 1.08 Bn |
|
Market Forecast Value in 2031 |
US$ 1.87 Bn |
|
Growth Rate (CAGR) |
5.2% |
|
Forecast Period |
2021-2031 |
|
Quantitative Units |
US$ Mn for Value & Units for Volume |
|
Market analysis |
It includes cross segment analysis at global as well as regional level. Further, qualitative analysis includes drivers, restraints, opportunities, key trends, porters five forces analysis, supply chain analysis, parent industry overview, etc. |
|
Competition Landscape |
|
|
Format |
Electronic (PDF) or word + Excel |
|
Market Segmentation |
|
|
Regions Covered |
|
|
Countries Covered |
|
|
Companies Profiled |
|
|
Customization Scope |
Available upon Request |
|
Pricing |
Available upon Request |
Traction Transformer Market is projected to reach US $1.87 Bn by 2031
Traction Transformer Market is expected to grow at a CAGR of 5.2% during 2021-2031
Traction Transformer Market is studied from 2021-2031
Key vendors in the Traction Transformer Market are Hitachi ABB Power Grids Ltd, Siemens AG, Toshiba Corporation, Mitsubishi Electric Corporation, SPX Transformer Solutions Inc., MGM Transformer, Neeltran , Altrafo Srl, Alstom SA, and JST Transformateurs.
Asia Pacific region Takes Lead in the Traction Transformer Market
1. Preface
1.1. Market Introduction
1.2. Market and Segments Definition
1.3. Market Taxonomy
1.4. Research Methodology
1.5. Assumption and Acronyms
2. Executive Summary
2.1. Global Traction Transformer Market Analysis and Forecast
2.2. Regional Outline
2.3. Market Dynamics Snapshot
2.4. Competition Blueprint
3. Market Dynamics
3.1. Macro-economic Factors
3.2. Key Market Indicator
3.3. Drivers
3.3.1. Economic Drivers
3.3.2. Supply Side Drivers
3.3.3. Demand Side Drivers
3.4. Market Restraints and Opportunities
3.5. Market Trends
3.5.1. Demand Side
3.5.2. Supply Side
3.6. Regulatory Framework
4. Associated Industry and Key Indicator Assessment
4.1. Parent Industry Overview
4.2. Impact of Covid-19 Pandemic
4.3. Supply Chain Analysis
4.4. Type Roadmap Analysis
4.5. Industry SWOT Analysis
4.6. Porter Five Forces Analysis
5. Global Traction Transformer Market Analysis, by Type
5.1. Global Traction Transformer Market Size (US$ Mn and Million Units) Analysis & Forecast, by Type, 2017‒2031
5.1.1. Tap Changing
5.1.2. Tapped
5.1.3. Rectifier
5.2. Market Attractiveness Analysis, by Type
6. Global Traction Transformer Market Analysis, by Line Voltage
6.1. Global Traction Transformer Market Size (US$ Mn and Million Units) Analysis & Forecast, by Line Voltage, 2017‒2031
6.1.1. AC
6.1.1.1. 1.2 KV
6.1.1.2. 15 KV
6.1.1.3. 20 KV
6.1.1.4. 25KV
6.1.1.5. Above 25KV
6.1.2. DC
6.1.2.1. 0.75 KV
6.1.2.2. 1.5KV
6.1.2.3. 3 KV
6.1.2.4. Above 3KV
6.2. Global Traction Transformer Market Attractiveness Analysis, by Line Voltage
7. Global Traction Transformer Market Analysis, by Application
7.1. Global Traction Transformer Market Size (US$ Mn) Analysis & Forecast, by Type, 2017‒2031
7.1.1. High-speed commuter & Regional
7.1.2. Trains
7.1.3. Electric Locomotive
7.1.4. Electrical Multiple Units (EMUS)
7.1.5. Tram Trains
7.1.6. Metros
7.1.7. Diesel Locomotive
7.2. Global Traction Transformer Market Attractiveness Analysis, by Application
8. Global Traction Transformer Market Analysis, by Mounting Location
8.1. Global Traction Transformer Market Size (US$ Mn) Analysis & Forecast, by Mounting Location, 2017‒2031
8.1.1. Machine Room
8.1.2. Roof
8.1.3. Underframe
8.2. Global Traction Transformer Market Attractiveness Analysis, by Mounting Location
9. Global Traction Transformer Market Analysis and Forecast, by Region
9.1. Global Traction Transformer Market Size (US$ Mn and Million Units) Analysis & Forecast, by Region, 2017 – 2031
9.1.1. North America
9.1.2. Europe
9.1.3. Asia Pacific
9.1.4. Middle East & Africa
9.1.5. South America
9.2. Global Traction Transformer Market Attractiveness Analysis, by Region
10. North America Traction Transformer Market Analysis and Forecast
10.1. Market Snapshot
10.2. Key Trends Analysis
10.3. Drivers and Restraints: Impact Analysis
10.4. Pricing Analysis
10.5. Key Regulations
10.6. North America Traction Transformer Market Size (US$ Mn and Million Units) Analysis & Forecast, by Type, 2017‒2031
10.6.1. Tap Changing
10.6.2. Tapped
10.6.3. Rectifier
10.7. North America Traction Transformer Market Size (US$ Mn and Million Units) Analysis & Forecast, by Line Voltage, 2017‒2031
10.7.1. AC
10.7.1.1. 1.2 KV
10.7.1.2. 15 KV
10.7.1.3. 20 KV
10.7.1.4. 25KV
10.7.1.5. Above 25KV
10.7.2. DC
10.7.2.1. 0.75 KV
10.7.2.2. 1.5KV
10.7.2.3. 3 KV
10.7.2.4. Above 3KV
10.8. North America Traction Transformer Market Size (US$ Mn) Analysis & Forecast, by Application, 2017‒2031
10.8.1. High-speed commuter & Regional
10.8.2. Trains
10.8.3. Electric Locomotive
10.8.4. Electrical Multiple Units (EMUS)
10.8.5. Tram Trains
10.8.6. Metros
10.8.7. Diesel Locomotive
10.9. North America Traction Transformer Market Size (US$ Mn) Analysis & Forecast, by Mounting Location, 2017‒2031
10.9.1. Machine Room
10.9.2. Roof
10.9.3. Underframe
10.10. North America Traction Transformer Market Size (US$ Mn and Million Units) Analysis & Forecast, by Country & Sub-region, 2017 – 2031
10.10.1. U.S.
10.10.2. Canada
10.10.3. Rest of North America
10.11. North America Traction Transformer Market Attractiveness Analysis
10.11.1. By Type
10.11.2. By Line Voltage
10.11.3. By Application
10.11.4. By Mounting Location
10.11.5. By Country & Sub-region
11. Europe Traction Transformer Market Analysis and Forecast
11.1. Market Snapshot
11.2. Key Trends Analysis
11.3. Drivers and Restraints: Impact Analysis
11.4. Pricing Analysis
11.5. Key Regulations
11.6. Europe Traction Transformer Market Size (US$ Mn and Million Units) Analysis & Forecast, by Type, 2017‒2031
11.6.1. Tap Changing
11.6.2. Tapped
11.6.3. Rectifier
11.7. Europe Traction Transformer Market Size (US$ Mn and Million Units) Analysis & Forecast, by Line Voltage, 2017‒2031
11.7.1. AC
11.7.1.1. 1.2 KV
11.7.1.2. 15 KV
11.7.1.3. 20 KV
11.7.1.4. 25KV
11.7.1.5. Above 25KV
11.7.2. DC
11.7.2.1. 0.75 KV
11.7.2.2. 1.5KV
11.7.2.3. 3 KV
11.7.2.4. Above 3KV
11.8. Europe Traction Transformer Market Size (US$ Mn) Analysis & Forecast, by Application, 2017‒2031
11.8.1. High-speed commuter & Regional
11.8.2. Trains
11.8.3. Electric Locomotive
11.8.4. Electrical Multiple Units (EMUS)
11.8.5. Tram Trains
11.8.6. Metros
11.8.7. Diesel Locomotive
11.9. Europe Traction Transformer Market Size (US$ Mn) Analysis & Forecast, by Mounting Location, 2017‒2031
11.9.1. Machine Room
11.9.2. Roof
11.9.3. Underframe
11.10. Europe Traction Transformer Market Size (US$ Mn and Million Units) Analysis & Forecast, by Country & Sub-region, 2017‒2031
11.10.1. U.K.
11.10.2. Germany
11.10.3. France
11.10.4. Italy
11.10.5. Russia
11.10.6. Rest of Europe
11.11. Europe Traction Transformer Market Attractiveness Analysis
11.11.1. By Type
11.11.2. By Line Voltage
11.11.3. By Application
11.11.4. By Mounting Location
11.11.5. By Country & Sub-region
12. Asia Pacific Traction Transformer Market Analysis and Forecast
12.1. Market Snapshot
12.2. Key Trends Analysis
12.3. Drivers and Restraints: Impact Analysis
12.4. Pricing Analysis
12.5. Key Regulations
12.6. Asia Pacific Traction Transformer Market Size (US$ Mn and Million Units) Analysis & Forecast, by Type, 2017‒2031
12.6.1. Tap Changing
12.6.2. Tapped
12.6.3. Rectifier
12.7. Asia Pacific Traction Transformer Market Size (US$ Mn and Million Units) Analysis & Forecast, by Line Voltage, 2017‒2031
12.7.1. AC
12.7.1.1. 1.2 KV
12.7.1.2. 15 KV
12.7.1.3. 20 KV
12.7.1.4. 25KV
12.7.1.5. Above 25KV
12.7.2. DC
12.7.2.1. 0.75 KV
12.7.2.2. 1.5KV
12.7.2.3. 3 KV
12.7.2.4. Above 3KV
12.8. Asia Pacific Traction Transformer Market Size (US$ Mn) Analysis & Forecast, by Application, 2017‒2031
12.8.1. High-speed commuter & Regional
12.8.2. Trains
12.8.3. Electric Locomotive
12.8.4. Electrical Multiple Units (EMUS)
12.8.5. Tram Trains
12.8.6. Metros
12.8.7. Diesel Locomotive
12.9. Asia Pacific Traction Transformer Market Size (US$ Mn) Analysis & Forecast, by Mounting Location, 2017‒2031
12.9.1. Machine Room
12.9.2. Roof
12.9.3. Underframe
12.10. Asia Pacific Traction Transformer Market Size (US$ Mn and Million Units) Analysis & Forecast, by Country & Sub-region, 2017‒2031
12.10.1. China Asia Pacific Traction Transformer
12.10.2. India
12.10.3. Japan
12.10.4. South Korea
12.10.5. ASEAN
12.10.6. Rest of Asia Pacific
12.11. Asia Pacific Traction Transformer Market Attractiveness Analysis
12.11.1. By Type
12.11.2. By Line Voltage
12.11.3. By Application
12.11.4. By Mounting Location
12.11.5. By Country & Sub-region
13. Middle East & Africa (MEA) Traction Transformer Market Analysis and Forecast
13.1. Market Snapshot
13.2. Key Trends Analysis
13.3. Drivers and Restraints: Impact Analysis
13.4. Pricing Analysis
13.5. Key Regulations
13.6. Middle East & Africa Traction Transformer Market Size (US$ Mn and Million Units) Analysis & Forecast, by Type, 2017‒2031
13.6.1. Tap Changing
13.6.2. Tapped
13.6.3. Rectifier
13.7. Middle East & Africa Traction Transformer Market Size (US$ Mn and Million Units) Analysis & Forecast, by Line Voltage, 2017‒2031
13.7.1. AC
13.7.1.1. 1.2 KV
13.7.1.2. 15 KV
13.7.1.3. 20 KV
13.7.1.4. 25KV
13.7.1.5. Above 25KV
13.7.2. DC
13.7.2.1. 0.75 KV
13.7.2.2. 1.5KV
13.7.2.3. 3 KV
13.7.2.4. Above 3KV
13.8. Middle East & Africa Traction Transformer Market Size (US$ Mn) Analysis & Forecast, by Application, 2017‒2031
13.8.1. High-speed commuter & Regional
13.8.2. Trains
13.8.3. Electric Locomotive
13.8.4. Electrical Multiple Units (EMUS)
13.8.5. Tram Trains
13.8.6. Metros
13.8.7. Diesel Locomotive
13.9. Middle East & Africa Traction Transformer Market Size (US$ Mn) Analysis & Forecast, by Mounting Location, 2017‒2031
13.9.1. Machine Room
13.9.2. Roof
13.9.3. Underframe
13.10. Middle East & Africa Traction Transformer Market Size (US$ Mn and Million Units) Analysis & Forecast, by Country & Sub-region, 2017‒2031
13.10.1. GCC
13.10.2. South Africa
13.10.3. North Africa
13.10.4. Rest of Middle East & Africa
13.11. Middle East & Africa Traction Transformer Market Attractiveness Analysis
13.11.1. By Type
13.11.2. By Line Voltage
13.11.3. By Application
13.11.4. By Mounting Location
13.11.5. By Country & Sub-region
14. South America Traction Transformer Market Analysis and Forecast
14.1. Market Snapshot
14.2. Key Trends Analysis
14.3. Drivers and Restraints: Impact Analysis
14.4. Pricing Analysis
14.5. Key Regulations
14.6. South America Traction Transformer Market Size (US$ Mn and Million Units) Analysis & Forecast, by Type, 2017‒2031
14.6.1. Tap Changing
14.6.2. Tapped
14.6.3. Rectifier
14.7. South America Traction Transformer Market Size (US$ Mn and Million Units) Analysis & Forecast, by Line Voltage, 2017‒2031
14.7.1. AC
14.7.1.1. 1.2 KV
14.7.1.2. 15 KV
14.7.1.3. 20 KV
14.7.1.4. 25KV
14.7.1.5. Above 25KV
14.7.2. DC
14.7.2.1. 0.75 KV
14.7.2.2. 1.5KV
14.7.2.3. 3 KV
14.7.2.4. Above 3KV
14.8. South America Traction Transformer Market Size (US$ Mn) Analysis & Forecast, by Application, 2017‒2031
14.8.1. High-speed commuter & Regional
14.8.2. Trains
14.8.3. Electric Locomotive
14.8.4. Electrical Multiple Units (EMUS)
14.8.5. Tram Trains
14.8.6. Metros
14.8.7. Diesel Locomotive
14.9. South America Traction Transformer Market Size (US$ Mn) Analysis & Forecast, by Mounting Location, 2017‒2031
14.9.1. Machine Room
14.9.2. Roof
14.9.3. Underframe
14.10. South America Traction Transformer Market Size (US$ Mn and Million Units) Analysis & Forecast, by Country & Sub-region, 2017‒2031
14.10.1. Brazil
14.10.2. Argentina
14.10.3. Rest of South America
14.11. South America Traction Transformer Market Attractiveness Analysis
14.11.1. By Type
14.11.2. By Line Voltage
14.11.3. By Application
14.11.4. By Mounting Location
14.11.5. By Country & Sub-region
15. Competition Assessment
15.1. Global Traction Transformer Market Competition Matrix - a Dashboard View
15.1.1. Global Traction Transformer Market Company Share Analysis, by Value (2020) and Volume
15.1.2. Technological Differentiator
16. Company Profiles (Manufacturers/Suppliers)
16.1. Hitachi ABB Power Grids Ltd
16.1.1. Overview
16.1.2. Product Portfolio
16.1.3. Sales Footprint
16.1.4. Key Subsidiaries or Distributors
16.1.5. Strategy and Recent Developments
16.1.6. Financial Analysis
16.2. Siemens AG
16.2.1. Overview
16.2.2. Product Portfolio
16.2.3. Sales Footprint
16.2.4. Key Subsidiaries or Distributors
16.2.5. Strategy and Recent Developments
16.2.6. Financial Analysis
16.3. Toshiba Corporation
16.3.1. Overview
16.3.2. Product Portfolio
16.3.3. Sales Footprint
16.3.4. Key Subsidiaries or Distributors
16.3.5. Strategy and Recent Developments
16.3.6. Financial Analysis
16.4. Mitsubishi Electric Corporation
16.4.1. Overview
16.4.2. Product Portfolio
16.4.3. Sales Footprint
16.4.4. Key Subsidiaries or Distributors
16.4.5. Strategy and Recent Developments
16.4.6. Financial Analysis
16.5. SPX Transformer Solutions Inc.
16.5.1. Overview
16.5.2. Product Portfolio
16.5.3. Sales Footprint
16.5.4. Key Subsidiaries or Distributors
16.5.5. Strategy and Recent Developments
16.5.6. Financial Analysis
16.6. MGM Transformer
16.6.1. Overview
16.6.2. Product Portfolio
16.6.3. Sales Footprint
16.6.4. Key Subsidiaries or Distributors
16.6.5. Strategy and Recent Developments
16.6.6. Financial Analysis
16.7. Neeltran
16.7.1. Overview
16.7.2. Product Portfolio
16.7.3. Sales Footprint
16.7.4. Key Subsidiaries or Distributors
16.7.5. Strategy and Recent Developments
16.7.6. Financial Analysis
16.8. Altrafo Srl
16.8.1. Overview
16.8.2. Product Portfolio
16.8.3. Sales Footprint
16.8.4. Key Subsidiaries or Distributors
16.8.5. Strategy and Recent Developments
16.8.6. Financial Analysis
16.9. Alstom SA
16.9.1. Overview
16.9.2. Product Portfolio
16.9.3. Sales Footprint
16.9.4. Key Subsidiaries or Distributors
16.9.5. Strategy and Recent Developments
16.9.6. Financial Analysis
16.10. JST Transformateurs
16.10.1. Overview
16.10.2. Product Portfolio
16.10.3. Sales Footprint
16.10.4. Key Subsidiaries or Distributors
16.10.5. Strategy and Recent Developments
16.10.6. Financial Analysis
17. Recommendation
17.1. Opportunity Assessment
17.1.1. By Type
17.1.2. By Line Voltage
17.1.3. By Application
17.1.4. By Mounting Location
17.1.5. By Region
List of Tables
Table 01: Global Traction Transformer Market Value (US$ Mn), by Type, 2017–2031
Table 02: Global Traction Transformer Market Volume (Units), by Type, 2017–2031
Table 03: Global Traction Transformer Market Value (US$ Mn), by Line Voltage, 2017–2031
Table 04: Global Traction Transformer Market Volume (Units), by Line Voltage, 2017–2031
Table 05: Global Traction Transformer Market Value (US$ Mn), by Application, 2017–2031
Table 06: Global Traction Transformer Market Value (US$ Mn), by Mounting Location, 2017–2031
Table 07: Global Traction Transformer Market Value (US$ Mn), by Region, 2017–2031
Table 08: Global Traction Transformer Market Volume (Units), by Region, 2017–2031
Table 09: North America Traction Transformer Market Value (US$ Mn), by Type, 2017–2031
Table 10: North America Traction Transformer Market Volume (Units), by Type, 2017–2031
Table 11: North America Traction Transformer Market Value (US$ Mn), by Line Voltage, 2017–2031
Table 12: North America Traction Transformer Market Volume (Units), by Line Voltage, 2017–2031
Table 13: North America Traction Transformer Market Value (US$ Mn), by Application, 2017–2031
Table 14: North America Traction Transformer Market Value (US$ Mn), by Mounting Location, 2017–2031
Table 15: North America Traction Transformer Market Value (US$ Mn), by Country & Sub-region, 2017–2031
Table 16: North America Traction Transformer Market Volume (Units), by Country & Sub-region, 2017–2031
Table 17: Europe Traction Transformer Market Value (US$ Mn), by Type, 2017–2031
Table 18: Europe Traction Transformer Market Volume (Units), by Type, 2017–2031
Table 19: Europe Traction Transformer Market Value (US$ Mn), by Line Voltage, 2017–2031
Table 20: Europe Traction Transformer Market Volume (Units), by Line Voltage, 2017–2031
Table 21: Europe Traction Transformer Market Value (US$ Mn), by Application, 2017–2031
Table 22: Europe Traction Transformer Market Value (US$ Mn), by Mounting Location, 2017–2031
Table 23: Europe Traction Transformer Market Value (US$ Mn), by Country & Sub-region, 2017–2031
Table 24: Europe Traction Transformer Market Volume (Units), by Country & Sub-region, 2017–2031
Table 25: Asia Pacific Traction Transformer Market Value (US$ Mn), by Type, 2017–2031
Table 26: Asia Pacific Traction Transformer Market Volume (Units), by Type, 2017–2031
Table 27: Asia Pacific Traction Transformer Market Value (US$ Mn), by Line Voltage, 2017–2031
Table 28: Asia Pacific Traction Transformer Market Volume (Units), by Line Voltage, 2017–2031
Table 29: Asia Pacific Traction Transformer Market Value (US$ Mn), by Application, 2017–2031
Table 30: Asia Pacific Traction Transformer Market Value (US$ Mn), by Mounting Location, 2017–2031
Table 31: Asia Pacific Traction Transformer Market Value (US$ Mn), by Country & Sub-region, 2017–2031
Table 32: Asia Pacific Traction Transformer Market Volume (Units), by Country & Sub-region, 2017–2031
Table 33: Middle East & Africa Traction Transformer Market Value (US$ Mn), by Type, 2017–2031
Table 34: Middle East & Africa Traction Transformer Market Volume (Units), by Type, 2017–2031
Table 35: Middle East & Africa Traction Transformer Market Value (US$ Mn), by Line Voltage, 2017–2031
Table 36: Middle East & Africa Traction Transformer Market Volume (Units), by Line Voltage, 2017–2031
Table 37: Middle East & Africa Traction Transformer Market Value (US$ Mn), by Application, 2017–2031
Table 38: Middle East & Africa Traction Transformer Market Value (US$ Mn), by Mounting Location, 2017–2031
Table 39: Middle East & Africa Traction Transformer Market Value (US$ Mn), by Country & Sub-region, 2017–2031
Table 40: Middle East & Africa Traction Transformer Market Volume (Units), by Country & Sub-region, 2017–2031
Table 41: South America Traction Transformer Market Value (US$ Mn), by Type, 2017–2031
Table 42: South America Traction Transformer Market Volume (Units), by Type, 2017–2031
Table 43: South America Traction Transformer Market Value (US$ Mn), by Line Voltage, 2017–2031
Table 44: South America Traction Transformer Market Volume (Units), by Line Voltage, 2017–2031
Table 45: South America Traction Transformer Market Value (US$ Mn), by Application, 2017–2031
Table 46: South America Traction Transformer Market Value (US$ Mn), by Mounting Location, 2017–2031
Table 47: South America Traction Transformer Market Value (US$ Mn), by Country & Sub-region, 2017–2031
Table 48: South America Traction Transformer Market Volume (Units), by Country & Sub-region, 2017–2031
List of Figures
Figure 01: Global Traction Transformer Market Value (US$ Mn) Forecast, 2021–2031
Figure 02: Global Traction Transformer Market, by Tap Changing
Figure 03: Global Traction Transformer Market, by Tapped
Figure 04: Global Traction Transformer Market, by Rectifier
Figure 05: Global Traction Transformer Market Attractiveness Analysis, by Type
Figure 06: Global Traction Transformer Market, by AC
Figure 07: Global Traction Transformer Market, by DC
Figure 08: Global Traction Transformer Market Attractiveness Analysis, by Line Voltage
Figure 09: Global Traction Transformer Market, by High-speed commuter & Regional Trains
Figure 10: Global Traction Transformer Market, by Electric Locomotive
Figure 11: Global Traction Transformer Market, by Electrical Multiple Units (EMUS)
Figure 12: Global Traction Transformer Market, by Tram Trains
Figure 13: Global Traction Transformer Market, by Metros
Figure 14: Global Traction Transformer Market, by Diesel Locomotive
Figure 15: Global Traction Transformer Market Attractiveness Analysis, by Application
Figure 16: Global Traction Transformer Market, by Machine Room
Figure 17: Global Traction Transformer Market, by Roof
Figure 18: Global Traction Transformer Market, by Underframe
Figure 19: Global Traction Transformer Market Attractiveness Analysis, by Mounting Location
Figure 20: Global Traction Transformer Market Value Share Analysis, by Region (2021E)
Figure 21: Global Traction Transformer Market Value Share Analysis, by Region (2031F)
Figure 22: Global Traction Transformer Market Volume Share Analysis, by Region (2021E)
Figure 23: Global Traction Transformer Market Volume Share Analysis, by Region (2031F)
Figure 24: Global Traction Transformer Market Attractiveness Analysis, by Region
Figure 25: North America Traction Transformer Market Size Analysis (2017-2020) and Forecast (2021‒2031)
Figure 26: North America Traction Transformer Market Value (US$ Mn) Forecast, 2017–2031
Figure 27: North America Traction Transformer Market Y-o-Y Growth Projection, 2021–2031
Figure 28: North America Traction Transformer Market Volume (Units) Forecast, 2017–2031
Figure 29: North America Traction Transformer Market Y-o-Y Growth Projection, 2021–2031
Figure 30: North America Traction Transformer Market Value Share Analysis, by Type (2021)
Figure 31: North America Traction Transformer Market Value Share Analysis, by Type (2031)
Figure 32: North America Traction Transformer Market Volume Share Analysis, by Type (2021)
Figure 33: North America Traction Transformer Market Volume Share Analysis, by Type (2031)
Figure 34: North America Traction Transformer Market Value Share Analysis, by Line Voltage (2021)
Figure 35: North America Traction Transformer Market Value Share Analysis, by Line Voltage (2031)
Figure 36: North America Traction Transformer Market Volume Share Analysis, by Line Voltage (2021)
Figure 37: North America Traction Transformer Market Volume Share Analysis, by Line Voltage (2031)
Figure 38: North America Traction Transformer Market Value Share Analysis, by Application (2021)
Figure 39: North America Traction Transformer Market Value Share Analysis, by Application (2031)
Figure 40: North America Traction Transformer Market Value Share Analysis, by Mounting Location (2021)
Figure 41: North America Traction Transformer Market Value Share Analysis, by Mounting Location (2031)
Figure 42: North America Traction Transformer Market Value Share Analysis, by Country & Sub-region (2021)
Figure 43: North America Traction Transformer Market Value Share Analysis, by Country & Sub-region (2031)
Figure 44: North America Traction Transformer Market Volume Share Analysis, by Country & Sub-region (2021)
Figure 45: North America Traction Transformer Market Volume Share Analysis, by Country & Sub-region (2031)
Figure 46: North America Traction Transformer Market Attractiveness Analysis, by Type
Figure 47: North America Traction Transformer Market Attractiveness Analysis, by Line Voltage
Figure 48: North America Traction Transformer Market Attractiveness Analysis, by Application
Figure 49: North America Traction Transformer Market Attractiveness Analysis, by Mounting Location
Figure 50: North America Traction Transformer Market Attractiveness Analysis, by Country & Sub-region
Figure 51: North America Traction Transformer Market Size Analysis (2017-2020) and Forecast (2021-2031)
Figure 52: Europe Traction Transformer Market Value (US$ Mn) Forecast, 2017–2031
Figure 53: Europe Traction Transformer Market Y-o-Y Growth Projection, 2021–2031
Figure 54: Europe Traction Transformer Market Volume (Units) Forecast, 2017–2031
Figure 55: Europe Traction Transformer Market Y-o-Y Growth Projection, 2021–2031
Figure 56: Europe Traction Transformer Market Value Share Analysis, by Type (2021)
Figure 57: Europe Traction Transformer Market Value Share Analysis, by Type (2031)
Figure 58: Europe Traction Transformer Market Volume Share Analysis, by Type (2021)
Figure 59: Europe Traction Transformer Market Volume Share Analysis, by Type (2031)
Figure 60: Europe Traction Transformer Market Value Share Analysis, by Line Voltage (2021)
Figure 61: Europe Traction Transformer Market Value Share Analysis, by Line Voltage (2031)
Figure 62: Europe Traction Transformer Market Volume Share Analysis, by Line Voltage (2021)
Figure 63: Europe Traction Transformer Market Volume Share Analysis, by Line Voltage (2031)
Figure 64: Europe Traction Transformer Market Value Share Analysis, by Application (2021)
Figure 65: Europe Traction Transformer Market Value Share Analysis, by Application (2031)
Figure 66: Europe Traction Transformer Market Value Share Analysis, by Mounting Location (2021)
Figure 67: Europe Traction Transformer Market Value Share Analysis, by Mounting Location (2031)
Figure 68: Europe Traction Transformer Market Value Share Analysis, by Country & Sub-region (2021)
Figure 69: Europe Traction Transformer Market Value Share Analysis, by Country & Sub-region (2031)
Figure 70: Europe Traction Transformer Market Volume Share Analysis, by Country & Sub-region (2021)
Figure 71: Europe Traction Transformer Market Volume Share Analysis, by Country & Sub-region (2031)
Figure 72: Europe Traction Transformer Market Attractiveness Analysis, by Type
Figure 73: Europe Traction Transformer Market Attractiveness Analysis, by Line Voltage
Figure 74: Europe Traction Transformer Market Attractiveness Analysis, by Application
Figure 75: Europe Traction Transformer Market Attractiveness Analysis, by Mounting Location
Figure 76: Europe Traction Transformer Market Attractiveness Analysis, by Country & Sub-region
Figure 77: Asia Pacific Traction Transformer Market Size Analysis (2017-2020) and Forecast (2021-2031)
Figure 78: Asia Pacific Traction Transformer Market Value (US$ Mn) Forecast, 2017–2031
Figure 79: Asia Pacific Traction Transformer Market Y-o-Y Growth Projection, 2021–2031
Figure 80: Asia Pacific Traction Transformer Market Volume (Units) Forecast, 2017–2031
Figure 81: Asia Pacific Traction Transformer Market Y-o-Y Growth Projection, 2021–2031
Figure 82: Asia Pacific Traction Transformer Market Value Share Analysis, by Type (2021)
Figure 83: Asia Pacific Traction Transformer Market Value Share Analysis, by Type (2031)
Figure 84: Asia Pacific Traction Transformer Market Volume Share Analysis, by Type (2021)
Figure 85: Asia Pacific Traction Transformer Market Volume Share Analysis, by Type (2031)
Figure 86: Asia Pacific Traction Transformer Market Value Share Analysis, by Line Voltage (2021)
Figure 87: Asia Pacific Traction Transformer Market Value Share Analysis, by Line Voltage (2031)
Figure 88: Asia Pacific Traction Transformer Market Volume Share Analysis, by Line Voltage (2021)
Figure 89: Asia Pacific Traction Transformer Market Volume Share Analysis, by Line Voltage (2031)
Figure 90: Asia Pacific Traction Transformer Market Value Share Analysis, by Application (2021)
Figure 91: Asia Pacific Traction Transformer Market Value Share Analysis, by Application (2031)
Figure 92: Asia Pacific Traction Transformer Market Value Share Analysis, by Mounting Location (2021)
Figure 93: Asia Pacific Traction Transformer Market Value Share Analysis, by Mounting Location (2031)
Figure 94: Asia Pacific Traction Transformer Market Value Share Analysis, by Country & Sub-region (2021)
Figure 95: Asia Pacific Traction Transformer Market Value Share Analysis, by Country & Sub-region (2031)
Figure 96: Asia Pacific Traction Transformer Market Volume Share Analysis, by Country & Sub-region (2021)
Figure 97: Asia Pacific Traction Transformer Market Volume Share Analysis, by Country & Sub-region (2031)
Figure 98: Asia Pacific Traction Transformer Market Attractiveness Analysis, by Type
Figure 99: Asia Pacific Traction Transformer Market Attractiveness Analysis, by Line Voltage
Figure 100: Asia Pacific Traction Transformer Market Attractiveness Analysis, by Application
Figure 101: Asia Pacific Traction Transformer Market Attractiveness Analysis, by Mounting Location
Figure 102: Asia Pacific Traction Transformer Market Attractiveness Analysis, by Country & Sub-region
Figure 103: Middle East & Africa Traction Transformer Market Size Analysis (2017-2020) and Forecast (2021-2031)
Figure 104: Middle East & Africa Traction Transformer Market Value (US$ Mn) Forecast, 2017–2031
Figure 105: Middle East & Africa Traction Transformer Market Y-o-Y Growth Projection, 2021–2031
Figure 106: Middle East & Africa Traction Transformer Market Volume (Units) Forecast, 2017–2031
Figure 107: Middle East & Africa Traction Transformer Market Y-o-Y Growth Projection, 2021–2031
Figure 108: Middle East & Africa Traction Transformer Market Value Share Analysis, by Type (2021)
Figure 109: Middle East & Africa Traction Transformer Market Value Share Analysis, by Type (2031)
Figure 110: Middle East & Africa Traction Transformer Market Volume Share Analysis, by Type (2021)
Figure 111: Middle East & Africa Traction Transformer Market Volume Share Analysis, by Type (2031)
Figure 112: Middle East & Africa Traction Transformer Market Value Share Analysis, by Line Voltage (2021)
Figure 113: Middle East & Africa Traction Transformer Market Value Share Analysis, by Line Voltage (2031)
Figure 114: Middle East & Africa Traction Transformer Market Volume Share Analysis, by Line Voltage (2021)
Figure 115: Middle East & Africa Traction Transformer Market Volume Share Analysis, by Line Voltage (2031)
Figure 116: Middle East & Africa Traction Transformer Market Value Share Analysis, by Application (2021)
Figure 117: Middle East & Africa Traction Transformer Market Value Share Analysis, by Application (2031)
Figure 118: Middle East & Africa Traction Transformer Market Value Share Analysis, by Mounting Location (2021)
Figure 119: Middle East & Africa Traction Transformer Market Value Share Analysis, by Mounting Location (2031)
Figure 120: Middle East & Africa Traction Transformer Market Value Share Analysis, by Country & Sub-region (2021)
Figure 121: Middle East & Africa Traction Transformer Market Value Share Analysis, by Country & Sub-region (2031)
Figure 122: Middle East & Africa Traction Transformer Market Volume Share Analysis, by Country & Sub-region (2021)
Figure 123: Middle East & Africa Traction Transformer Market Volume Share Analysis, by Country & Sub-region (2031)
Figure 124: Middle East & Africa Traction Transformer Market Attractiveness Analysis, by Type
Figure 125: Middle East & Africa Traction Transformer Market Attractiveness Analysis, by Line Voltage
Figure 126: Middle East & Africa Traction Transformer Market Attractiveness Analysis, by Application
Figure 127: Middle East & Africa Traction Transformer Market Attractiveness Analysis, by Mounting Location
Figure 128: Middle East & Africa Traction Transformer Market Attractiveness Analysis, by Country & Sub-region
Figure 129: South America Traction Transformer Market Size Analysis (2017-2020) and Forecast (2021-2031)
Figure 130: South America Traction Transformer Market Value (US$ Mn) Forecast, 2017–2031
Figure 131: South America Traction Transformer Market Y-o-Y Growth Projection, 2021–2031
Figure 132: South America Traction Transformer Market Volume (Units) Forecast, 2017–2031
Figure 133: South America Traction Transformer Market Y-o-Y Growth Projection, 2021–2031
Figure 134: South America Traction Transformer Market Value Share Analysis, by Type (2021)
Figure 135: South America Traction Transformer Market Value Share Analysis, by Type (2031)
Figure 136: South America Traction Transformer Market Volume Share Analysis, by Type (2021)
Figure 137: South America Traction Transformer Market Volume Share Analysis, by Type (2031)
Figure 138: South America Traction Transformer Market Value Share Analysis, by Line Voltage (2021)
Figure 139: South America Traction Transformer Market Value Share Analysis, by Line Voltage (2031)
Figure 140: South America Traction Transformer Market Volume Share Analysis, by Line Voltage (2021)
Figure 141: South America Traction Transformer Market Volume Share Analysis, by Line Voltage (2031)
Figure 142: South America Traction Transformer Market Value Share Analysis, by Application (2021)
Figure 143: South America Traction Transformer Market Value Share Analysis, by Application (2031)
Figure 144: South America Traction Transformer Market Value Share Analysis, by Mounting Location (2021)
Figure 145: South America Traction Transformer Market Value Share Analysis, by Mounting Location (2031)
Figure 146: South America Traction Transformer Market Value Share Analysis, by Country & Sub-region (2021)
Figure 147: South America Traction Transformer Market Value Share Analysis, by Country & Sub-region (2031)
Figure 148: South America Traction Transformer Market Volume Share Analysis, by Country & Sub-region (2021)
Figure 149: South America Traction Transformer Market Volume Share Analysis, by Country & Sub-region (2031)
Figure 150: South America Traction Transformer Market Attractiveness Analysis, by Type
Figure 151: South America Traction Transformer Market Attractiveness Analysis, by Line Voltage
Figure 152: South America Traction Transformer Market Attractiveness Analysis, by Application
Figure 153: South America Traction Transformer Market Attractiveness Analysis, by Mounting Location
Figure 154: South America Traction Transformer Market Attractiveness Analysis, by Country & Sub-region
Figure 155: Global Traction Transformer Market Share Analysis, by Company
Copyright © Transparency Market Research, Inc. All Rights reserved
Trust Online

Traction Transformer Market Growth, Forecast 2021-2031
