Analysts’ Viewpoint on post-operative Pain Therapeutics Market Scenario
The number of surgeries requiring post-surgical pain management medications is increasing across the globe. Despite efforts to improve the provision of perioperative analgesics, the number of patients suffering from moderate to severe pain after surgery has been constant in the last decade. Opioid analgesics provide effective treatment for post-operative chronic pain; however, their usage is limited owing to side-effects such as vomiting, nausea, respiratory depression, and constipation. Hence, third-party payers and hospitals, including Medicare, Integrated Delivery Systems (IDNs), and Medicaid, are showing interest in new non-opioid pain therapies that offer effective post-operative pain relief without the adverse effects. NSAIDs and local anesthetics are effective substitutes for the relief of moderate to severe pain without the risks associated with opioids. Several pharmaceutical companies are manufacturing and marketing therapeutics in the global market to gain revenue benefits.
According to research conducted by the National Center for Health Statistics, a U.S. Government agency, more than 100 million surgeries are performed in the U.S. each year. Of these, at least 50 million procedures require post-surgical pain management medications. The global post-operative pain therapeutics market is projected to grow at a steady pace during the forecast period owing to advanced product development and high incidence and severity of postoperative pain. Furthermore, surge in geriatric population and introduction of promising drugs across the globe are driving the global post-operative pain therapeutics market forecast. Recently approved post-surgical pain medications such as ANJESO and ZYNRELEF have demonstrated the potential to relieve chronic pain without any side-effects. According to an article published on NCBI, in 2019, around 75% of patients who had a surgery experienced acute postoperative pain, which was often moderate to severe. Just about half of patients who have surgery report adequate postoperative pain relief. This percentage is significant, as inadequate postoperative pain control can cause adverse physiologic effects in patients in the immediate postoperative period and put them at risk of developing chronic pain from the procedure.
Introduction of various new drugs is projected to drive the global post-operative pain therapeutics market in the next few years. New drugs are being developed with wide safety margins and favorable profiles. Advancements in non-opioid alternatives and adjuncts have gained importance in controlling post-operative pain. For instance, intravenous (IV) acetaminophen, non-steroidal anti-inflammatory drugs (NSAIDs), magnesium, ketamine, dexmedetomidine, and liposomal bupivacaine are some of the drugs that have gained traction in the postoperative pain therapeutics market. Several non-opioid alternatives and adjuncts, including intravenous (IV) acetaminophen, dexmedetomidine, and liposomal bupivacaine, have gained significance in controlling post-surgical pain.
Several drug makers are coming up with novel products. In December 2021, Heron Therapeutics, Inc., a commercial-stage biotechnology firm, announced the FDA approval for ZYNRELEF (bupivacaine/meloxicam). ZYNRELEF can be used for adults for soft tissue (periarticular) instillation to produce postsurgical analgesia after small or medium open abdominal, foot, and ankle surgical procedures. In March 2022, Health Canada, a government authority responsible for national health policy, issued a notice of compliance to commercialize ZYNRELEF as post-surgical analgesia after open inguinal herniorrhaphy, bunionectomy, and other surgeries. In March 2021, Virpax Pharmaceuticals, a U.S.-based publicly-held specialty pharmaceutical company, announced it would initiate Investigational New Drug (IND) Enabling Studies for Probudur for post-surgical pain management. Thus, the launch of innovative products is expected to drive the post-operative pain therapeutics market during the forecast period.
The number of orthopedic surgeries performed globally has increased in the last few decades. Each year, around 500,000 knee replacements and more than 175,000 hip replacements are performed globally. Hence, increase in incidence of orthopedic surgeries is projected to drive the demand for medications, especially effective post-surgical pain medicines. This, in turn, is anticipated to augment the global market during the forecast period. Additionally, surge in prevalence of gynecological diseases and rise in awareness about these diseases are expected to increase the number of surgeries, which is likely to create significant opportunities in the global post-operative pain therapeutics market. Continuous innovations and developments in the field of post-operative pain therapeutics industry are also estimated to boost the post-operative pain therapeutics market size during the forecast period.
In terms of drug class, the global post-operative pain therapeutics market has been classified into NSAIDs, opioids, local anesthetics, antiepileptic drugs, tricyclic antidepressants, and others. The local anesthetics segment is projected to grow at a rapid pace during the forecast period. Introduction of new and effective drugs such as articaine, levobupivacaine, and ropivacaine is expected to propel the segment in the next few years. Furthermore, the local anesthetics segment is driven by the approval of new anesthetic drugs, surge in number of surgeries globally, and rise in R&D investment.
Based on route of administration, the global post-operative pain therapeutics market has been divided into oral, intravenous, intramuscular, and others. The oral segment held prominent share of the global market in 2021. Oral administration is the most convenient, safest, and simplest mode of drug administration. It is convenient for prolonged and repeated use. It can be self-administered, and is pain-free. However, the intravenous segment is projected to grow at the fastest CAGR from 2017 to 2031. Major technological innovations in the medical sector along with the emergence of effective analgesic drugs is augmenting the segment.
In terms of distribution channel, the global post-operative pain therapeutics market has been divided into hospital pharmacies, retail pharmacies, online pharmacies, and others. The online pharmacies segment is expected to grow at a high CAGR during the forecast period. Online pharmacies (e-pharmacies) sell medicine to customers over mail or through shipping services. Online drug purchases have increased as a result of the pandemic-induced lockdowns/shutdowns. Customers have been flocking online pharmacies, demonstrating a keen interest in online medicine purchases. Businesses and customers prefer contactless delivery because of the COVID-19 induced restrictions. This has become the new normal during the pandemic and is expected to continue even after the pandemic. However, the hospital pharmacies segment is projected to account for the largest share of the global post-operative pain management therapeutics market during the forecast period. In the U.S., around 3.4 million hospital inpatients require post-operative pain medications each year.
The U.S. accounted for the major share of around 40.0% of the global post-operative pain therapeutics market in 2021. The market in the country is projected to grow at a steady pace during the forecast period, primarily due to well-established healthcare infrastructure, rise in number of surgeries, favorable reimbursement policies, and significant healthcare expenditure. Additionally, presence of well-established and startup companies, such as Mallinckrodt plc, Johnson & Johnson, Cumberland Pharmaceuticals, Inc., Pacira Pharmaceuticals, Inc., Trevena, Inc., AcelRx Pharmaceuticals, Inc., Innocoll Holdings plc, and Heron Therapeutics, Inc., offers significant opportunities to the market in the U.S.
The European Union (EU5) held the second largest share of the global market in 2021. The post-operative pain therapeutics market in the European Union (EU5) is driven by the increase in open surgeries. Furthermore, supportive government policies for novel drug discovery are driving the post-operative pain therapeutics market in EU5.
Latin America is a larger market for post-operative pain therapeutics than Middle East & Africa. The market in Latin America is projected to grow at a faster pace than that in Middle East & Africa during the forecast period.
The global post-operative pain therapeutics market is consolidated, with the presence of small number of leading players. Most of the companies are investing significantly in research & development activities, primarily to introduce advanced post-operative pain therapeutics. Furthermore, strategic alliances between key players to increase revenue and market share are augmenting the global market. Diversification of product portfolios and mergers & acquisitions are the key strategies adopted by the leading players. The global post-operative pain therapeutics market report includes various sections such as post-operative pain therapeutics drivers, post-operative pain therapeutics analysis, and challenges and opportunities in the post-operative pain therapeutics market. Mallinckrodt Pharmaceuticals, Pfizer, Inc., Novartis AG, Eli Lilly and Company, Teva Pharmaceutical Industries Ltd., Camurus AB, Bayer AG, Pacira BioSciences, Inc., and Trevena, Inc. are the prominent players operating in the global post-operative pain therapeutics market.
Each of these players has been profiled in the post-operative pain therapeutics market report based on parameters such as company overview, financial overview, business strategies, product portfolio, business segments, and recent developments.
|
Attribute |
Detail |
|
Market Size Value in 2021 |
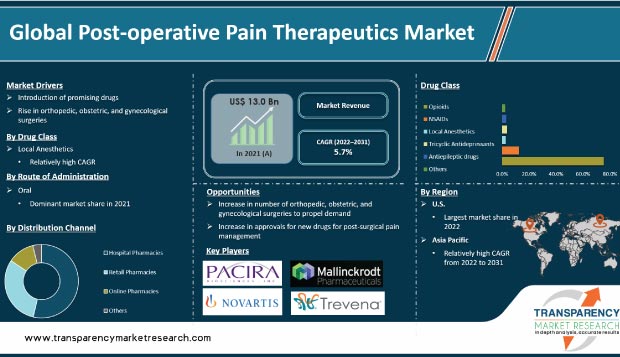
US$ 13.0 Bn |
|
Market Forecast Value in 2031 |
More than US$ 22.3 Bn |
|
Growth Rate (CAGR) |
5.7% |
|
Forecast Period |
2022–2031 |
|
Historical Data Available for |
2017–2021 |
|
Quantitative Units |
US$ Bn for Value |
|
Market Analysis |
It includes segment analysis as well as regional level analysis. Moreover, qualitative analysis includes drivers, restraints, opportunities, key trends, and key trend analysis. |
|
Competition Landscape |
|
|
Format |
Electronic (PDF) + Excel |
|
Market Segmentation |
|
|
Regions Covered |
|
|
Countries Covered |
|
|
Companies Profiled |
|
|
Customization Scope |
Available upon request |
|
Pricing |
Available upon request |
The global post-operative pain therapeutics market was valued at US$ 13.0 Bn in 2021
The global post-operative pain therapeutics market is projected to reach more than US$ 22.3 Bn by 2031
The global post-operative pain therapeutics market contracted at a CAGR of 3.1% from 2017 to 2021
The global post-operative pain therapeutics market is anticipated to grow at a CAGR of 5.7% from 2022 to 2031
Introduction of promising drugs and rise in orthopedic, obstetric, and gynecological surgeries are the key factors driving the global post-operative pain therapeutics market
The opioids segment held over 65% share of the global post-operative pain therapeutics market in 2021
Mallinckrodt Pharmaceuticals, Pfizer, Inc., Novartis AG, Eli Lilly and Company, Teva Pharmaceutical Industries Ltd., Camurus AB, Bayer AG, Pacira BioSciences, Inc., and Trevena, Inc.
1. Preface
1.1. Market Definition and Scope
1.2. Market Segmentation
1.3. Key Research Objectives
1.4. Research Highlights
2. Assumptions and Research Methodology
3. Executive Summary: Global Post-operative Pain Therapeutics Market
4. Market Overview
4.1. Introduction
4.1.1. Segment Definition
4.2. Overview
4.3. Market Dynamics
4.3.1. Drivers
4.3.2. Restraints
4.3.3. Opportunities
5. Key Insights
5.1. No. of Surgical Procedure Volume, (Orthopedic Surgery, General Surgery, Plastic Surgery, Gynecological Surgery, Ophthalmic Surgery etc.), 2020-2021
5.1.1. North America (U.S. and Canada)
5.1.2. European Union (Germany, U.K. France, Italy and Spain)
5.1.3. Asia Pacific (Japan, China, India, Singapore and Korea)
5.1.4. Latin America (Brazil, Mexico and Argentina)
5.2. Product Analysis- Packaging, Size, and Price
5.3. Key Industry Development
5.4. Pipeline Analysis
5.5. Regulatory Scenario Assessment
5.6. Overview of Total Surgical Procedures Requiring Postoperative Management
5.6.1. U.S. Surgical Procedures Requiring Postoperative Pain Management
5.7. COVID-19 Impact Analysis
6. Global Post-operative Pain Therapeutics Market Analysis and Forecast, by Drug Class
6.1. Introduction & Definition
6.2. Key Findings / Developments
6.3. Market Value Forecast, by Drug Class, 2017–2031
6.3.1. Opioids
6.3.2. NSAIDs
6.3.3. Local Anesthetics
6.3.4. Tricyclic Antidepressants
6.3.5. Antiepileptic Drugs
6.3.6. Others
6.4. Market Attractiveness Analysis, by Drug Class
7. Global Post-operative Pain Therapeutics Market Analysis and Forecast, by Route of Administration
7.1. Introduction & Definition
7.2. Key Findings / Developments
7.3. Market Value Forecast, by Route of Administration, 2017–2031
7.3.1. Oral
7.3.2. Intravenous
7.3.3. Intramuscular
7.3.4. Others
7.4. Market Attractiveness Analysis, by Route of Administration
8. Global Post-operative Pain Therapeutics Market Analysis and Forecast, by Distribution Channel
8.1. Introduction & Definition
8.2. Key Findings / Developments
8.3. Market Value Forecast, by Distribution Channel, 2017–2031
8.3.1. Hospital Pharmacies
8.3.2. Retail Pharmacies
8.3.3. Online Pharmacies
8.3.4. Others
8.4. Market Attractiveness Analysis, by Distribution Channel
9. Global Post-operative Pain Therapeutics Market Analysis and Forecast, by Region
9.1. Key Findings
9.2. Market Value Forecast, by Region
9.2.1. U.S.
9.2.2. European Union (EU5)
9.2.3. Asia Pacific
9.2.4. Latin America
9.2.5. Rest of the World (RoW)
9.3. Market Attractiveness Analysis, by Region
10. U.S. Post-operative Pain Therapeutics Market Analysis and Forecast
10.1. Introduction
10.1.1. Key Findings
10.2. Market Value Forecast, by Drug Class, 2017–2031
10.2.1. Opioids
10.2.2. NSAIDs
10.2.3. Local Anesthetics
10.2.4. Tricyclic Antidepressants
10.2.5. Antiepileptic Drugs
10.2.6. Others
10.3. Market Value Forecast, by Route of Administration, 2017–2031
10.3.1. Oral
10.3.2. Intravenous
10.3.3. Intramuscular
10.3.4. Others
10.4. Market Value Forecast, by Distribution Channel, 2017–2031
10.4.1. Hospital Pharmacies
10.4.2. Retail Pharmacies
10.4.3. Online Pharmacies
10.4.4. Others
10.5. Market Value Forecast, by Country, 2017–2031
10.6. Market Attractiveness Analysis
10.6.1. By Drug Class
10.6.2. By Route of Administration
10.6.3. By Distribution Channel
11. European Union (EU5) Post-operative Pain Therapeutics Market Analysis and Forecast
11.1. Introduction
11.1.1. Key Findings
11.2. Market Value Forecast, by Drug Class, 2017–2031
11.2.1. Opioids
11.2.2. NSAIDs
11.2.3. Local Anesthetics
11.2.4. Tricyclic Antidepressants
11.2.5. Antiepileptic Drugs
11.2.6. Others
11.3. Market Value Forecast, by Route of Administration, 2017–2031
11.3.1. Oral
11.3.2. Intravenous
11.3.3. Intramuscular
11.3.4. Others
11.4. Market Value Forecast, by Distribution Channel, 2017–2031
11.4.1. Hospital Pharmacies
11.4.2. Retail Pharmacies
11.4.3. Online Pharmacies
11.4.4. Others
11.5. Market Value Forecast, by Country, 2017–2031
11.5.1. Germany
11.5.2. France
11.5.3. U.K.
11.5.4. Italy
11.5.5. Spain
11.6. Market Attractiveness Analysis
11.6.1. By Drug Class
11.6.2. By Route of Administration
11.6.3. By Distribution Channel
11.6.4. By Country
12. Asia Pacific Post-operative Pain Therapeutics Market Analysis and Forecast
12.1. Introduction
12.1.1. Key Findings
12.2. Market Value Forecast, by Drug Class, 2017–2031
12.2.1. Opioids
12.2.2. NSAIDs
12.2.3. Local Anesthetics
12.2.4. Tricyclic Antidepressants
12.2.5. Antiepileptic Drugs
12.2.6. Others
12.3. Market Value Forecast, by Route of Administration, 2017–2031
12.3.1. Oral
12.3.2. Intravenous
12.3.3. Intramuscular
12.3.4. Others
12.4. Market Value Forecast, by Distribution Channel, 2017–2031
12.4.1. Hospital Pharmacies
12.4.2. Retail Pharmacies
12.4.3. Online Pharmacies
12.4.4. Others
12.5. Market Value Forecast, by Country, 2017–2031
12.5.1. China
12.5.2. Japan
12.5.3. South Korea
12.5.4. Singapore
12.6. Market Attractiveness Analysis
12.6.1. By Drug Class
12.6.2. By Route of Administration
12.6.3. By Distribution Channel
12.6.4. By Country
13. Latin America Post-operative Pain Therapeutics Market Analysis and Forecast
13.1. Introduction
13.1.1. Key Findings
13.2. Market Value Forecast, by Drug Class, 2017–2031
13.2.1. Opioids
13.2.2. NSAIDs
13.2.3. Local Anesthetics
13.2.4. Tricyclic Antidepressants
13.2.5. Antiepileptic Drugs
13.2.6. Others
13.3. Market Value Forecast, by Route of Administration, 2017–2031
13.3.1. Oral
13.3.2. Intravenous
13.3.3. Intramuscular
13.3.4. Others
13.4. Market Value Forecast, by Distribution Channel, 2017–2031
13.4.1. Hospital Pharmacies
13.4.2. Retail Pharmacies
13.4.3. Online Pharmacies
13.4.4. Others
13.5. Market Value Forecast, by Country, 2017–2031
13.5.1. Brazil
13.5.2. Argentina
13.5.3. Chile
13.6. Market Attractiveness Analysis
13.6.1. By Drug Class
13.6.2. By Route of Administration
13.6.3. By Distribution Channel
13.6.4. By Country
14. Rest of the World (RoW) Post-operative Pain Therapeutics Market Analysis and Forecast
14.1. Introduction
14.1.1. Key Findings
14.2. Market Value Forecast, by Drug Class, 2017–2031
14.2.1. Opioids
14.2.2. NSAIDs
14.2.3. Local Anesthetics
14.2.4. Tricyclic Antidepressants
14.2.5. Antiepileptic Drugs
14.2.6. Others
14.3. Market Value Forecast, by Route of Administration, 2017–2031
14.3.1. Oral
14.3.2. Intravenous
14.3.3. Intramuscular
14.3.4. Others
14.4. Market Value Forecast, by Distribution Channel, 2017–2031
14.4.1. Hospital Pharmacies
14.4.2. Retail Pharmacies
14.4.3. Online Pharmacies
14.4.4. Others
14.5. Market Value Forecast, by Country, 2017–2031
14.6. Market Attractiveness Analysis
14.6.1. By Drug Class
14.6.2. By Route of Administration
14.6.3. By Distribution Channel
15. Competition Landscape
15.1. Competitive Business Strategies
15.2. Company Profiles
15.2.1. Mallinckrodt Pharmaceuticals
15.2.1.1. Company Overview (HQ, Business Segments, Employee Strength)
15.2.1.2. Product Portfolio
15.2.1.3. SWOT Analysis
15.2.1.4. Strategic Overview
15.2.2. Pfizer, Inc.
15.2.2.1. Company Overview (HQ, Business Segments, Employee Strength)
15.2.2.2. Product Portfolio
15.2.2.3. SWOT Analysis
15.2.2.4. Strategic Overview
15.2.3. Novartis AG
15.2.3.1. Company Overview (HQ, Business Segments, Employee Strength)
15.2.3.2. Product Portfolio
15.2.3.3. SWOT Analysis
15.2.3.4. Strategic Overview
15.2.4. Eli Lilly and Company
15.2.4.1. Company Overview (HQ, Business Segments, Employee Strength)
15.2.4.2. Product Portfolio
15.2.4.3. SWOT Analysis
15.2.4.4. Strategic Overview
15.2.5. Teva Pharmaceutical Industries Ltd.
15.2.5.1. Company Overview (HQ, Business Segments, Employee Strength)
15.2.5.2. Product Portfolio
15.2.5.3. SWOT Analysis
15.2.5.4. Strategic Overview
15.2.6. Camurus AB
15.2.6.1. Company Overview (HQ, Business Segments, Employee Strength)
15.2.6.2. Product Portfolio
15.2.6.3. SWOT Analysis
15.2.6.4. Strategic Overview
15.2.7. Bayer AG
15.2.7.1. Company Overview (HQ, Business Segments, Employee Strength)
15.2.7.2. Product Portfolio
15.2.7.3. SWOT Analysis
15.2.7.4. Strategic Overview
15.2.8. Pacira BioSciences, Inc.
15.2.8.1. Company Overview (HQ, Business Segments, Employee Strength)
15.2.8.2. Product Portfolio
15.2.8.3. SWOT Analysis
15.2.8.4. Strategic Overview
15.2.9. Trevena, Inc.
15.2.9.1. Company Overview (HQ, Business Segments, Employee Strength)
15.2.9.2. Product Portfolio
15.2.9.3. SWOT Analysis
15.2.9.4. Strategic Overview
List of Tables
Table 01: Global Post-operative Pain Therapeutics Market Value (US$ Mn) Forecast, by Drug Class, 2017–2031
Table 02: Global Post-operative Pain Therapeutics Market Value (US$ Mn) Forecast, by Route of Administration, 2017–2031
Table 03: Global Post-operative Pain Therapeutics Market Value (US$ Mn) Forecast, by Distribution Channel, 2017–2031
Table 04: Global Post-operative Pain Therapeutics Market Value (US$ Mn) Forecast, by Region, 2017–2031
Table 05: U.S. Post-operative Pain Therapeutics Market Value (US$ Mn) Forecast, by Drug Class, 2017–2031
Table 06: U.S. Post-operative Pain Therapeutics Market Value (US$ Mn) Forecast, by Route of Administration, 2017–2031
Table 07: U.S. Post-operative Pain Therapeutics Market Value (US$ Mn) Forecast, by Distribution Channel, 2017–2031
Table 08: European Union (EU5) Post-operative Pain Therapeutics Market Value (US$ Mn) Forecast, by Country, 2017–2031
Table 09: European Union (EU5) Post-operative Pain Therapeutics Market Value (US$ Mn) Forecast, by Drug Class, 2017–2031
Table 10: European Union (EU5) Post-operative Pain Therapeutics Market Value (US$ Mn) Forecast, by Route of Administration, 2017–2031
Table 11: European Union (EU5) Post-operative Pain Therapeutics Market Value (US$ Mn) Forecast, by Distribution Channel, 2017–2031
Table 12: Asia Pacific Postoperative Pain Therapeutics Market Value (US$ Mn) Forecast, by Country, 2017–2031
Table 13: Asia Pacific Postoperative Pain Therapeutics Market Value (US$ Mn) Forecast, by Drug Class, 2017–2031
Table 14: Asia Pacific Postoperative Pain Therapeutics Market Value (US$ Mn) Forecast, by Route of Administration, 2017–2031
Table 15: Asia Pacific Postoperative Pain Therapeutics Market Value (US$ Mn) Forecast, by Distribution Channel, 2017–2031
Table 16: Latin America Postoperative Pain Therapeutics Market Value (US$ Mn) Forecast, by Country, 2017–2031
Table 17: Latin America Postoperative Pain Therapeutics Market Value (US$ Mn) Forecast, by Drug Class, 2017–2031
Table 18: Latin America Postoperative Pain Therapeutics Market Value (US$ Mn) Forecast, by Route of Administration, 2017–2031
Table 19: Latin America Postoperative Pain Therapeutics Market Value (US$ Mn) Forecast, by Distribution Channel, 2017–2031
Table 20: Rest of the World Postoperative Pain Therapeutics Market Value (US$ Mn) Forecast, by Drug Class, 2017–2031
Table 21: Rest of the World Postoperative Pain Therapeutics Market Value (US$ Mn) Forecast, by Route of Administration, 2017–2031
Table 22: Rest of the World Postoperative Pain Therapeutics Market Value (US$ Mn) Forecast, by Distribution Channel, 2017–2031
List of Figures
Figure 01: Global Post-operative Pain Therapeutics Market, by Drug Class, 2021 and 2031
Figure 02: Global Post-operative Pain Therapeutics Market Attractiveness Analysis, by Drug Class, 2022–2031
Figure 03: Global Post-operative Pain Therapeutics Market (US$ Mn), by Opioids, 2017–2031
Figure 04: Global Post-operative Pain Therapeutics Market (US$ Mn), by NSAIDs, 2017–2031
Figure 05: Global Post-operative Pain Therapeutics Market (US$ Mn), by Local Anesthetics, 2017–2031
Figure 06: Global Post-operative Pain Therapeutics Market (US$ Mn), by Tricyclic Antidepressants, 2017–2031
Figure 07: Global Post-operative Pain Therapeutics Market (US$ Mn), by Antiepileptic Drugs, 2017–2031
Figure 08: Global Post-operative Pain Therapeutics Market (US$ Mn), by Others, 2017–2031
Figure 09: Global Post-operative Pain Therapeutics Market, by Route of Administration, 2021 and 2031
Figure 10: Global Post-operative Pain Therapeutics Market Attractiveness Analysis, by Route of Administration, 2022–2031
Figure 11: Global Post-operative Pain Therapeutics Market (US$ Mn), by Oral, 2017–2031
Figure 12: Global Post-operative Pain Therapeutics Market (US$ Mn), by Intravenous, 2017–2031
Figure 13: Global Post-operative Pain Therapeutics Market (US$ Mn), by Intramuscular, 2017–2031
Figure 14: Global Post-operative Pain Therapeutics Market (US$ Mn), by Others, 2017–2031
Figure 15: Global Post-operative Pain Therapeutics Market, by Distribution Channel, 2021 and 2031
Figure 16: Global Post-operative Pain Therapeutics Market Attractiveness Analysis, by Distribution Channel, 2022–2031
Figure 17: Global Post-operative Pain Therapeutics Market (US$ Mn), by Hospital Pharmacies, 2017–2031
Figure 18: Global Post-operative Pain Therapeutics Market (US$ Mn), by Retail Pharmacies, 2017–2031
Figure 19: Global Post-operative Pain Therapeutics Market (US$ Mn), by Online Pharmacies, 2017–2031
Figure 20: Global Post-operative Pain Therapeutics Market (US$ Mn), by Others, 2017–2031
Figure 21: Global Post-operative Pain Therapeutics Market, by Region, 2021 and 2031
Figure 22: Global Post-operative Pain Therapeutics Market Attractiveness Analysis, by Region, 2022–2031
Figure 23: U.S. Post-operative Pain Therapeutics Market Value (US$ Mn) Forecast, 2017–2031
Figure 24: U.S. Post-operative Pain Therapeutics Market, by Drug Class, 2021 and 2031
Figure 25: U.S. Post-operative Pain Therapeutics Market Attractiveness Analysis, by Drug Class, 2022–2031
Figure 26: U.S. Post-operative Pain Therapeutics Market, by Route of Administration, 2021 and 2031
Figure 27: U.S. Post-operative Pain Therapeutics Market Attractiveness Analysis, by Route of Administration, 2022–2031
Figure 28: U.S. Post-operative Pain Therapeutics Market, by Distribution Channel, 2021 and 2031
Figure 29: U.S. Post-operative Pain Therapeutics Market Attractiveness Analysis, by Distribution Channel, 2022–2031
Figure 30: European Union (EU5) Post-operative Pain Therapeutics Market Value (US$ Mn) Forecast, 2017–2031
Figure 31: European Union (EU5) Post-operative Pain Therapeutics Market, by Country/Region, 2021 and 2031
Figure 32: European Union (EU5) Post-operative Pain Therapeutics Market Attractiveness Analysis, by Country/Region, 2022–2031
Figure 33: European Union (EU5) Post-operative Pain Therapeutics Market, by Drug Class, 2021 and 2031
Figure 34: European Union (EU5) Post-operative Pain Therapeutics Market Attractiveness Analysis, by Drug Class, 2022–2031
Figure 35: European Union (EU5) Post-operative Pain Therapeutics Market, by Route of Administration, 2021 and 2031
Figure 36: European Union (EU5) Post-operative Pain Therapeutics Market Attractiveness Analysis, by Route of Administration, 2022–2031
Figure 37: European Union (EU5) Post-operative Pain Therapeutics Market, by Distribution Channel, 2021 and 2031
Figure 38: European Union (EU5) Post-operative Pain Therapeutics Market Attractiveness Analysis, by Distribution Channel, 2022–2031
Figure 39: Asia Pacific Post-operative Pain Therapeutics Market Value (US$ Mn) Forecast, 2017–2031
Figure 40: Asia Pacific Post-operative Pain Therapeutics Market, by Country, 2021 and 2031
Figure 41: Asia Pacific Post-operative Pain Therapeutics Market Attractiveness Analysis, by Country, 2022–2031
Figure 42: Asia Pacific Post-operative Pain Therapeutics Market, by Drug Class, 2021 and 2031
Figure 43: Asia Pacific Post-operative Pain Therapeutics Market Attractiveness Analysis, by Drug Class, 2022–2031
Figure 44: Asia Pacific Post-operative Pain Therapeutics Market, by Route of Administration, 2021 and 2031
Figure 45: Asia Pacific Post-operative Pain Therapeutics Market Attractiveness Analysis, by Route of Administration, 2022–2031
Figure 46: Asia Pacific Post-operative Pain Therapeutics Market, by Distribution Channel, 2021 and 2031
Figure 47: Asia Pacific Post-operative Pain Therapeutics Market Attractiveness Analysis, by Distribution Channel, 2022–2031
Figure 48: Latin America Post-operative Pain Therapeutics Market Value (US$ Mn) Forecast, 2017–2031
Figure 49: Latin America Post-operative Pain Therapeutics Market, by Country, 2021 and 2031
Figure 50: Latin America Post-operative Pain Therapeutics Market Attractiveness Analysis, by Country, 2022–2031
Figure 51: Latin America Post-operative Pain Therapeutics Market, by Drug Class, 2021 and 2031
Figure 52: Latin America Post-operative Pain Therapeutics Market Attractiveness Analysis, by Drug Class, 2022–2031
Figure 53: Latin America Post-operative Pain Therapeutics Market, by Route of Administration, 2021 and 2031
Figure 54: Latin America Post-operative Pain Therapeutics Market Attractiveness Analysis, by Route of Administration, 2022–2031
Figure 55: Latin America Post-operative Pain Therapeutics Market, by Distribution Channel, 2021 and 2031
Figure 56: Latin America Post-operative Pain Therapeutics Market Attractiveness Analysis, by Distribution Channel, 2022–2031
Figure 57: Rest of the World Post-operative Pain Therapeutics Market Value (US$ Mn) Forecast, 2017–2031
Figure 58: Rest of the World Post-operative Pain Therapeutics Market, by Drug Class, 2021 and 2031
Figure 59: Rest of the World Post-operative Pain Therapeutics Market Attractiveness Analysis, by Drug Class, 2022–2031
Figure 60: Rest of the World Post-operative Pain Therapeutics Market, by Route of Administration, 2021 and 2031
Figure 61: Rest of the World Post-operative Pain Therapeutics Market Attractiveness Analysis, by Route of Administration, 2022–2031
Figure 62: Rest of the World Post-operative Pain Therapeutics Market, by Distribution Channel, 2021 and 2031
Figure 63: Rest of the World Post-operative Pain Therapeutics Market Attractiveness Analysis, by Distribution Channel, 2022–2031
Copyright © Transparency Market Research, Inc. All Rights reserved
Trust Online

Post-operative Pain Therapeutics Market
