Key players in the global parenteral nutrition market are engaged in regulatory approvals, new product development, and acquisition & collaborative agreements with other companies. These strategies are likely to fuel the growth of the global market. A few expansion strategies adopted by players operating in the market are:
The report on the global parenteral nutrition market discussed individual strategies, followed by company profiles of manufacturers of parenteral nutrition. The competitive landscape section has been included in the report to provide readers with a dashboard view and a company market share analysis of key players operating in the global parenteral nutrition industry.
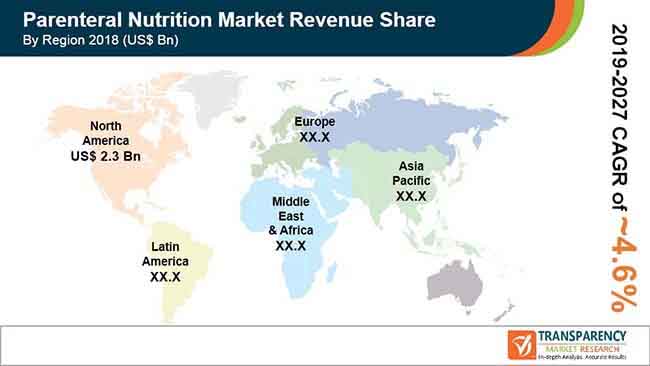
It is anticipated to expand at a CAGR of 4.6% to 2019 to 2027
Parenteral nutrition market is driven by rising incidence of chronic diseases and growing approvals to novel parenteral nutrition components
North America region dominated the global market owing to higher prevalence of chronic diseases
The single dose amino acid solutions segment accounted for leading market share
Baxter International, Inc., Sichuan Kelun Pharmaceutical Co., Ltd., Vifor Pharma Management Ltd., Grifols, S.A., Fresenius Kabi AG, B.Braun Melsungen AG, Pfizer Inc., and Allergan plc.
1. Preface
1.1. Market Definition and Scope
1.2. Market Segmentation
1.3. Key Research Objectives
1.4. Research Highlights
2. Assumptions and Research Methodology
3. Executive Summary : Global Parenteral Nutrition Market
4. Market Overview
4.1. Introduction
4.1.1. By Type Introduction
4.1.2. Industry Evolution / Developments
4.2. Overview
4.3. Market Dynamics
4.3.1. Drivers
4.3.2. Restraints
4.3.3. Opportunities
4.4. Global Parenteral Nutrition Market Analysis and Forecasts, 2017–2027
4.4.1. Market Revenue Projections (US$ Mn)
5. Market Outlook
5.1. Clinical Trial Pipeline Analysis
5.2. Key Mergers & Acquisitions
5.3. Cancer Diseases Epidemiology Analysis, by Key Country/Region
5.4. Inflammatory Bowel Diseases Epidemiology Analysis, by Key Country/Region
5.5. Preterm Birth Epidemiology Analysis, by Key Country/Region
6. Global Parenteral Nutrition Market Analysis and Forecast, by Type
6.1. Introduction & Definition
6.2. Key Findings / Developments
6.3. Global Parenteral Nutrition Market Value Forecast, by Type, 2017–2027
6.3.1. Carbohydrates
6.3.2. Parenteral Lipid Emulsions
6.3.3. Single Dose Amino Acid Solutions
6.3.4. Trace Elements, Electrolytes, & Minerals
6.3.5. Vitamins
6.4. Global Parenteral Nutrition Market Attractiveness, by Type, 2019-2027
7. Global Parenteral Nutrition Market Analysis and Forecast, by Region
7.1. Key Findings
7.2. Global Parenteral Nutrition Market Value Forecast, by Region
7.2.1. North America
7.2.2. Europe
7.2.3. Asia Pacific
7.2.4. Latin America
7.2.5. Middle East & Africa
7.3. Global Parenteral Nutrition Market Attractiveness, by Region, 2019-2027
8. North America Parenteral Nutrition Market Analysis and Forecast
8.1. Introduction
8.1.1. Key Findings
8.2. North America Parenteral Nutrition Market Value Forecast, by Type, 2017–2027
8.2.1. Carbohydrates
8.2.2. Parenteral Lipid Emulsions
8.2.3. Single Dose Amino Acid Solutions
8.2.4. Trace Elements, Electrolytes, & Minerals
8.2.5. Vitamins
8.3. North America Parenteral Nutrition Market Value Forecast, by Country, 2017–2027
8.3.1. U.S.
8.3.2. Canada
8.4. North America Parenteral Nutrition Market Attractiveness Analysis, 2019-2027
8.4.1. By Type
8.4.2. By Country
9. Europe Parenteral Nutrition Market Analysis and Forecast
9.1. Introduction
9.1.1. Key Findings
9.2. Europe Parenteral Nutrition Market Value Forecast, by Type, 2017–2027
9.2.1. Carbohydrates
9.2.2. Parenteral Lipid Emulsions
9.2.3. Single Dose Amino Acid Solutions
9.2.4. Trace Elements, Electrolytes, & Minerals
9.2.5. Vitamins
9.3. Europe Parenteral Nutrition Market Value Forecast, by Country/Sub-region, 2017–2027
9.3.1. Germany
9.3.2. U.K.
9.3.3. France
9.3.4. Spain
9.3.5. Italy
9.3.6. Rest of Europe
9.4. Europe Parenteral Nutrition Market Attractiveness Analysis, 2019-2027
9.4.1. By Type
9.4.2. By Country/Sub-region
10. Asia Pacific Parenteral Nutrition Market Analysis and Forecast
10.1. Introduction
10.1.1. Key Findings
10.2. Asia Pacific Parenteral Nutrition Market Value Forecast, by Type, 2017–2027
10.2.1. Carbohydrates
10.2.2. Parenteral Lipid Emulsions
10.2.3. Single Dose Amino Acid Solutions
10.2.4. Trace Elements, Electrolytes, & Minerals
10.2.5. Vitamins
10.3. Asia Pacific Parenteral Nutrition Market Value Forecast, by Country/Sub-region, 2017–2027
10.3.1. China
10.3.2. Japan
10.3.3. India
10.3.4. Australia & New Zealand
10.3.5. Rest of Asia Pacific
10.4. Asia Pacific Parenteral Nutrition Market Attractiveness Analysis, 2019-2027
10.4.1. By Type
10.4.2. By Country/Sub-region
11. Latin America Parenteral Nutrition Market Analysis and Forecast
11.1. Introduction
11.1.1. Key Findings
11.2. Latin America Parenteral Nutrition Market Value Forecast, by Type, 2017–2027
11.2.1. Carbohydrates
11.2.2. Parenteral Lipid Emulsions
11.2.3. Single Dose Amino Acid Solutions
11.2.4. Trace Elements, Electrolytes, & Minerals
11.2.5. Vitamins
11.3. Latin America Parenteral Nutrition Market Value Forecast, by Country/Sub-region, 2017–2027
11.3.1. Brazil
11.3.2. Mexico
11.3.3. Rest of Latin America
11.4. Latin America Parenteral Nutrition Market Attractiveness Analysis, 2019-2027
11.4.1. By Type
11.4.2. By Country/Sub-region
12. Middle East & Africa Parenteral Nutrition Market Analysis and Forecast
12.1. Introduction
12.1.1. Key Findings
12.2. Middle East & Africa Parenteral Nutrition Market Value Forecast, by Type, 2017–2027
12.2.1. Carbohydrates
12.2.2. Parenteral Lipid Emulsions
12.2.3. Single Dose Amino Acid Solutions
12.2.4. Trace Elements, Electrolytes, & Minerals
12.2.5. Vitamins
12.3. Middle East & Africa Parenteral Nutrition Market Value Forecast, by Country/Sub-region, 2017–2027
12.3.1. GCC Countries
12.3.2. South Africa
12.3.3. Rest of Middle East & Africa
12.4. Middle East & Africa Parenteral Nutrition Market Attractiveness Analysis, 2019-2027
12.4.1. By Type
12.4.2. By Country/Sub-region
13. Competition Landscape
13.1. Global Parenteral Nutrition Market Player – Competition Matrix (By Tier and Size of companies)
13.2. Global Parenteral Nutrition Market Share/Position Analysis, by Company (2018)
13.3. Company Profiles
13.3.1. Allergan plc.
13.3.1.1. Company Overview (HQ, Business Segments, Employee Strength)
13.3.1.2. Company Financials
13.3.1.3. Growth Strategies
13.3.1.4. SWOT Analysis
13.3.2. Pfizer Inc.
13.3.2.1. Company Overview (HQ, Business Segments, Employee Strength)
13.3.2.2. Company Financials
13.3.2.3. Growth Strategies
13.3.2.4. SWOT Analysis
13.3.3. B.Braun Melsungen AG
13.3.3.1. Company Overview (HQ, Business Segments, Employee Strength)
13.3.3.2. Company Financials
13.3.3.3. Growth Strategies
13.3.3.4. SWOT Analysis
13.3.4. Fresenius Kabi AG
13.3.4.1. Company Overview (HQ, Business Segments, Employee Strength)
13.3.4.2. Company Financials
13.3.4.3. Growth Strategies
13.3.4.4. SWOT Analysis
13.3.5. Grifols, S.A.
13.3.5.1. Company Overview (HQ, Business Segments, Employee Strength)
13.3.5.2. Company Financials
13.3.5.3. Growth Strategies
13.3.5.4. SWOT Analysis
13.3.6. Baxter International, Inc.
13.3.6.1. Company Overview (HQ, Business Segments, Employee Strength)
13.3.6.2. Company Financials
13.3.6.3. Growth Strategies
13.3.6.4. SWOT Analysis
13.3.7. Vifor Pharma Management Ltd.
13.3.7.1. Company Overview (HQ, Business Segments, Employee Strength)
13.3.7.2. Company Financials
13.3.7.3. Growth Strategies
13.3.7.4. SWOT Analysis
13.3.8. Sichuan Kelun Pharmaceutical Co., Ltd.,
13.3.8.1. Company Overview (HQ, Business Segments, Employee Strength)
13.3.8.2. Growth Strategies
13.3.8.3. SWOT Analysis
List of Table
Table 01: Clinical Trial Pipeline Analysis, Parenteral Nutrition Market
Table 02: Key Merger & Acquisition, Parenteral Nutrition Market
Table 03: Global Parenteral Nutrition Market Value (US$ Mn) Forecast, by Type, 2017–2027
Table 04: Global Parenteral Nutrition Market Value (US$ Mn) Forecast, by Region, 2017–2027
Table 05: North America Parenteral Nutrition Market Value (US$ Mn) Forecast, by Country, 2017–2027
Table 06: North America Parenteral Nutrition Value (US$ Mn) Forecast, by Type, 2017–2027
Table 07: Europe Parenteral Nutrition Market Value (US$ Mn) Forecast, by Country/Sub-region, 2017–2027
Table 08: Europe Parenteral Nutrition Value (US$ Mn) Forecast, by Type, 2017–2027
Table 09: Asia Pacific Parenteral Nutrition Market Value (US$ Mn) Forecast, by Country/Sub-region, 2017–2027
Table 10: Asia Pacific Parenteral Nutrition Value (US$ Mn) Forecast, by Type, 2017–2027
Table 11: Latin America Parenteral Nutrition Market Value (US$ Mn) Forecast, by Country/Sub-region, 2017–2027
Table 12: Latin America Parenteral Nutrition Value (US$ Mn) Forecast, by Type, 2017–2027
Table 13: Middle East & Africa Parenteral Nutrition Market Value (US$ Mn) Forecast, by Country/Sub-region, 2017–2027
Table 14: Middle East & Africa Parenteral Nutrition Value (US$ Mn) Forecast, by Type, 2017–2027
List of Figure
Figure 01: Global Parenteral Nutrition Market Value (US$ Mn) Snapshot, by Type, 2018(A)
Figure 02: Global Parenteral Nutrition Market Snapshot
Figure 03: Global Parenteral Nutrition Market Share (%) Snapshot, by Region, 2018(A)
Figure 04: Global Parenteral Nutrition Market Value (US$ Mn) and Distribution, by Region, 2018 and 2027
Figure 05: Global Parenteral Nutrition Market, Opportunity Map, by Type
Figure 06: Global Parenteral Nutrition Market Value (US$ Mn) Forecast, 2017-2027
Figure 07: Global Parenteral Nutrition Market Value Share (%), by Type (2018)
Figure 08: Global Parenteral Nutrition Market Value Share (%), by Region (2018)
Figure 09: Global Parenteral Nutrition Market Clinical Trial Pipeline Analysis: Pfizer Inc.
Figure 10: Global Parenteral Nutrition Market Clinical Trial Pipeline Analysis: B. Braun Melsungen AG
Figure 11: Global Parenteral Nutrition Market Clinical Trial Pipeline Analysis: Fresenius Kabi AG
Figure 12: Global Parenteral Nutrition Market Clinical Trial Pipeline Analysis: Baxter International Inc.
Figure 13: Global Parenteral Nutrition Market Clinical Trial Pipeline Analysis: Allergan plc.
Figure 14: Global Parenteral Nutrition Market Clinical Trial Pipeline Analysis: Claris Life Sciences Ltd.
Figure 15: Parenteral Nutrition Market: Mergers & Acquisitions
Figure 16: Summary of the Studies on the Prevalence of Non-melanoma skin cancer
Figure 17: Summary of the Studies on the Prevalence of Lung Cancer
Figure 18: Summary of the Studies on the Prevalence of Breast Cancer
Figure 19: Summary of the Studies on the Prevalence of Prostate Cancer
Figure 20: Summary of the Studies on the Prevalence of Colorectal Cancer
Figure 21: Prevalence Inflammatory Bowel Disease, by Key Countries (2018)
Figure 22: Global Preterm Birth Epidemiology Analysis, by Key Countries (2/3)
Figure 23: Global Preterm Birth Epidemiology Analysis, by Key Countries (2/2)
Figure 24: Global Parenteral Nutrition Market Value Share Analysis, by Type, 2018 and 2027
Figure 25: Global Parenteral Nutrition Market Attractiveness, by Type, 2019–2027
Figure 26: Global Parenteral Nutrition Market Value (US$ Mn) Forecast and Y-o-Y Growth (%) Projection, by Carbohydrates, 2017–2027
Figure 27: Global Parenteral Nutrition Market Value (US$ Mn) Forecast and Y-o-Y Growth (%) Projection, by Parenteral Lipid Emulsions, 2017–2027
Figure 28: Global Parenteral Nutrition Market Value (US$ Mn) Forecast and Y-o-Y Growth (%) Projection, by Single Dose Amino Acid Solutions, 2017–2027
Figure 29: Global Parenteral Nutrition Market Value (US$ Mn) Forecast and Y-o-Y Growth (%) Projection, by Trace Elements, Electrolytes, & Minerals, 2017–2027
Figure 30: Global Parenteral Nutrition Market Value (US$ Mn) Forecast and Y-o-Y Growth (%) Projection, by Vitamins, 2017–2027
Figure 31: Global Parenteral Nutrition Market Value Share Analysis, by Region, 2018 and 2027
Figure 32: Global Parenteral Nutrition Market Attractiveness, by Region, 2019–2027
Figure 33: North America Parenteral Nutrition Market Value (US$ Mn) and Y-o-Y Growth (%) Forecast, 2017–2027
Figure 34: North America Parenteral Nutrition Market Value Share (%), by Country, 2018 and 2027
Figure 35: North America Parenteral Nutrition Market Attractiveness, by Country, 2019–2027
Figure 36: North America Parenteral Nutrition Market Value Share (%), by Type, 2018 and 2027
Figure 37: North America Parenteral Nutrition Market Attractiveness, by Type, 2019–2027
Figure 38: Europe Parenteral Nutrition Market Value (US$ Mn) and Y-o-Y Growth (%) Forecast, 2017-2027
Figure 39: Europe Parenteral Nutrition Market Value Share (%), by Country/Sub-region, 2018 and 2027
Figure 40: Europe Parenteral Nutrition Market Attractiveness, by Country/Sub-region, 2019–2027
Figure 41: Europe Parenteral Nutrition Market Value Share (%), by Type, 2018 and 2027
Figure 42: Europe Parenteral Nutrition Market Attractiveness, by Type, 2019–2027
Figure 43: Asia Pacific Parenteral Nutrition Market Value (US$ Mn) and Y-o-Y Growth (%) Forecast, 2017–2027
Figure 44: Asia Pacific Parenteral Nutrition Market Value Share (%), by Country/Sub-region, 2018 and 2027
Figure 45: Asia Pacific Parenteral Nutrition Market Attractiveness, by Country/Sub-region, 2019–2027
Figure 46: Asia Pacific Parenteral Nutrition Market Value Share (%), by Type, 2018 and 2027
Figure 47: Asia Pacific Parenteral Nutrition Market Attractiveness, by Type, 2019–2027
Figure 48: Latin America Parenteral Nutrition Market Value (US$ Mn) and Y-o-Y Growth (%) Forecast, 2017–2027
Figure 49: Latin America Parenteral Nutrition Market Value Share (%), by Country/Sub-region, 2018 and 2027
Figure 50: Latin America Parenteral Nutrition Market Attractiveness, by Country/Sub-region, 2019–2027
Figure 51: Latin America Parenteral Nutrition Market Value Share (%), by Type, 2018 and 2027
Figure 52: Latin America Parenteral Nutrition Market Attractiveness, by Type, 2019–2027
Figure 53: Middle East & Africa Parenteral Nutrition Market Value (US$ Mn) and Y-o-Y Growth (%) Forecast, 2017–2027
Figure 54: Middle East & Africa Parenteral Nutrition Market Value Share (%), by Country/Sub-region, 2018 and 2027
Figure 55: Middle East & Africa Parenteral Nutrition Market Attractiveness, by Country/Sub-region, 2019–2027
Figure 56: Middle East & Africa Parenteral Nutrition Market Value Share (%), by Type, 2018 and 2027
Figure 57: Middle East & Africa Parenteral Nutrition Market Attractiveness, by Type, 2019–2027
Figure 58: Global Parenteral Nutrition Market Share/Position Analysis, by Company (2018)
Figure 59: Allergan plc., Revenue (US$ Mn) & Y-o-Y Growth (%), 2015–2018
Figure 60: Allergan plc., Breakdown of Net Sales, by Business Segment (2018)
Figure 61: Allergan plc., R&D Intensity and Sales & Marketing Intensity – Company Level, 2015–2018
Figure 62: Allergan plc., Breakdown of Net Sales, by Region (2018)
Figure 63: Pfizer Inc., Revenue (US$ Mn) & Y-o-Y Growth (%), 2015–2018
Figure 64: Pfizer Inc., Breakdown of Net Sales, by Business Segment (2018)
Figure 65: Pfizer Inc., R&D Intensity and Sales & Marketing Intensity – Company Level, 2015–2018
Figure 66: Pfizer Inc., Breakdown of Net Sales, by Region, (2018)
Figure 67: B. Braun Melsungen AG, Revenue (US$ Mn) & Y-o-Y Growth (%), 2015–2018
Figure 68: B. Braun Melsungen AG, R&D Expenses (US$ Mn) and Y-o-Y Growth (%), 2015–2018
Figure 69: B. Braun Melsungen AG, Breakdown of Net Sales, by Business Segment (2018)
Figure 70: B. Braun Melsungen AG, Breakdown of Net Sales, by Region (2018)
Figure 71: Fresenius Kabi AG, Revenue (US$ Mn) & Y-o-Y Growth (%), 2015–2018
Figure 72: Fresenius Kabi AG, Breakdown of Net Sales, by Region (2018)
Figure 73: Fresenius Kabi AG, Breakdown of Net Sales, by Segment (2018)
Figure 74: Fresenius Kabi AG, Research & Development Cost (US$ Mn), 2015 - 2018
Figure 75: Grifols, S.A. Revenue (US$ Mn) and Y-o-Y Growth (%), 2015–2018
Figure 76: Grifols, S.A., R&D Expenses (US$ Mn) and Y-o-Y Growth (%), 2015–2018
Figure 77: Grifols, S.A., Breakdown of Net Sales (%), by Business Segment (2018)
Figure 78: Grifols, S.A., Breakdown of Net Sales (%), by Region (2018)
Figure 79: Baxter International, Inc., Revenue (US$ Mn) and Y-o-Y Growth (%), 2015–2018
Figure 80: Baxter International, Inc., R&D Expenses (US$ Mn) and Y-o-Y Growth (%), 2015–2018
Figure 81: Baxter International, Inc., Breakdown of Net Sales, by Region (2018)
Figure 82: Baxter International, Inc., Breakdown of Net Sales (%), by Business Segment (2018)
Figure 83: Vifor Pharma Management Ltd., Revenue (US$ Bn) & Y-o-Y Growth (%), 2015–2018
Figure 84: Vifor Pharma Management Ltd., Revenue Breakdown of Net Sales, by Business Segment (2018)
Figure 85: Vifor Pharma Management Ltd., Revenue Breakdown of Net Sales, by Region (2018)
Figure 86: Vifor Pharma Management Ltd., R&D Intensity and Sales & Marketing Intensity – Company Level, 2015–2018
Copyright © Transparency Market Research, Inc. All Rights reserved
Trust Online

Parenteral Nutrition Market Insights, 2019-2027
