There are evolving consumer trends and rising awareness pertaining to niche product categories, such as organic and natural within the food & beverages sector. Over the past decade, organic and natural food products have gained considerable popularity across the world, particularly among millennials. The natural food & beverage movement across the world is primarily driven by the dwindling interest in chemical-based agricultural techniques. In the current scenario, organic wine is a growing trend in the beverages industry, particularly in wine-drinking countries such as Australia, New Zealand, France, Italy, Argentina, etc. Apart from being driven by sustainable vineyard practices, other factors that are expected to positively influence the growth of the organic wine market include minimalistic and manipulative approaches in wine making techniques.
In addition, as organic wines are free from additives such as sulfur, yeast nutrients, and fining, and produced by using indigenous yeasts, the demand is witnessing considerable growth. The consumer demand for vegan-friendly, preservative-free, biodynamic, carbon-neutral, and certified organic wines have set the ball rolling for the growth of the organic wine market during the forecast period. The organic wine market is currently a niche market that is likely to transition into a mainstream market over the upcoming years. Another factor that is projected to play a key role in the development of the organic wine market is the impressive rise in the number of health-conscious consumers who are largely inclined toward purchasing organic food & beverage products.
At the back of these factors, along with an array of potential benefits associated with organic products, the global organic wine market is expected to reach a value of ~US$ 30 Bn by the end of 2030.
The European region, which has, for decades, remained a hotspot for wine enthusiasts, owing to the vibrant wine culture across Spain, Italy, and even in the Nordic countries, is expected to provide abundant opportunities for manufacturers operating in the current organic wine market landscape. Organic wine, also known as ecological wine, is free from synthetic fertilizers, weed killers, and pesticides. The ‘free-from’ trend has gained considerable momentum across the European region, as consumers continue to demand transparency from the food & beverage makers pertaining to ingredients, production or manufacturing processes, nutritional content, etc.
The production of organic wines in the European region is regulated by the European Union Commission Regulation 203/2012, wherein guidelines are provided regarding the oenological processes and other practices that are permitted during the production of organic wine. Several players involved in the organic wine market are increasingly focusing on research and development activities to assess the composition of the ground and evaluate nitrogen, potassium, and phosphorous content in the ground. The evaluation of different samples of soil is essential to develop an optimal vegetal cover in which, autochthonous wild species are also included for efficient growth of the vine. Several other strategies are being studied to enhance the fertility of the soil without spraying insecticides. In addition, several other companies are investing resources to develop an ideal ecosystem that will enable the growth of vines without any chemical intervention. In the past few years, European winemakers are increasingly focusing on the production of wine using the autochtone yeast. In addition, a number of projects has been launched to make vineyard production more sustainable to minimize the ecological footprint.
As consumers continue to sway toward organic products, the prospects of the organic wine market continue to look bright during the forecast period. The demand for organic wine from retail and restaurant sectors around the world has witnessed consistent growth due to which, the organic wine market is expected to flourish during the assessment period. As per current trends, the consumption of organic wine is increasing at a rapid pace, particularly in Germany and France. The switch to organic wines is largely influenced by the adoption of sustainable winemaking techniques and the trend is expected to continue over the course of the forecast period. In addition, a significant rise in the number of wine shows and expos is another factor that is likely to play a key role in increasing the sales of organic wine in the forthcoming decade.
The growing emphasis on biodynamic agricultural practices is likely to provide a boost to the expansion of the global organic wine market, as academics, retailers, government agencies, winemakers, and farmers are increasingly focusing on enhancing soil health and minimizing the overall carbon footprint.
The COVID-19 pandemic has had a catastrophic impact on several major core industrial sectors. As restaurant and hospitality segments around the world have more or less come to a standstill due to stringent containment measures enforced by governments, the demand for organic wine has taken a major hit amid the COVID-19 pandemic. While sales of organic wine are likely to remain sluggish in the near future, the demand is expected to witness steady growth in certain regions where lockdown restrictions have been relaxed. The global import and export of organic wine are likely to be back on track in the last quarter of 2020, as restrictions on trade and transportation are likely to be lifted.
While offline sales are estimated to witness a dip, market players should focus on increasing sales via online distribution channels amid the ongoing health crisis.
Analysts’ Viewpoint
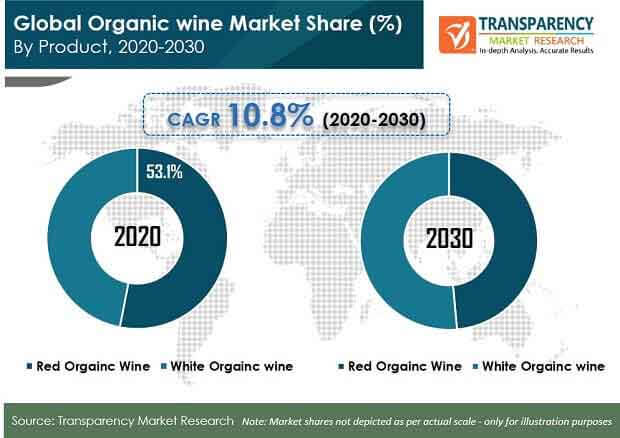
The organic wine market is expected to grow at an impressive CAGR of 10.8% during the forecast period. The market growth can be primarily attributed to the soaring demand from health-conscious consumers, high demand for organic and natural products, focus on improving soil health, rise in the number of wine exhibitions, and growing vegan trends. Europe is expected to dominate the global organic wine market, owing to the strong presence of tier 1 and tier 2 winemaking companies and favorable climatic conditions. Despite sluggish sales during the COVID-19 pandemic, the market is expected to recover in the last quarter of 2020 and beyond.
Organic Wine Market: Overview
Organic Wine: Market Frontrunners
Organic Wine Market: Trends
Environmental and health concerns are driving the demand for organic wine and this factor boosts its sales worldwide, especially in Europe. People are gradually choosing organic products as compared to conventional beverages and wines. Furthermore, primarily small businesses and boutique wineries have turned their conventional production to organic production to cater to health conscious population.
Traditionally, glass bottles are the preferred means of packaging for wine manufacturers, where today’s innovation in packaging is changing the minds of manufacturers. New packaging such as tetra pack and boxes are trending nowadays due to convenience offered to consumers and protection of wine quality for a long time. In comparison, plastic wine packaging is much lighter in weight compared to glass bottles and thus, can be shipped with less fuel. In addition, boxes are also recyclable and increase the shelf life of open wine, thus there is no wine wastage. Besides, boxed wine supports the 'eco-friendliness' quality of organic wines focusing on improved versatility with convenience and popularity.
Organic Wine Market: Strategies
Target Region for Organic Wine Market
Organic Wine Market: Players
Organic Wine Market is projected to reach US$ 30 Bn by the end of 2030
Organic Wine Market is expected to grow at a CAGR of 10.8% during 2020-2030
Global organic wine market revenue was valued at ~US$ 11 Bn in 2020 and to reach ~US$ 30 Bn by 2030
Europe is a more attractive region for vendors in the Organic Wine Market
Key vendors in the Organic Wine Market are Avondale, Elgin Ridge Wines, Kendall-Jackon Winery, The Organic Wine Company, Bronco Wine Company, King Estate Winery, etc
1. Executive Summary
1.1. Global Market Outlook
1.2. Demand-side Trends
1.3. Supply-side Trends
1.4. Analysis and Recommendations
2. Market Overview
2.1. Market Coverage / Taxonomy
2.2. Market Definition / Scope / Limitations
3. Consumer Behaviour and Attitude Measurement
4. Product Launch Track & Trends
5. Global Organic Wine Market Demand Analysis 2015-2019 and Forecast, 2020-2030
5.1. Historical Market Volume (Metric Tons) Analysis, 2015-2019
5.2. Current and Future Market Volume (Metric Tons) Projections, 2020-2030
5.3. Y-o-Y Growth Trend Analysis
6. Global Organic Wine Market - Pricing Analysis
6.1. Regional Pricing Analysis (US$/Metric Tons) Product type
6.2. Pricing Break-up
6.2.1. Producer Level Pricing
6.2.2. Distributor Level Pricing
6.2.3. Retail Pricing
6.3. Global Average Pricing Analysis Benchmark
7. Global Organic Wine Market Demand (Size in US$ Mn) Analysis 2015-2019 and Forecast, 2020-2030
7.1. Historical Market Value (US$ Mn) Analysis, 2015-2019
7.2. Current and Future Market Value (US$ Mn) Projections, 2020-2030
7.2.1. Y-o-Y Growth Trend Analysis
7.2.2. Absolute $ Opportunity Analysis
8. Market Background
8.1. Global Organic Wine Market Overview
8.1.1. Total Organic Wine Production, by Country/Region
8.1.2. Imports/Exports Scenario
8.1.3. Demand/Supply for Beer
8.2. Macro-Economic Factors
8.3. Forecast Factors - Relevance & Impact
8.4. Value Chain Analysis
8.4.1. Raw Material Suppliers
8.4.2. Product Manufacturers
8.4.3. Distributors/Suppliers/Wholesalers
8.5. Market Dynamics
8.5.1. Drivers
8.5.2. Restraints
8.5.3. Opportunity
8.6. Key Regulations
9. Global Organic Wine Market Analysis 2015-2019 and Forecast 2020-2030, By Packaging
9.1. Introduction / Key Findings
9.2. Historical Market Size (US$ Mn) and Volume Analysis By Packaging, 2015 - 2019
9.3. Current and Future Market Size (US$ Mn) and Volume Analysis and Forecast By Packaging, 2020 - 2030
9.3.1. Organic
9.3.2. Glass Bottles
9.3.3. Cans
9.3.4. Others
9.4. Market Attractiveness Analysis By Packaging
10. Global Organic Wine Market Analysis 2015-2019 and Forecast 2020-2030, By Product Type
10.1. Introduction / Key Findings
10.2. Historical Market Size (US$ Mn) and Volume Analysis By Product Type, 2015 - 2019
10.3. Current and Future Market Size (US$ Mn) and Volume Analysis and Forecast By Product Type, 2020 - 2030
10.3.1. Red organic wine
10.3.2. White organic wine
10.4. Market Attractiveness Analysis By Product Type
11. Global Organic Wine Market Analysis 2015-2019 and Forecast 2020-2030, By Distribution Channel
11.1. Introduction / Key Findings
11.2. Historical Market Size (US$ Mn) and Volume Analysis By Distribution Channel, 2015 - 2019
11.3. Current and Future Market Size (US$ Mn) and Volume Analysis and Forecast By Distribution Channel, 2020 - 2030
11.3.1. B2B
11.3.2. B2C
11.3.2.1. Store-Based Retailing
11.3.2.1.1 Hypermarkets/Supermarket
11.3.2.1.2 Convenience Stores
11.3.2.1.3 Specialty Stores
11.3.2.1.4 Discount Stores
11.3.2.1.5 Grocery Stores
11.3.2.1.6 Convenience Stores
11.3.2.2. HoReCa
11.3.2.3. Online Retailing
11.4. Market Attractiveness Analysis By Distribution Channel
12. Global Organic Wine Market Analysis 2015-2019 and Forecast 2020-2030, By Region
12.1. Introduction
12.2. Historical Market Size (US$ Mn) and Volume Analysis By Region, 2015 - 2019
12.3. Current Market Size (US$ Mn) and Volume Analysis and Forecast By Region, 2020 - 2030
12.3.1. North America
12.3.2. Latin America
12.3.3. Europe
12.3.4. Asia Pacific Excluding India(APEJ)
12.3.5. India
12.3.6. Oceania
12.3.7. Middle East and Africa (MEA)
12.4. Market Attractiveness Analysis By Region
13. North America Organic Wine Market Analysis 2015-2019 and Forecast 2020-2030
13.1. Introduction
13.2. Historical Market Size (US$ Mn) and Volume Trend Analysis By Market Taxonomy, 2015 - 2019
13.3. Market Size (US$ Mn) and Volume Forecast By Market Taxonomy, 2020 - 2030
13.3.1. By Country
13.3.1.1. U.S.
13.3.1.2. Canada
13.3.2. By Packaging
13.3.3. By Product Type
13.3.4. By Distribution Channel
13.4. Market Attractiveness Analysis
13.4.1. By Country
13.4.2. By Packaging
13.4.3. By Product Type
13.4.4. By Distribution Channel
13.5. Market Trends
13.5.1. Key Market Participants - Intensity Mapping
13.5.2. Drivers and Restraints - Impact Analysis
14. Latin America Organic Wine Market Analysis 2015-2019 and Forecast 2020-2030
14.1. Introduction
14.2. Historical Market Size (US$ Mn) and Volume Trend Analysis By Market Taxonomy, 2015 - 2019
14.3. Market Size (US$ Mn) and Volume Forecast By Market Taxonomy, 2020 - 2030
14.3.1. By Country
14.3.1.1. Argentina
14.3.1.2. Brazil
14.3.1.3. Mexico
14.3.1.4. Chile
14.3.1.5. Peru
14.3.1.6. Rest of Latin America
14.3.2. By Packaging
14.3.3. By Product Type
14.3.4. By Distribution Channel
14.4. Market Attractiveness Analysis
14.4.1. By Country
14.4.2. By Packaging
14.4.3. By Product Type
14.4.4. By Distribution Channel
14.5. Market Trends
14.6. Key Market Participants - Intensity Mapping
14.7. Drivers and Restraints - Impact Analysis
15. Europe Organic Wine Market Analysis 2015-2019 and Forecast 2020-2030
15.1. Introduction
15.2. Historical Market Size (US$ Mn) and Volume Trend Analysis By Market Taxonomy, 2015 - 2019
15.3. Market Size (US$ Mn) and Volume Forecast By Market Taxonomy, 2020 - 2030
15.3.1. By Country
15.3.1.1. Germany
15.3.1.2. Italy
15.3.1.3. France
15.3.1.4. U.K.
15.3.1.5. Spain
15.3.1.6. BENELUX
15.3.1.7. Nordic
15.3.1.8. Russia
15.3.1.9. Poland
15.3.1.10. Rest of Europe
15.3.2. By Packaging
15.3.3. By Product Type
15.3.4. By Distribution Channel
15.4. Market Attractiveness Analysis
15.4.1. By Country
15.4.2. By Packaging
15.4.3. By Product Type
15.4.4. By Distribution Channel
15.5. Market Trends
15.6. Key Market Participants - Intensity Mapping
15.7. Drivers and Restraints - Impact Analysis
16. Asia Pacific Excluding Japan (APEJ) Organic Wine Market Analysis 2015-2019 and Forecast 2020-2030
16.1. Introduction
16.2. Historical Market Size (US$ Mn) and Volume Trend Analysis By Market Taxonomy, 2015 - 2019
16.3. Market Size (US$ Mn) and Volume Forecast By Market Taxonomy, 2020 - 2030
16.3.1. By Country
16.3.1.1. China
16.3.1.2. India
16.3.1.3. South Korea
16.3.1.4. Association of Southeast Asian Nations (ASEAN)
16.3.2. By Packaging
16.3.3. By Product Type
16.3.4. By Distribution Channel
16.4. Market Attractiveness Analysis
16.4.1. By Country
16.4.2. By Packaging
16.4.3. By Product Type
16.4.4. By Distribution Channel
16.5. Market Trends
16.6. Key Market Participants - Intensity Mapping
16.7. Drivers and Restraints - Impact Analysis
17. Japan Organic Wine Market Analysis 2015-2019 and Forecast 2020-2030
17.1. Introduction
17.2. Historical Market Size (US$ Mn) and Volume Trend Analysis By Market Taxonomy, 2015 - 2019
17.3. Market Size (US$ Mn) and Volume Forecast By Market Taxonomy, 2020 - 2030
17.3.1. By Packaging
17.3.2. By Product Type
17.3.3. By Distribution Channel
17.4. Market Attractiveness Analysis
17.4.1. By Packaging
17.4.2. By Product Type
17.4.3. By Distribution Channel
17.5. Market Trends
17.6. Key Market Participants - Intensity Mapping
17.7. Drivers and Restraints - Impact Analysis
18. Oceania Organic Wine Market Analysis 2015-2019 and Forecast 2020-2030
18.1. Introduction
18.2. Historical Market Size (US$ Mn) and Volume Trend Analysis By Market Taxonomy, 2015 - 2019
18.3. Market Size (US$ Mn) and Volume Forecast By Market Taxonomy, 2020 - 2030
18.3.1. By Country
18.3.1.1. Australia
18.3.1.2. New Zealand
18.3.2. By Packaging
18.3.3. By Product Type
18.3.4. By Distribution Channel
18.4. Market Attractiveness Analysis
18.4.1. By Country
18.4.2. By Packaging
18.4.3. By Product Type
18.4.4. By Distribution Channel
18.5. Market Trends
18.6. Key Market Participants - Intensity Mapping
18.7. Drivers and Restraints - Impact Analysis
19. Middle East and Africa Organic Wine Market Analysis 2015-2019 and Forecast 2020-2030
19.1. Introduction
19.2. Historical Market Size (US$ Mn) and Volume Trend Analysis By Market Taxonomy, 2015 - 2019
19.3. Market Size (US$ Mn) and Volume Forecast By Market Taxonomy, 2020 - 2030
19.3.1. By Country
19.3.1.1. GCC Countries
19.3.1.2. South Africa
19.3.1.3. Turkey
19.3.1.4. Iran
19.3.1.5. Israel
19.3.1.6. Rest of Middle East and Africa
19.3.2. By Packaging
19.3.3. By Product Type
19.3.4. By Distribution Channel
19.4. Market Attractiveness Analysis
19.4.1. By Country
19.4.2. By Packaging
19.4.3. By Product Type
19.4.4. By Distribution Channel
19.5. Market Trends
19.6. Key Market Participants - Intensity Mapping
19.7. Drivers and Restraints - Impact Analysis
20. Competition Assessment
20.1. Global Organic Wine Market Competition - a Dashboard View
20.2. Global Organic Wine Market Structure Analysis
20.3. Global Organic Wine Market Company Share Analysis
20.3.1. For Tier 1 Market Players, 2019
20.3.2. Company Market Share Analysis of Top 10 Players, By Region
20.3.3. Key Participants Market Presence (Intensity Mapping) by Region
21. Competition Analysis
21.1. Competition Dashboard
21.2. Pricing Analysis by Competition
21.3. Competition Benchmarking
21.4. Competition Deep Dive
21.4.1. Avondale
21.4.1.1. Overview
21.4.1.2. Product Portfolio
21.4.1.3. Distribution Footprint
21.4.1.4. Channel Footprint
21.4.1.5. Strategy Overview
21.4.1.6. Financial Analysis
21.4.1.7. Revenue Share
21.4.1.8. Analyst Comments
21.4.2. Elgin Ridge Wines
21.4.2.1. Overview
21.4.2.2. Product Portfolio
21.4.2.3. Distribution Footprint
21.4.2.4. Channel Footprint
21.4.2.5. Strategy Overview
21.4.2.6. Financial Analysis
21.4.2.7. Revenue Share
21.4.2.8. Analyst Comments
21.4.3. Kendall-Jackon Winery
21.4.3.1. Overview
21.4.3.2. Product Portfolio
21.4.3.3. Distribution Footprint
21.4.3.4. Channel Footprint
21.4.3.5. Strategy Overview
21.4.3.6. Financial Analysis
21.4.3.7. Revenue Share
21.4.3.8. Analyst Comments
21.4.4. The Organic Wine Company
21.4.4.1. Overview
21.4.4.2. Product Portfolio
21.4.4.3. Distribution Footprint
21.4.4.4. Channel Footprint
21.4.4.5. Strategy Overview
21.4.4.6. Financial Analysis
21.4.4.7. Revenue Share
21.4.4.8. Analyst Comments
21.4.5. Bronco Wine Company
21.4.5.1. Overview
21.4.5.2. Product Portfolio
21.4.5.3. Distribution Footprint
21.4.5.4. Channel Footprint
21.4.5.5. Strategy Overview
21.4.5.6. Financial Analysis
21.4.5.7. Revenue Share
21.4.5.8. Analyst Comments
21.4.6. King Estate Winery
21.4.6.1. Overview
21.4.6.2. Product Portfolio
21.4.6.3. Distribution Footprint
21.4.6.4. Channel Footprint
21.4.6.5. Strategy Overview
21.4.6.6. Financial Analysis
21.4.6.7. Revenue Share
21.4.6.8. Analyst Comments
21.4.7. Grgich Hills Estate
21.4.7.1. Overview
21.4.7.2. Product Portfolio
21.4.7.3. Distribution Footprint
21.4.7.4. Channel Footprint
21.4.7.5. Strategy Overview
21.4.7.6. Financial Analysis
21.4.7.7. Revenue Share
21.4.7.8. Analyst Comments
21.4.8. Xinjiang Tiansai WineryCo.,Ltd
21.4.8.1. Overview
21.4.8.2. Product Portfolio
21.4.8.3. Distribution Footprint
21.4.8.4. Channel Footprint
21.4.8.5. Strategy Overview
21.4.8.6. Financial Analysis
21.4.8.7. Revenue Share
21.4.8.8. Analyst Comments
21.4.9. Emiliana Organic Vineyards
21.4.9.1. Overview
21.4.9.2. Product Portfolio
21.4.9.3. Distribution Footprint
21.4.9.4. Channel Footprint
21.4.9.5. Strategy Overview
21.4.9.6. Financial Analysis
21.4.9.7. Revenue Share
21.4.9.8. Analyst Comments
21.4.10. Societa Agricola Querciabella SpA,
21.4.10.1. Overview
21.4.10.2. Product Portfolio
21.4.10.3. Distribution Footprint
21.4.10.4. Channel Footprint
21.4.10.5. Strategy Overview
21.4.10.6. Financial Analysis
21.4.10.7. Revenue Share
21.4.10.8. Analyst Comments
21.4.11. Frey Wine
21.4.11.1. Overview
21.4.11.2. Product Portfolio
21.4.11.3. Distribution Footprint
21.4.11.4. Channel Footprint
21.4.11.5. Strategy Overview
21.4.11.6. Financial Analysis
21.4.11.7. Revenue Share
21.4.11.8. Analyst Comments
21.4.12. La Cantina Pizzolato
21.4.12.1. Overview
21.4.12.2. Product Portfolio
21.4.12.3. Distribution Footprint
21.4.12.4. Channel Footprint
21.4.12.5. Strategy Overview
21.4.12.6. Financial Analysis
21.4.12.7. Revenue Share
21.4.12.8. Analyst Comments
22. Scenario Assessment of the Impact of COVID-19 on Organic Wine Market
22.1. Current Scenario/ Immediate Actions
22.2. Customers will change some behaviors permanently- accelerating prior trends; bold action now can set you up for success through the downturn and beyond
22.3. Market Scenario and the Forward Path
22.3.1. Global Organic Wine Market Forecast Scenario Comparison of Annual Growth Rates for short Term (2020-2023) and Long Term (2024-2030)
22.3.1.1. Optimistic Scenario
22.3.1.2. Likely Scenario
22.3.1.3. Pessimistic Scenario
22.4. Key Factors Impacting the Market
23. Assumptions and Acronyms Used
24. Research Methodology
List of Tables
Table 1: Global Organic wine Market Value (US$ Mn) and Forecast by Region, 2015–2019
Table 2: Global Organic wine Market Value (US$ Mn) and Forecast by Region, 2020–2030
Table 3: Global Organic wine Market Volume (Metric Tons) and Forecast by Region, 2015–2019
Table 4: Global Organic wine Market Volume (Metric Tons) and Forecast by Region, 2020–2030
Table 5: Global Organic wine Market Value (US$ Mn) and Forecast by Packaging, 2015–2019
Table 6: Global Organic wine Market Value (US$ Mn) and Forecast by Packaging, 2020–2030
Table 7: Global Organic wine Market Volume (Metric Tons) and Forecast by Packaging, 2015–2019
Table 8: Global Organic wine Market Volume (Metric Tons) and Forecast by Packaging, 2020–2030
Table 9: Global Organic wine Market Value (US$ Mn) and Forecast by Product Type, 2015–2019
Table 10: Global Organic wine Market Value (US$ Mn) and Forecast by Product Type, 2020–2030
Table 11: Global Organic wine Market Volume (Metric Tons) and Forecast by Product Type, 2015–2019
Table 12: Global Organic wine Market Volume (Metric Tons) and Forecast by Product Type, 2020–2030
Table 13: Global Organic wine Market Value (US$ Mn) and Forecast by Distribution Channel, 2015–2019
Table 14: Global Organic wine Market Value (US$ Mn) and Forecast by Distribution Channel, 2020–2030
Table 15: Global Organic wine Market Volume (Metric Tons) and Forecast by Distribution Channel, 2015–2019
Table 16: Global Organic wine Market Volume (Metric Tons) and Forecast by Distribution Channel, 2020–2030
Table 17: North America Organic wine Market Value (US$ Mn) and Forecast by Region, 2015–2019
Table 18: North America Organic wine Market Value (US$ Mn) and Forecast by Region, 2020–2030
Table 19: North America Organic wine Market Volume (Metric Tons) and Forecast by Region, 2015–2019
Table 20: North America Organic wine Market Volume (Metric Tons) and Forecast by Region, 2020–2030
Table 21: North America Organic wine Market Value (US$ Mn) and Forecast by Packaging, 2015–2019
Table 22: North America Organic wine Market Value (US$ Mn) and Forecast by Packaging, 2020–2030
Table 23: North America Organic wine Market Volume (Metric Tons) and Forecast by Packaging, 2015–2019
Table 24: North America Organic wine Market Volume (Metric Tons) and Forecast by Packaging, 2020–2030
Table 25: North America Organic wine Market Value (US$ Mn) and Forecast by Product Type, 2015–2019
Table 26: North America Organic wine Market Value (US$ Mn) and Forecast by Product Type, 2020–2030
Table 27: North America Organic wine Market Volume (Metric Tons) and Forecast by Product Type, 2015–2019
Table 28: North America Organic wine Market Volume (Metric Tons) and Forecast by Product Type, 2020–2030
Table 29: North America Organic wine Market Value (US$ Mn) and Forecast by Distribution Channel, 2015–2019
Table 30: North America Organic wine Market Value (US$ Mn) and Forecast by Distribution Channel, 2020–2030
Table 31: North America Organic wine Market Volume (Metric Tons) and Forecast by Distribution Channel, 2015–2019
Table 32: North America Organic wine Market Volume (Metric Tons) and Forecast by Distribution Channel, 2020–2030
Table 33: Latin America Organic wine Market Value (US$ Mn) and Forecast by Region, 2015–2019
Table 34: Latin America Organic wine Market Value (US$ Mn) and Forecast by Region, 2020–2030
Table 35: Latin America Organic wine Market Volume (Metric Tons) and Forecast by Region, 2015–2019
Table 36: Latin America Organic wine Market Volume (Metric Tons) and Forecast by Region, 2020–2030
Table 37: Latin America Organic wine Market Value (US$ Mn) and Forecast by Packaging, 2015–2019
Table 38: Latin America Organic wine Market Value (US$ Mn) and Forecast by Packaging, 2020–2030
Table 39: Latin America Organic wine Market Volume (Metric Tons) and Forecast by Packaging, 2015–2019
Table 40: Latin America Organic wine Market Volume (Metric Tons) and Forecast by Packaging, 2020–2030
Table 41: Latin America Organic wine Market Value (US$ Mn) and Forecast by Product Type, 2015–2019
Table 42: Latin America Organic wine Market Value (US$ Mn) and Forecast by Product Type, 2020–2030
Table 43: Latin America Organic wine Market Volume (Metric Tons) and Forecast by Product Type, 2015–2019
Table 44: Latin America Organic wine Market Volume (Metric Tons) and Forecast by Product Type, 2020–2030
Table 45: Latin America Organic wine Market Value (US$ Mn) and Forecast by Distribution Channel, 2015–2019
Table 46: Latin America Organic wine Market Value (US$ Mn) and Forecast by Distribution Channel, 2020–2030
Table 47: Latin America Organic wine Market Volume (Metric Tons) and Forecast by Distribution Channel, 2015–2019
Table 48: Latin America Organic wine Market Volume (Metric Tons) and Forecast by Distribution Channel, 2020–2030
Table 49: Europe Organic wine Market Value (US$ Mn) and Forecast by Region, 2015–2019
Table 50: Europe Organic wine Market Value (US$ Mn) and Forecast by Region, 2020–2030
Table 51: Europe Organic wine Market Volume (Metric Tons) and Forecast by Region, 2015–2019
Table 52: Europe Organic wine Market Volume (Metric Tons) and Forecast by Region, 2020–2030
Table 53: Europe Organic wine Market Value (US$ Mn) and Forecast by Packaging, 2015–2019
Table 54: Europe Organic wine Market Value (US$ Mn) and Forecast by Packaging, 2020–2030
Table 55: Europe Organic wine Market Volume (Metric Tons) and Forecast by Packaging, 2015–2019
Table 56: Europe Organic wine Market Volume (Metric Tons) and Forecast by Packaging, 2020–2030
Table 57: Europe Organic wine Market Value (US$ Mn) and Forecast by Product Type, 2015–2019
Table 58: Europe Organic wine Market Value (US$ Mn) and Forecast by Product Type, 2020–2030
Table 59: Europe Organic wine Market Volume (Metric Tons) and Forecast by Product Type, 2015–2019
Table 60: Europe Organic wine Market Volume (Metric Tons) and Forecast by Product Type, 2020–2030
Table 61: Europe Organic wine Market Value (US$ Mn) and Forecast by Distribution Channel, 2015–2019
Table 62: Europe Organic wine Market Value (US$ Mn) and Forecast by Distribution Channel, 2020–2030
Table 63: Europe Organic wine Market Volume (Metric Tons) and Forecast by Distribution Channel, 2015–2019
Table 64: Europe Organic wine Market Volume (Metric Tons) and Forecast by Distribution Channel, 2020–2030
Table 65: Asia Pacific Excluding Japan Organic wine Market Value (US$ Mn) and Forecast by Region, 2015–2019
Table 66: Asia Pacific Excluding Japan Organic wine Market Value (US$ Mn) and Forecast by Region, 2020–2030
Table 67: Asia Pacific Excluding Japan Organic wine Market Volume (Metric Tons) and Forecast by Region, 2015–2019
Table 68: Asia Pacific Excluding Japan Organic wine Market Volume (Metric Tons) and Forecast by Region, 2020–2030
Table 69: Asia Pacific Excluding Japan Organic wine Market Value (US$ Mn) and Forecast by Packaging, 2015–2019
Table 70: Asia Pacific Excluding Japan Organic wine Market Value (US$ Mn) and Forecast by Packaging, 2020–2030
Table 71: Asia Pacific Excluding Japan Organic wine Market Volume (Metric Tons) and Forecast by Packaging, 2015–2019
Table 72: Asia Pacific Excluding Japan Organic wine Market Volume (Metric Tons) and Forecast by Packaging, 2020–2030
Table 73: Asia Pacific Excluding Japan Organic wine Market Value (US$ Mn) and Forecast by Product Type, 2015–2019
Table 74: Asia Pacific Excluding Japan Organic wine Market Value (US$ Mn) and Forecast by Product Type, 2020–2030
Table 75: Asia Pacific Excluding Japan Organic wine Market Volume (Metric Tons) and Forecast by Product Type, 2015–2019
Table 76: Asia Pacific Excluding Japan Organic wine Market Volume (Metric Tons) and Forecast by Product Type, 2020–2030
Table 77: Asia Pacific Excluding Japan Organic wine Market Value (US$ Mn) and Forecast by Distribution Channel, 2015–2019
Table 78: Asia Pacific Excluding Japan Organic wine Market Value (US$ Mn) and Forecast by Distribution Channel, 2020–2030
Table 79: Asia Pacific Excluding Japan Organic wine Market Volume (Metric Tons) and Forecast by Distribution Channel, 2015–2019
Table 80: Asia Pacific Excluding Japan Organic wine Market Volume (Metric Tons) and Forecast by Distribution Channel, 2020–2030
Table 81: Japan Organic wine Market Value (US$ Mn) and Forecast by Region, 2015–2019
Table 82: Japan Organic wine Market Value (US$ Mn) and Forecast by Region, 2020–2030
Table 83: Japan Organic wine Market Volume (Metric Tons) and Forecast by Region, 2015–2019
Table 84: Japan Organic wine Market Volume (Metric Tons) and Forecast by Region, 2020–2030
Table 85: Japan Organic wine Market Value (US$ Mn) and Forecast by Packaging, 2015–2019
Table 86: Japan Organic wine Market Value (US$ Mn) and Forecast by Packaging, 2020–2030
Table 87: Japan Organic wine Market Volume (Metric Tons) and Forecast by Packaging, 2015–2019
Table 88: Japan Organic wine Market Volume (Metric Tons) and Forecast by Packaging, 2020–2030
Table 89: Japan Organic wine Market Value (US$ Mn) and Forecast by Product Type, 2015–2019
Table 90: Japan Organic wine Market Value (US$ Mn) and Forecast by Product Type, 2020–2030
Table 91: Japan Organic wine Market Volume (Metric Tons) and Forecast by Product Type, 2015–2019
Table 92: Japan Organic wine Market Volume (Metric Tons) and Forecast by Product Type, 2020–2030
Table 93: Japan Organic wine Market Value (US$ Mn) and Forecast by Distribution Channel, 2015–2019
Table 94: Japan Organic wine Market Value (US$ Mn) and Forecast by Distribution Channel, 2020–2030
Table 95: Japan Organic wine Market Volume (Metric Tons) and Forecast by Distribution Channel, 2015–2019
Table 96: Japan Organic wine Market Volume (Metric Tons) and Forecast by Distribution Channel, 2020–2030
Table 97: Oceania Organic wine Market Value (US$ Mn) and Forecast by Region, 2015–2019
Table 98: Oceania Organic wine Market Value (US$ Mn) and Forecast by Region, 2020–2030
Table 99: Oceania Organic wine Market Volume (Metric Tons) and Forecast by Region, 2015–2019
Table 100: Oceania Organic wine Market Volume (Metric Tons) and Forecast by Region, 2020–2030
Table 101: Oceania Organic wine Market Value (US$ Mn) and Forecast by Packaging, 2015–2019
Table 102: Oceania Organic wine Market Value (US$ Mn) and Forecast by Packaging, 2020–2030
Table 103: Oceania Organic wine Market Volume (Metric Tons) and Forecast by Packaging, 2015–2019
Table 104: Oceania Organic wine Market Volume (Metric Tons) and Forecast by Packaging, 2020–2030
Table 105: Oceania Organic wine Market Value (US$ Mn) and Forecast by Product Type, 2015–2019
Table 106: Oceania Organic wine Market Value (US$ Mn) and Forecast by Product Type, 2020–2030
Table 107: Oceania Organic wine Market Volume (Metric Tons) and Forecast by Product Type, 2015–2019
Table 108: Oceania Organic wine Market Volume (Metric Tons) and Forecast by Product Type, 2020–2030
Table 109: Oceania Organic wine Market Value (US$ Mn) and Forecast by Distribution Channel, 2015–2019
Table 110: Oceania Organic wine Market Value (US$ Mn) and Forecast by Distribution Channel, 2020–2030
Table 111: Oceania Organic wine Market Volume (Metric Tons) and Forecast by Distribution Channel, 2015–2019
Table 112: Oceania Organic wine Market Volume (Metric Tons) and Forecast by Distribution Channel, 2020–2030
Table 113: Middle East & Africa Organic wine Market Value (US$ Mn) and Forecast by Region, 2015–2019
Table 114: Middle East & Africa Organic wine Market Value (US$ Mn) and Forecast by Region, 2020–2030
Table 115: Middle East & Africa Organic wine Market Volume (Metric Tons) and Forecast by Region, 2015–2019
Table 116: Middle East & Africa Organic wine Market Volume (Metric Tons) and Forecast by Region, 2020–2030
Table 117: Middle East & Africa Organic wine Market Value (US$ Mn) and Forecast by Packaging, 2015–2019
Table 118: Middle East & Africa Organic wine Market Value (US$ Mn) and Forecast by Packaging, 2020–2030
Table 119: Middle East & Africa Organic wine Market Volume (Metric Tons) and Forecast by Packaging, 2015–2019
Table 120: Middle East & Africa Organic wine Market Volume (Metric Tons) and Forecast by Packaging, 2020–2030
Table 121: Middle East & Africa Organic wine Market Value (US$ Mn) and Forecast by Product Type, 2015–2019
Table 122: Middle East & Africa Organic wine Market Value (US$ Mn) and Forecast by Product Type, 2020–2030
Table 123: Middle East & Africa Organic wine Market Volume (Metric Tons) and Forecast by Product Type, 2015–2019
Table 124: Middle East & Africa Organic wine Market Volume (Metric Tons) and Forecast by Product Type, 2020–2030
Table 125: Middle East & Africa Organic wine Market Value (US$ Mn) and Forecast by Distribution Channel, 2015–2019
Table 126: Middle East & Africa Organic wine Market Value (US$ Mn) and Forecast by Distribution Channel, 2020–2030
Table 127: Middle East & Africa Organic wine Market Volume (Metric Tons) and Forecast by Distribution Channel, 2015–2019
Table 128: Middle East & Africa Organic wine Market Volume (Metric Tons) and Forecast by Distribution Channel, 2020–2030
List of Figures
Figure 1: Global Organic wine Market Value (US$ Mn) and Volume (MT) Forecast, 2020–2030
Figure 2: Global Organic wine Market Absolute $ Opportunity (US$ Mn), 2020?2030
Figure 3: Global Organic wine Market Value (US$ Mn) and % Growth by Region, 2020 & 2030
Figure 4: Global Organic wine Market Y-o-Y Growth Rate by Region, 2020 - 2030
Figure 5: Global Organic wine Market Value (US$ Mn) and % Growth by Packaging, 2020 & 2030
Figure 6: Global Organic wine Market Y-o-Y Growth Rate by Packaging, 2020 - 2030
Figure 7: Global Organic wine Market Value (US$ Mn) and % Growth by Product Type, 2020 & 2030
Figure 8: Global Organic wine Market Y-o-Y Growth Rate by Product Type, 2020 - 2030
Figure 9: Global Organic wine Market Value (US$ Mn) and % Growth by Distribution Channel, 2020 & 2030
Figure 10: Global Organic wine Market Y-o-Y Growth Rate by Distribution Channel, 2020 - 2030
Figure 11: Global Organic wine Market Attractiveness Analysis by Region, 2020 - 2030
Figure 12: Global Organic wine Market Attractiveness Analysis by Packaging, 2020 - 2030
Figure 13: Global Organic wine Market Attractiveness Analysis by Product Type, 2020 - 2030
Figure 14: Global Organic wine Market Attractiveness Analysis by Distribution Channel, 2020 - 2030
Figure 15: North America Organic wine Market Value (US$ Mn) and Volume (MT) Forecast, 2020–2030
Figure 16: North America Organic wine Market Absolute $ Opportunity (US$ Mn), 2020–2030
Figure 17: North America Organic wine Market Value (US$ Mn) and % Growth by Region, 2020 & 2030
Figure 18: North America Organic wine Market Y-o-Y Growth Rate by Region, 2020 - 2030
Figure 19: North America Organic wine Market Value (US$ Mn) and % Growth by Packaging, 2020 & 2030
Figure 20: North America Organic wine Market Y-o-Y Growth Rate by Packaging, 2020 - 2030
Figure 21: North America Organic wine Market Value (US$ Mn) and % Growth by Product Type, 2020 & 2030
Figure 22: North America Organic wine Market Y-o-Y Growth Rate by Product Type, 2020 - 2030
Figure 23: North America Organic wine Market Value (US$ Mn) and % Growth by Distribution Channel, 2020 & 2030
Figure 24: North America Organic wine Market Y-o-Y Growth Rate by Distribution Channel, 2020 - 2030
Figure 25: North America Organic wine Market Attractiveness Analysis by Region, 2020 - 2030
Figure 26: North America Organic wine Market Attractiveness Analysis by Packaging, 2020 - 2030
Figure 27: North America Organic wine Market Attractiveness Analysis by Product Type, 2020 - 2030
Figure 28: North America Organic wine Market Attractiveness Analysis by Distribution Channel, 2020 - 2030
Figure 29: Latin America Organic wine Market Value (US$ Mn) and Volume (MT) Forecast, 2020–2030
Figure 30: Latin America Organic wine Market Absolute $ Opportunity (US$ Mn), 2020–2030
Figure 31: Latin America Organic wine Market Value (US$ Mn) and % Growth by Region, 2020 & 2030
Figure 32: Latin America Organic wine Market Y-o-Y Growth Rate by Region, 2020 - 2030
Figure 33: Latin America Organic wine Market Value (US$ Mn) and % Growth by Packaging, 2020 & 2030
Figure 34: Latin America Organic wine Market Y-o-Y Growth Rate by Packaging, 2020 - 2030
Figure 35: Latin America Organic wine Market Value (US$ Mn) and % Growth by Product Type, 2020 & 2030
Figure 36: Latin America Organic wine Market Y-o-Y Growth Rate by Product Type, 2020 - 2030
Figure 37: Latin America Organic wine Market Value (US$ Mn) and % Growth by Distribution Channel, 2020 & 2030
Figure 38: Latin America Organic wine Market Y-o-Y Growth Rate by Distribution Channel, 2020 - 2030
Figure 39: Latin America Organic wine Market Attractiveness Analysis by Region, 2020 - 2030
Figure 40: Latin America Organic wine Market Attractiveness Analysis by Packaging, 2020 - 2030
Figure 41: Latin America Organic wine Market Attractiveness Analysis by Product Type, 2020 - 2030
Figure 42: Latin America Organic wine Market Attractiveness Analysis by Distribution Channel, 2020 - 2030
Figure 43: Europe Organic wine Market Value (US$ Mn) and Volume (MT) Forecast, 2020–2030
Figure 44: Europe Organic wine Market Absolute $ Opportunity (US$ Mn), 2020–2030
Figure 45: Europe Organic wine Market Value (US$ Mn) and % Growth by Region, 2020 & 2030
Figure 46: Europe Organic wine Market Y-o-Y Growth Rate by Region, 2020 - 2030
Figure 47: Europe Organic wine Market Value (US$ Mn) and % Growth by Packaging, 2020 & 2030
Figure 48: Europe Organic wine Market Y-o-Y Growth Rate by Packaging, 2020 - 2030
Figure 49: Europe Organic wine Market Value (US$ Mn) and % Growth by Product Type, 2020 & 2030
Figure 50: Europe Organic wine Market Y-o-Y Growth Rate by Product Type, 2020 - 2030
Figure 51: Europe Organic wine Market Value (US$ Mn) and % Growth by Distribution Channel, 2020 & 2030
Figure 52: Europe Organic wine Market Y-o-Y Growth Rate by Distribution Channel, 2020 - 2030
Figure 53: Europe Organic wine Market Attractiveness Analysis by Region, 2020 - 2030
Figure 54: Europe Organic wine Market Attractiveness Analysis by Packaging, 2020 - 2030
Figure 55: Europe Organic wine Market Attractiveness Analysis by Product Type, 2020 - 2030
Figure 56: Europe Organic wine Market Attractiveness Analysis by Distribution Channel, 2020 - 2030
Figure 57: Asia Pacific Excluding Japan Organic wine Market Value (US$ Mn) and Volume (MT) Forecast, 2020–2030
Figure 58: Asia Pacific Excluding Japan Organic wine Market Absolute $ Opportunity (US$ Mn), 2020–2030
Figure 59: Asia Pacific Excluding Japan Organic wine Market Value (US$ Mn) and % Growth by Region, 2020 & 2030
Figure 60: Asia Pacific Excluding Japan Organic wine Market Y-o-Y Growth Rate by Region, 2020 - 2030
Figure 61: Asia Pacific Excluding Japan Organic wine Market Value (US$ Mn) and % Growth by Packaging, 2020 & 2030
Figure 62: Asia Pacific Excluding Japan Organic wine Market Y-o-Y Growth Rate by Packaging, 2020 - 2030
Figure 63: Asia Pacific Excluding Japan Organic wine Market Value (US$ Mn) and % Growth by Product Type, 2020 & 2030
Figure 64: Asia Pacific Excluding Japan Organic wine Market Y-o-Y Growth Rate by Product Type, 2020 - 2030
Figure 65: Asia Pacific Excluding Japan Organic wine Market Value (US$ Mn) and % Growth by Distribution Channel, 2020 & 2030
Figure 66: Asia Pacific Excluding Japan Organic wine Market Y-o-Y Growth Rate by Distribution Channel, 2020 - 2030
Figure 67: Asia Pacific Excluding Japan Organic wine Market Attractiveness Analysis by Region, 2020 - 2030
Figure 68: Asia Pacific Excluding Japan Organic wine Market Attractiveness Analysis by Packaging, 2020 - 2030
Figure 69: Asia Pacific Excluding Japan Organic wine Market Attractiveness Analysis by Product Type, 2020 - 2030
Figure 70: Asia Pacific Excluding Japan Organic wine Market Attractiveness Analysis by Distribution Channel, 2020 - 2030
Figure 71: Japan Organic wine Market Value (US$ Mn) and Volume (MT) Forecast, 2020–2030
Figure 72: Japan Organic wine Market Absolute $ Opportunity (US$ Mn), 2020–2030
Figure 73: Japan Organic wine Market Value (US$ Mn) and % Growth by Region, 2020 & 2030
Figure 74: Japan Organic wine Market Y-o-Y Growth Rate by Region, 2020 - 2030
Figure 75: Japan Organic wine Market Value (US$ Mn) and % Growth by Packaging, 2020 & 2030
Figure 76: Japan Organic wine Market Y-o-Y Growth Rate by Packaging, 2020 - 2030
Figure 77: Japan Organic wine Market Value (US$ Mn) and % Growth by Product Type, 2020 & 2030
Figure 78: Japan Organic wine Market Y-o-Y Growth Rate by Product Type, 2020 - 2030
Figure 79: Japan Organic wine Market Value (US$ Mn) and % Growth by Distribution Channel, 2020 & 2030
Figure 80: Japan Organic wine Market Y-o-Y Growth Rate by Distribution Channel, 2020 - 2030
Figure 81: Japan Organic wine Market Attractiveness Analysis by Region, 2020 - 2030
Figure 82: Japan Organic wine Market Attractiveness Analysis by Packaging, 2020 - 2030
Figure 83: Japan Organic wine Market Attractiveness Analysis by Product Type, 2020 - 2030
Figure 84: Japan Organic wine Market Attractiveness Analysis by Distribution Channel, 2020 - 2030
Figure 85: Oceania Organic wine Market Value (US$ Mn) and Volume (MT) Forecast, 2020–2030
Figure 86: Oceania Organic wine Market Absolute $ Opportunity (US$ Mn), 2020–2030
Figure 87: Oceania Organic wine Market Value (US$ Mn) and % Growth by Region, 2020 & 2030
Figure 88: Oceania Organic wine Market Y-o-Y Growth Rate by Region, 2020 - 2030
Figure 89: Oceania Organic wine Market Value (US$ Mn) and % Growth by Packaging, 2020 & 2030
Figure 90: Oceania Organic wine Market Y-o-Y Growth Rate by Packaging, 2020 - 2030
Figure 91: Oceania Organic wine Market Value (US$ Mn) and % Growth by Product Type, 2020 & 2030
Figure 92: Oceania Organic wine Market Y-o-Y Growth Rate by Product Type, 2020 - 2030
Figure 93: Oceania Organic wine Market Value (US$ Mn) and % Growth by Distribution Channel, 2020 & 2030
Figure 94: Oceania Organic wine Market Y-o-Y Growth Rate by Distribution Channel, 2020 - 2030
Figure 95: Oceania Organic wine Market Attractiveness Analysis by Region, 2020 - 2030
Figure 96: Oceania Organic wine Market Attractiveness Analysis by Packaging, 2020 - 2030
Figure 97: Oceania Organic wine Market Attractiveness Analysis by Product Type, 2020 - 2030
Figure 98: Oceania Organic wine Market Attractiveness Analysis by Distribution Channel, 2020 - 2030
Figure 99: Middle East & Africa Organic wine Market Value (US$ Mn) and Volume (MT) Forecast, 2020–2030
Figure 100: Middle East & Africa Organic wine Market Absolute $ Opportunity (US$ Mn), 2020–2030
Figure 101: Middle East & Africa Organic wine Market Value (US$ Mn) and % Growth by Region, 2020 & 2030
Figure 102: Middle East & Africa Organic wine Market Y-o-Y Growth Rate by Region, 2020 - 2030
Figure 103: Middle East & Africa Organic wine Market Value (US$ Mn) and % Growth by Packaging, 2020 & 2030
Figure 104: Middle East & Africa Organic wine Market Y-o-Y Growth Rate by Packaging, 2020 - 2030
Figure 105: Middle East & Africa Organic wine Market Value (US$ Mn) and % Growth by Product Type, 2020 & 2030
Figure 106: Middle East & Africa Organic wine Market Y-o-Y Growth Rate by Product Type, 2020 - 2030
Figure 107: Middle East & Africa Organic wine Market Value (US$ Mn) and % Growth by Distribution Channel, 2020 & 2030
Figure 108: Middle East & Africa Organic wine Market Y-o-Y Growth Rate by Distribution Channel, 2020 - 2030
Figure 109: Middle East & Africa Organic wine Market Attractiveness Analysis by Region, 2020 - 2030
Figure 110: Middle East & Africa Organic wine Market Attractiveness Analysis by Packaging, 2020 - 2030
Figure 111: Middle East & Africa Organic wine Market Attractiveness Analysis by Product Type, 2020 - 2030
Figure 112: Middle East & Africa Organic wine Market Attractiveness Analysis by Distribution Channel, 2020 - 2030
Copyright © Transparency Market Research, Inc. All Rights reserved
Trust Online

Organic Wine Market
