Global Offshore AUV and ROV Market: Snapshot
The global offshore AUV and ROV market is largely consolidated that features intense competition amongst well-entrenched players. Technological innovation is what key players are focused on to gain competitive advantage in this intensely competitive market.
The ever-increasing demand for oil and gas and near exhaustion of near-shore and onshore reserves have necessitated the exploration of deep water reserves. This is leading to the increasing employment of high technology based remotely operated vehicles (ROVs) that can tap reserves buried thousands of meters deep on the ocean floor.
On the other hand, autonomous underwater vehicles (AUVs) find extensive application in navigation systems of marine vehicles to raise alerts regarding submerged rocks, wrecks, and obstructions that can cause accidents. AUVs that are based on advanced technology operate sans human controllers to conduct a mission.
As per estimations of a report by Transparency Market Research (TMR), the global offshore AUV and ROV market will expand at an impressive 18.2% CAGR in terms of revenue between 2017 and 2025, for the market to become worth US$9117.01 mn by 2025-end from US$2065.56 mn in 2016.
Low Developmental and Maintenance Costs Favor Growth in ROV Product Segment
The report studies the global offshore AUV and ROV market on the basis of propulsion system, product type, application, and geography. Based on propulsion system, the market could be fragmented into mechanical system, electric system, hybrid system, and others. Amongst all, the electric propulsion system segment held the leading market share in 2016. The demand for electric propulsion system is on account of its advantages of low weight and simplicity in smaller ROV, versatility, ease of packaging, reliability, and low noise as compared to mechanical propulsion systems. The low cost factor also significantly accounts for the preference for electric propulsion systems.
Based on product type, the global offshore AUV and ROV market has been bifurcated into ROV product and AUV product. ROV products are further sub-segmented into small vehicle, high capacity electric vehicle, heavy work class vehicle, and work class vehicle. AUV products are further split into man portable, light weight vehicle, heavy weight vehicle, and large vehicle. Of the two, ROV products held the leading market share of 77% in 2016.
Application-wise, the global offshore AUV and ROV market has been categorized into oil and gas, commercial, defense, scientific research, and others. Of them, oil and gas segment occupied the leading share of the market in 2016, followed by defense and scientific research.
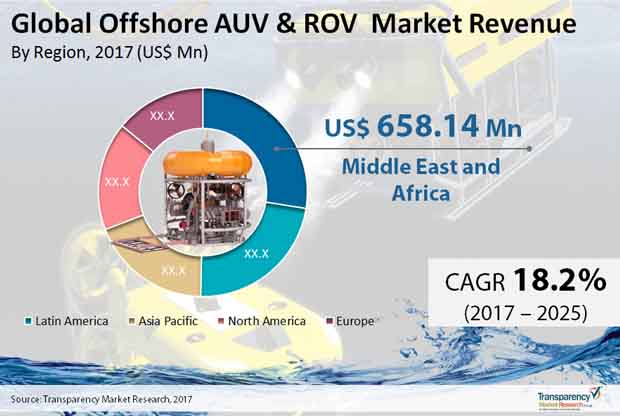
Middle East and Africa Market to Remain Dominant
Region-wise, the report takes stock of the potential of offshore AUV and ROV market in the regions of North America, Europe, Asia Pacific, Latin America, and the Middle East and Africa. Amongst all, in 2016, the Middle East and Africa held the leading share of close to 27% in the overall market followed by Latin America. Going forward, the region is anticipated to display the leading CAGR of 20.3% between 2017 and 2025 for the demand to attract a revenue of US$2,890.63 by 2025 end. The vast abundance of oil and mineral deposits coupled with the rapidly increasing demand for oil account for the growth of the offshore AUV and ROV market in this region.
On the other hand, the demand in Latin America is anticipated to attract a handsome revenue of US$2,145.10 by the end of 2025. Offshore oil and gas activities are largely concentrated in Brazil and Mexico in this region.
The report profiles leading players in the global offshore AUV and ROV market, namely Subsea 7 Inc., SAAB AB, Fugro NV, Ocean Engineering Ltd., Bluefin Robotics, Atlas Electronik GmbH, Kongsberg Maritime, Teledyne Technologies LLC, BIRNS Inc., International Submarine Engineering Ltd., Schilling Robotics LLC, and Oceaneering International Inc.
Offshore AUV & ROV Market - Snapshot
The worldwide offshore AUV and ROV market is generally united that highlights serious rivalry among all around dug in players. Technological innovation is the thing that central participants are centered around to acquire an upper hand in this seriously aggressive market. The steadily expanding demand for oil and gas and close to fatigue of close shore and inland reserves have required the investigation of deepwater reserves. This is prompting the expanding work of high innovation based remotely operated vehicles (ROVs) that can tap reserves covered huge number of meters deep on the sea floor.
Then again, independent submerged vehicles (AUVs) discover broad application in route frameworks of marine vehicles to raise cautions with respect to lowered rocks, wrecks, and impediments that can cause mishaps. AUVs that depend on cutting edge innovation work sans human controllers to direct a mission. The oil and gas area is required to keep up its predominance in the market concentrated over the gauge period. ROVs are broadly utilized across all periods of the offshore oilfield life cycle. They are likewise utilized for offshore penetrating help and vessel-based administrations, including subsea hardware establishment, construction, pipeline inspection, study and offices inspection, support, and repair.
In 2018, Brazil and the United States together represented over 90% of ultra-deepwater creation around the world. The presence of the most experienced international oil companies in the deepwater improvement and biggest deepwater reserves makes the United States and Brazil the most appealing nations for upstream deepwater speculation. In addition, creation from the deepwater fields delivered or being worked on is relied upon to arrive at 7.6 million barrel each day by 2025 and 9 million barrel each day by 2040, in this manner boosting the market development concentrated during the figure time frame. Then again, more than 950,000 ton of outside areas are slated for removal across the North Sea, of which more than 605,000.
1. Preface
1.1. Report Scope and Market Segmentation
1.2. Research Highlights
2. Assumptions and Research Methodology
2.1. Assumptions and Acronyms Used
2.2. Research Methodology
3. Executive Summary
3.1. Market Size, Global Offshore AUV & ROV Market (US$ Mn)
3.2. Key Trends
4. Market Overview
4.1. Product Overview
4.2. Key Market Developments
4.3. Market Indicators
4.4. Market Dynamics
4.4.1. Drivers
4.4.2. Restraints
4.4.3. Key Opportunities
4.5. Porter’s Analysis
4.5.1. Threat of Substitutes
4.5.2. Bargaining Power of Buyers
4.5.3. Bargaining Power of Suppliers
4.5.4. Threat of New Entrants
4.5.5. Degree of Competition
4.6. Value Chain Analysis
4.7. Buyer Behavior in AUV & ROV Market
4.8. Regulatory Scenario
4.9. SWOT Analysis
4.10. Hybrid AUV/ROV Overview
5. Global AUV & ROV Market – Outlook and Price Analysis
6. Global AUV & ROV Market – Maintenance Repair Overhaul (MRO)
7. Global Offshore AUV & ROV Market– Supply Demand Scenario
8. Global Offshore AUV & ROV Market Analysis, by Propulsion
8.1. Introduction
8.2. Key Findings
8.3. Offshore AUV & ROV Market Analysis, by Propulsion
8.4. Offshore AUV & ROV Market Attractiveness Analysis, by Propulsion
8.5. Comparison Matrix by Propulsion
9. Global Offshore AUV & ROV Market Analysis by Product
9.1. Introduction
9.2. Key Findings
9.3. Offshore AUV & ROV Market Analysis, by Product
9.4. Offshore AUV & ROV Market Attractiveness Analysis, by Product
9.5. Comparison Matrix by Product
10. Global Offshore AUV & ROV Market Analysis by Application
10.1. Introduction
10.2. Key Findings
10.3. Offshore AUV & ROV Market Analysis, by Application
10.4. Offshore AUV & ROV Market Attractiveness Analysis, by Application
10.5. Comparison Matrix by Application
11. Global Offshore AUV & ROV Market Analysis and Forecasts, by Region
11.1. Global Offshore AUV & ROV Market Scenario, by Region, 2016
11.2. Key Findings
11.3. Offshore AUV & ROV Market Analysis, by Region
11.4. Offshore AUV & ROV Market Attractiveness Analysis, by Region
12. North America Offshore AUV & ROV Market Analysis
12.1. Key Findings
12.2. Offshore AUV & ROV Market Value Share Analysis, by Propulsion
12.3. Offshore AUV & ROV Market Value Share Analysis, by Product
12.4. Offshore AUV & ROV Market Value Share Analysis, by Application
12.5. Offshore AUV & ROV Market Value Share Analysis, by Country
12.6. North America Market Forecast, by Country, 2016- 2025
12.6.1. Massachusetts
12.6.2. Other U.S. states
12.6.3. Canada
12.7. Offshore AUV & ROV Market, Comparison Matrix by Propulsion
12.8. Offshore AUV & ROV Market, Comparison Matrix by Product
12.9. Offshore AUV & ROV Market, Comparison Matrix by Application
12.10. PEST Analysis
13. Europe Offshore AUV & ROV Market Analysis
13.1. Key Findings
13.2. Offshore AUV & ROV Market Value Share Analysis, by Propulsion
13.3. Offshore AUV & ROV Market Value Share Analysis, by Product
13.4. Offshore AUV & ROV Market Value Share Analysis, by Application
13.5. Offshore AUV & ROV Market Value Share Analysis, by Country
13.6. Europe Market Forecast, by Country, 2016- 2025
13.6.1. Germany
13.6.2. France
13.6.3. U.K.
13.6.4. Italy
13.6.5. Spain
13.6.6. Rest of Europe
13.7. Offshore AUV & ROV Market, Comparison Matrix by Propulsion
13.8. Offshore AUV & ROV Market, Comparison Matrix by Product
13.9. Offshore AUV & ROV Market, Comparison Matrix by Application
13.10. PEST Analysis
14. Asia-Pacific Offshore AUV & ROV Market Analysis
14.1. Key Findings
14.2. Offshore AUV & ROV Market Value Share Analysis, by Propulsion
14.3. Offshore AUV & ROV Market Value Share Analysis, by Product
14.4. Offshore AUV & ROV Market Value Share Analysis, by Application
14.5. Offshore AUV & ROV Market Value Share Analysis, by Country
14.6. Asia-Pacific Market Forecast, by Country, 20016- 2025
14.6.1. China
14.6.2. India
14.6.3. Japan
14.6.4. ASEAN
14.6.5. Rest of Asia Pacific
14.7. Offshore AUV & ROV Market, Comparison Matrix by Propulsion
14.8. Offshore AUV & ROV Market, Comparison Matrix by Product
14.9. Offshore AUV & ROV Market, Comparison Matrix by Application
14.10. PEST Analysis
15. Latin America Offshore AUV & ROV Market Analysis
15.1. Key Findings
15.2. Offshore AUV & ROV Market Value Share Analysis, by Propulsion
15.3. Offshore AUV & ROV Market Value Share Analysis, by Product
15.4. Offshore AUV & ROV Market Value Share Analysis, by Application
15.5. Offshore AUV & ROV Market Value Share Analysis, by Country
15.6. Latin America Market Forecast, by Country, 20016- 2025
15.6.1. Brazil
15.6.2. Mexico
15.6.3. Rest of Latin America
15.7. Offshore AUV & ROV Market, Comparison Matrix by Propulsion
15.8. Offshore AUV & ROV Market, Comparison Matrix by Product
15.9. Offshore AUV & ROV Market, Comparison Matrix by Application
15.10. PEST Analysis
16. Middle East & Africa Offshore AUV & ROV Market Analysis
16.1. Key Findings
16.2. Offshore AUV & ROV Market Value Share Analysis, by Propulsion
16.3. Offshore AUV & ROV Market Value Share Analysis, by Product
16.4. Offshore AUV & ROV Market Value Share Analysis, by Application
16.5. Offshore AUV & ROV Market Value Share Analysis, by Country
16.6. Middle East & Africa Market Forecast, by Country, 20016- 2025
16.6.1. GCC
16.6.2. Egypt
16.6.3. South Africa
16.6.4. Rest of Middle East & Africa
16.7. Offshore AUV & ROV Market, Comparison Matrix by Propulsion
16.8. Offshore AUV & ROV Market, Comparison Matrix by Product
16.9. Offshore AUV & ROV Market, Comparison Matrix by Application
16.10. PEST Analysis
17. Competition Landscape
17.1. Competition Matrix
17.2. Offshore AUV & ROV Market Share Analysis, by Company (2016)
17.3. Product Mapping
17.4. Company Profiles
17.4.1. Subsea 7 Inc.
17.4.1.1. Company Description
17.4.1.2. Business Overview
17.4.1.3. Overall Revenue
17.4.1.4. Strategic Overview
17.4.1.5. Recent Development
17.4.2. Saab AB
17.4.2.1. Company Description
17.4.2.2. Business Overview
17.4.2.3. Overall Revenue
17.4.2.4. Strategic Overview
17.4.2.5. Recent Development
17.4.2.6. Product Portfolio
17.4.3. Fugro NV
17.4.3.1. Company Description
17.4.3.2. Business Overview
17.4.3.3. Overall Revenue
17.4.3.4. Strategic Overview
17.4.3.5. Recent Development
17.4.3.6. Product Portfolio
17.4.4. Ocean Engineering Ltd.
17.4.4.1. Company Description
17.4.4.2. Business Overview
17.4.5. Bluefin Robotics
17.4.5.1. Company Description
17.4.5.2. Business Overview
17.4.5.3. Strategic Overview
17.4.5.4. Recent Development
17.4.5.5. Product Portfolio
17.4.6. Atlas Elektronik Gmbh
17.4.6.1. Company Description
17.4.6.2. Business Overview
17.4.6.3. Strategic Overview
17.4.6.4. Recent Development
17.4.6.5. Product Portfolio
17.4.7. Teledyne Technologies LLC
17.4.7.1. Company Description
17.4.7.2. Business Overview
17.4.7.3. Overall Revenue
17.4.7.4. Strategic Overview
17.4.7.5. Recent Development
17.4.8. Kongsberg Maritime
17.4.8.1. Company Description
17.4.8.2. Business Overview
17.4.8.3. Overall Revenue
17.4.8.4. Strategic Overview
17.4.8.5. Recent Development
17.4.8.6. Product Portfolio
17.4.9. BIRNS, INC.
17.4.9.1. Company Description
17.4.9.2. Business Overview
17.4.9.3. Strategic Overview
17.4.9.4. Recent Development
17.4.10. International Submarine Engineering Ltd.
17.4.10.1. Company Description
17.4.10.2. Business Overview
17.4.10.3. Strategic Overview
17.4.10.4. Recent Development
17.4.10.5. Product Portfolio
17.4.11. Technip FMC
17.4.11.1. Company Description
17.4.11.2. Business Overview
17.4.11.3. Overall Revenue
17.4.11.4. Strategic Overview
17.4.11.5. Recent Development
17.4.11.6. Product Portfolio
17.4.12. Oceaneering International Inc.
17.4.12.1. Company Description
17.4.12.2. Business Overview
17.4.12.3. Overall Revenue
17.4.12.4. Strategic Overview
17.4.12.5. Recent Development
17.4.12.6. Product Portfolio
18. Primary Research
List of Tables
Table 01: Global Offshore AUV & ROV Market Size (US$ Mn) Forecast, by Propulsion, 2016–2025
Table 02: Global Offshore AUV & ROV Market, Propulsion Comparison Matrix
Table 03: Global Offshore AUV & ROV Market Size (US$ Mn) Forecast, by Product, 2016–2025
Table 04: Global Offshore AUV & ROV Market, Product Comparison Matrix
Table 05: Global Offshore AUV & ROV Market Size (US$ Mn) Forecast, by Application , 2016–2025
Table 06: Global Offshore AUV & ROV Market, Application Comparison Matrix
Table 07: Global Offshore AUV & ROV Market Size (US$ Mn) and Forecast, by Region, 2016–2025
Table 08: North America Offshore AUV & ROV Market Size (US$ Mn) Forecast, by Propulsion, 2016–2025
Table 09: North America Offshore AUV & ROV Value (US$ Mn) Forecast, by Product, 2016–2025
Table 10: North America Offshore AUV & ROV Value (US$ Mn) Forecast, by Application, 2016–2025
Table 11: North America Offshore AUV & ROV Market Size (US$ Mn) and Forecast, by Country, 2016–2025
Table 12: U.S. Offshore AUV & ROV Market Size (US$ Mn) Forecast, by Propulsion, 2016–2025
Table 13: U.S. Offshore AUV & ROV Value (US$ Mn) Forecast, by Product, 2016–2025
Table 14: U.S. Offshore AUV & ROV Value (US$ Mn) Forecast, by Application, 2016–2025
Table 15: Canada Offshore AUV & ROV Market Size (US$ Mn) Forecast, by Propulsion, 2016–2025
Table 16: Canada Offshore AUV & ROV Value (US$ Mn) Forecast, by Product, 2016–2025
Table 17: Canada Offshore AUV & ROV Value (US$ Mn) Forecast, by Application, 2016–2025
Table 18: North America Offshore AUV & ROV Market, Comparison Matrix, by Propulsion
Table 19: North America Offshore AUV & ROV Market, Comparison Matrix, by Product
Table 20: North America Offshore AUV & ROV Market, Comparison Matrix, by Application
Table 21: Europe Offshore AUV & ROV Market Size (US$ Mn) Forecast, by Propulsion, 2016–2025
Table 22: Europe Offshore AUV & ROV Value (US$ Mn) Forecast, by Product , 2016–2025
Table 23: Europe Offshore AUV & ROV Value (US$ Mn) Forecast, by Application, 2016–2025
Table 24: Europe Offshore AUV & ROV Market Size (US$ Mn) and Forecast, by Country & Sub-region, 2016–2025
Table 25: U.K. Offshore AUV & ROV Market Size (US$ Mn) Forecast, by Propulsion, 2016–2025
Table 26: U.K. Offshore AUV & ROV Value (US$ Mn) Forecast, by Product, 2016–2025
Table 27: U.K. Offshore AUV & ROV Value (US$ Mn) Forecast, by Application, 2016–2025
Table 28: Germany Offshore AUV & ROV Market Size (US$ Mn) Forecast, by Propulsion, 2016–2025
Table 29: Germany Offshore AUV & ROV Value (US$ Mn) Forecast, by Product, 2016–2025
Table 30: Germany Offshore AUV & ROV Value (US$ Mn) Forecast, by Application, 2016–2025
Table 31: France Offshore AUV & ROV Market Size (US$ Mn) Forecast, by Propulsion, 2016–2025
Table 32: France Offshore AUV & ROV Value (US$ Mn) Forecast, by Product, 2016–2025
Table 33: France Offshore AUV & ROV Value (US$ Mn) Forecast, by Application, 2016–2025
Table 34: Italy Offshore AUV & ROV Market Size (US$ Mn) Forecast, by Propulsion, 2016–2025
Table 35: Italy Offshore AUV & ROV Value (US$ Mn) Forecast, by Product, 2016–2025
Table 36: Italy Offshore AUV & ROV Value (US$ Mn) Forecast, by Application, 2016–2025
Table 37: Spain Offshore AUV & ROV Market Size (US$ Mn) Forecast, by Propulsion, 2016–2025
Table 38: Spain Offshore AUV & ROV Value (US$ Mn) Forecast, by Product, 2016–2025
Table 39: Spain Offshore AUV & ROV Value (US$ Mn) Forecast, by Application, 2016–2025
Table 40: Rest of Europe Offshore AUV & ROV Market Size (US$ Mn) Forecast, by Propulsion, 2016–2025
Table 41: Rest of Europe Offshore AUV & ROV Value (US$ Mn) Forecast, by Product, 2016–2025
Table 42: Rest of Europe Offshore AUV & ROV Value (US$ Mn) Forecast, by Application, 2016–2025
Table 43: Europe Offshore AUV & ROV Market, Comparison Matrix by Propulsion
Table 44: Europe Offshore AUV & ROV Market, Comparison Matrix by Product
Table 45: Europe Offshore AUV & ROV Market, Comparison Matrix by Application
Table 46: Asia Pacific Offshore AUV & ROV Market Size (US$ Mn) Forecast, by Propulsion, 2016–2025
Table 47: Asia Pacific Offshore AUV & ROV Value (US$ Mn) Forecast, by Product, 2016–2025
Table 48: Asia Pacific Offshore AUV & ROV Value (US$ Mn) Forecast, by Application, 2016–2025
Table 49: Asia Pacific Offshore AUV & ROV Market Size (US$ Mn) and Forecast, by Country , 2016–2025
Table 50: China Offshore AUV & ROV Market Size (US$ Mn) Forecast, by Propulsion, 2016–2025
Table 51: China Offshore AUV & ROV Value (US$ Mn) Forecast, by Product, 2016–2025
Table 52: China Offshore AUV & ROV Value (US$ Mn) Forecast, by Application, 2016–2025
Table 53: India Offshore AUV & ROV Market Size (US$ Mn) Forecast, by Propulsion, 2016–2025
Table 54: India Offshore AUV & ROV Value (US$ Mn) Forecast, by Product, 2016–2025
Table 55: India Offshore AUV & ROV Value (US$ Mn) Forecast, by Application, 2016–2025
Table 56: Japan Offshore AUV & ROV Market Size (US$ Mn) Forecast, by Propulsion, 2016–2025
Table 57: Japan Offshore AUV & ROV Value (US$ Mn) Forecast, by Product, 2016–2025
Table 58: Japan Offshore AUV & ROV Value (US$ Mn) Forecast, by Application, 2016–2025
Table 59: ASEAN Offshore AUV & ROV Market Size (US$ Mn) Forecast, by Propulsion, 2016–2025
Table 60: ASEAN Offshore AUV & ROV Value (US$ Mn) Forecast, by Product, 2016–2025
Table 61: ASEAN Offshore AUV & ROV Value (US$ Mn) Forecast, by Application, 2016–2025
Table 62: Rest of Asia Pacific Offshore AUV & ROV Market Size (US$ Mn) Forecast, by Propulsion, 2016–2025
Table 63: Rest of Asia Pacific Offshore AUV & ROV Value (US$ Mn) Forecast, by Product, 2016–2025
Table 64: Rest of Asia Pacific Offshore AUV & ROV Value (US$ Mn) Forecast, by Application, 2016–2025
Table 65: Asia Pacific Offshore AUV & ROV Market, Comparison Matrix, by Propulsion
Table 66: Asia Pacific Offshore AUV & ROV Market, Comparison Matrix, by Product
Table 66: Asia Pacific Offshore AUV & ROV Market, Comparison Matrix, by Application
Table 67: Middle East & Africa Offshore AUV & ROV Market Size (US$ Mn) Forecast, by Propulsion, 2016–2025
Table 68: Middle East & Africa Offshore AUV & ROV Value (US$ Mn) Forecast, by Product, 2016–2025
Table 69: Middle East & Africa Offshore AUV & ROV Value (US$ Mn) Forecast, by Application, 2016–2025
Table 70: Middle East & Africa Offshore AUV & ROV Market Size (US$ Mn) and Forecast, by Country, 2016–2025
Table 71: GCC Offshore AUV & ROV Market Size (US$ Mn) Forecast, by Propulsion, 2016–2025
Table 72: GCC Offshore AUV & ROV Value (US$ Mn) Forecast, by Product, 2016–2025
Table 73: GCC Offshore AUV & ROV Value (US$ Mn) Forecast, by Application, 2016–2025
Table 74: South Africa Offshore AUV & ROV Market Size (US$ Mn) Forecast, by Propulsion, 2016–2025
Table 75: South Africa Offshore AUV & ROV Value (US$ Mn) Forecast, by Product, 2016–2025
Table 76: South Africa Offshore AUV & ROV Value (US$ Mn) Forecast, by Application, 2016–2025
Table 77: Rest of Middle East & Africa Offshore AUV & ROV Market Size (US$ Mn) Forecast, by Propulsion, 2016–2025
Table 78: Rest of Middle East & Africa Offshore AUV & ROV Value (US$ Mn) Forecast, by Product, 2016–2025
Table 79: Rest of Middle East & Africa Offshore AUV & ROV Value (US$ Mn) Forecast, by Application, 2016–2025
Table 80: Middle East & Africa Offshore AUV & ROV Market, Comparison Matrix, by Propulsion
Table 81: Middle East & Africa Offshore AUV & ROV Market, Comparison Matrix, by Product
Table 82: Middle East & Africa Offshore AUV & ROV Market, Comparison Matrix, by Application
Table 83: Latin America Offshore AUV & ROV Market Size (US$ Mn) Forecast, by Propulsion, 2016–2025
Table 84: Latin America Offshore AUV & ROV Value (US$ Mn) Forecast, by Product, 2016–2025
Table 85: Latin America Offshore AUV & ROV Value (US$ Mn) Forecast, by Application, 2016–2025
Table 86: Latin America Offshore AUV & ROV Market Size (US$ Mn) and Forecast, by Country, 2016–2025
Table 87: Brazil Offshore AUV & ROV Market Size (US$ Mn) Forecast, by Propulsion, 2016–2025
Table 88: Brazil Offshore AUV & ROV Value (US$ Mn) Forecast, by Product, 2016–2025
Table 89: Brazil Offshore AUV & ROV Value (US$ Mn) Forecast, by Application, 2016–2025
Table 90: Mexico Offshore AUV & ROV Market Size (US$ Mn) Forecast, by Propulsion, 2016–2025
Table 91: Mexico Offshore AUV & ROV Value (US$ Mn) Forecast, by Product, 2016–2025
Table 92: Mexico Offshore AUV & ROV Value (US$ Mn) Forecast, by Application, 2016–2025
Table 93: Rest of Latin America Offshore AUV & ROV Market Size (US$ Mn) Forecast, by Propulsion, 2016–2025
Table 94: Rest of Latin America Offshore AUV & ROV Value (US$ Mn) Forecast, by Product, 2016–2025
Table 95: Rest of Latin America Offshore AUV & ROV Value (US$ Mn) Forecast, by Application, 2016–2025
Table 96: Latin America Offshore AUV & ROV Market, Comparison Matrix, by Propulsion
Table 97: Latin America Offshore AUV & ROV Market, Comparison Matrix, by Product
Table 98: Latin America Offshore AUV & ROV Market, Comparison Matrix, by Application
Table 99: North America Offshore AUV & ROV Equipment Value (US$ Mn) Forecast, by Application, 2016–2025
Table 100: Europe Offshore AUV & ROV Equipment Value (US$ Mn) Forecast, by Application, 2016–2025
Table 101: Asia-Pacific Chemical Vapor Offshore AUV & ROV Equipment Value (US$ Mn) Forecast, by Application, 2016–2025
Table 102: Latin America Offshore AUV & ROV Equipment Value (US$ Mn) Forecast, by Application, 2016–2025
Table 103: Middle East & Africa Offshore AUV & ROV Equipment Value (US$ Mn) Forecast, by Application, 2016–2025
List of Figures
Figure 01: Offshore AUV & ROV Market Size, by Market Value (US$ Mn) Share and by Region, 2016
Figure 02: Regional Overview, 2016
Figure 03: Share Held by Top Two Categories of CVD, 2016–2025
Figure 04: Global Offshore AUV & ROV Market Value Share Analysis, by Propulsion, 2016 and 2025
Figure 05: Global Offshore AUV & ROV Market Revenue (US$ Mn) Analysis, by CVD Equipment, 2016–2025
Figure 06: Global Offshore AUV & ROV Market Revenue (US$ Mn) Analysis, by CVD Services, 2016–2025
Figure 07: Global Offshore AUV & ROV Market Revenue (US$ Mn) Analysis, by CVD Materials, 2016–2025
Figure 08: Global Offshore AUV & ROV Market Attractiveness Analysis, by Propulsion
Figure 09: Global Offshore AUV & ROV Market Value Share Analysis, by Product, 2016 and 2025
Figure 10: Global Offshore AUV & ROV Market Revenue (US$ Mn) Analysis, by Atomic Layer CVD, 2016–2025
Figure 11: Global Offshore AUV & ROV Market Revenue (US$ Mn) Analysis, by Laser-induced CVD, 2016–2025
Figure 12: Global Offshore AUV & ROV Market Revenue (US$ Mn) Analysis, by Organometallic CVD, 2016–2025
Figure 13: Global Offshore AUV & ROV Market Revenue (US$ Mn) Analysis, by Plasma Enhanced CVD, 2016–2025
Figure 14: Global Offshore AUV & ROV Market Revenue (US$ Mn) Analysis, by Plasma Assisted CVD, 2016–2025
Figure 15: Global Offshore AUV & ROV Market Revenue (US$ Mn) Analysis, by Low Pressure CVD, 2016–2025
Figure 16: Global Offshore AUV & ROV Market Revenue (US$ Mn) Analysis, by Others, 2016–2025
Figure 17: Global Offshore AUV & ROV Market Attractiveness Analysis, by Product
Figure 18: Global Offshore AUV & ROV Market Value Share Analysis, by Application, 2016 and 2025
Figure 19: Global Offshore AUV & ROV Market Revenue (US$ Mn) Analysis, by Coatings, 2016–2025
Figure 20: Global Offshore AUV & ROV Market Revenue (US$ Mn) Analysis, by Electronics, 2016–2025
Figure 21: Global Offshore AUV & ROV Market Revenue (US$ Mn) Analysis, by Catalysis, 2016–2025
Figure 22: Global Offshore AUV & ROV Market Revenue (US$ Mn) Analysis, by Others, 2016–2025
Figure 23: Global Offshore AUV & ROV Market Attractiveness Analysis, by Application
Figure 24: Global Offshore AUV & ROV Market Value Share Analysis, by Region, 2016 and 2025
Figure 25: Global Offshore AUV & ROV Market Attractiveness Analysis, by Region 2016–2025
Figure 26: North America Offshore AUV & ROV Market Value Share Analysis, by Propulsion, 2016 and 2025
Figure 27: North America Offshore AUV & ROV Market Value Share Analysis, by Product, 2016 and 2025
Figure 28: North America Offshore AUV & ROV Market Value Share Analysis, by Application, 2016 and 2025
Figure 29: North America Offshore AUV & ROV Market Value Share Analysis, by Country, 2016 and 2025
Figure 30: Europe Offshore AUV & ROV Market Value Share Analysis, by Propulsion, 2016 and 2025
Figure 31: Europe Offshore AUV & ROV Market Value Share Analysis, by Product, 2016 & 2025
Figure 32: Europe Offshore AUV & ROV Market Value Share Analysis, by Application, 2016 and 2025
Figure 33: Europe Offshore AUV & ROV Market Value Share Analysis, by Country & Sub-region, 2016 and 2025
Figure 34: Asia Pacific Offshore AUV & ROV Market Value Share Analysis, by Propulsion, 2016 and 2025
Figure 35: Asia Pacific Offshore AUV & ROV Market Value Share Analysis, by Product, 2016 and 2025
Figure 36: Asia Pacific Offshore AUV & ROV Market Value Share Analysis, by Application, 2016 and 2025
Figure 37 : Asia Pacific Offshore AUV & ROV Market Value Share Analysis, by Country, 2016 and 2025
Figure 38: Middle East & Africa Offshore AUV & ROV Market Value Share Analysis, by Propulsion, 2016 and 2025
Figure 39: Middle East & Africa Offshore AUV & ROV Market Value Share Analysis, by Product, 2016 and 2025
Figure 40: Middle East & Africa Offshore AUV & ROV Market Value Share Analysis, by Application, 2016 and 2025
Figure 41: Middle East & Africa Offshore AUV & ROV Market Value Share Analysis, by Country, 2016 and 2025
Figure 42: Latin America Offshore AUV & ROV Market Value Share Analysis, by Propulsion, 2016 and 2025
Figure 43: Latin America Offshore AUV & ROV Market Value Share Analysis, by Product, 2016 and 2025
Figure 44: Latin America Offshore AUV & ROV Market Value Share Analysis, by Application, 2016 and 2025
Figure 45: Latin America Offshore AUV & ROV Market Value Share Analysis, by Country, 2016 and 2025
Figure 46: Global Offshore AUV & ROV Market Share Analysis, by Company (2016)
Copyright © Transparency Market Research, Inc. All Rights reserved
Trust Online

Offshore AUV & ROV Market
