Moringa supplements played a vital role in the time of the global coronavirus pandemic to boost immunity. Manufacturers from the pharmaceutical industry are targeting the production of moringa supplements due to their health benefits. With abundant source of iron and other necessary nutrients, these supplements are increasingly becoming popular among the consumers during the pandemic. Available in different forms such as powder, oil, and capsules, these products are helpful for patients suffering from heart issues, blood pressure, and diabetes. Stakeholders in the moringa supplements market are effortlessly contributing to set their businesses to keep the economies running amid the ongoing pandemic by introducing immunity-booster moringa supplements. Moringa supplements market players are taking efforts to increase the production of moringa supplements by investing in cultivation activities in new regions.
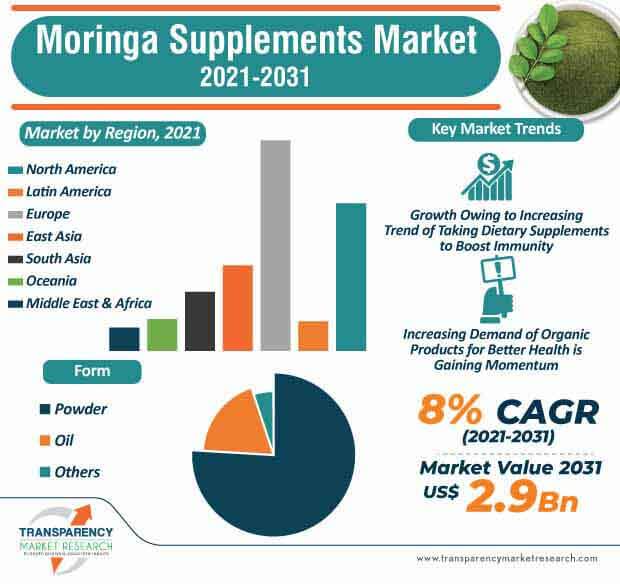
The moringa supplements market is expected to rise at a CAGR of 8% from 2021 to 2031. The moringa supplements market is estimated to cross the valuation of US$ 2.9 Bn by 2031. Anemia is a serious problem caused due to the deficiency of iron in the body. Increasing incidences of infectious diseases and dizziness in children and women are driving the demand for iron supplements, which, in turn, drives the global moringa market growth. Moringa supplements are plant-based, and hence gaining popularity due to acceptance of veganism across the globe.
Companies in the moringa supplements market are expected to join forces with researchers to introduce various products in order to cater demands from healthcare and pharmaceutical industries at a global level. Moringa leaves and seed are found to be effective in reducing tiredness, fatigue, and controls blood sugar levels. People are consciously taking efforts to stay fit and healthy during the pandemic. Increasing government expenditure on healthcare supports the rising popularity and awareness of moringa products across the world.
In order to boost energy levels, consumers are opting for dietary supplements these days. The increasing popularity of organic and plant-based products is gaining momentum. Side effects caused due to excessive consumption of these supplements can hinder the global market growth. These products are having numerous health benefits, if consumed in moderate amount. Organic certification is required for exporting moringa products to other countries. Companies should focus on using good quality equipment and infrastructure facilities for the production of moringa products. Governments should focus on promotional activities in underdeveloped countries to spread awareness about moringa supplements.
North America accounts for the largest market share of the global moringa supplements market, due to increasing trend of taking dietary supplements, hectic lifestyles, and acceptance of plant-based products. Increasing geriatric population, rising prevalence of chronic diseases, and complications due to iron deficiency contribute to the market expansion in Asia Pacific. The rising demand and acceptance of moringa supplements due to their health benefits boost the market growth.
Increasing sales of moringa products in coronavirus pandemic help product manufacturers to compete with top market players. Factors such as growing offline and online channels, development of the eCommerce industry, and rapidly expanding online businesses boost the sales of moringa supplements. Companies in the moringa supplements market are developing innovative products to fulfill demands of consumers. Manufacturers are increasing the availability for an innovative range of moringa products in a variety of different forms. Various ongoing research activities in developing plant-based products help grow businesses exponentially. Manufacturers in the moringa supplements market are exploring opportunities in product quality and nutritional advantages.
Analysts’ Viewpoint
Being one of the rich sources of iron and other power-packed vitamins and minerals, there is an increasing trend of including moringa supplements into diet. Product manufacturers are taking efforts to increase production of moringa-based products. There is a rising demand for such products after the coronavirus outbreak. Moringa powder and oil have promising potentials for boosting immunity and fight against nutritional deficiency of necessary compounds. However, market players should increase research in plant-based products to improve product quality. Moringa supplements have anti-inflammatory properties due to which, these supplements are beneficial in healing various diseases.
|
Attribute |
Detail |
|
Market Size Value in 2021 (Base Year) |
US$ 1.3 Bn |
|
Market Forecast Value in 2031 |
US$ 2.9 Bn |
|
Growth Rate (CAGR) |
8% |
|
Forecast Period |
2021-2031 |
|
Quantitative Units |
US$ Mn for Value & Tons for Volume |
|
Market Analysis |
It includes cross segment analysis at global as well as regional level. Furthermore, qualitative analysis includes drivers, restraints, opportunities, key trends, Porters Five Forces analysis, supply chain analysis, parent industry overview, etc. |
|
Competition Landscape |
|
|
Format |
Electronic (PDF) + Excel |
|
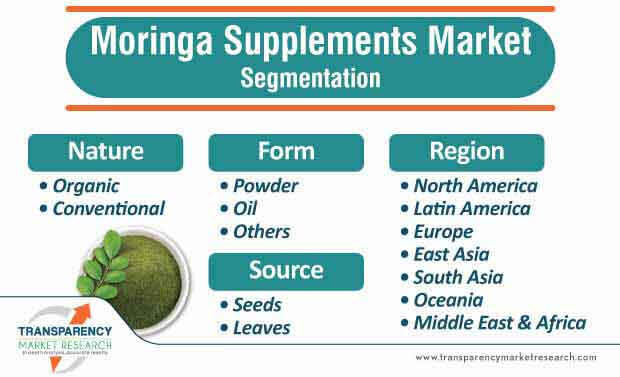
Market Segmentation |
|
|
Regions Covered |
|
|
Countries Covered |
|
|
Companies Profiled |
|
|
Customization Scope |
Available upon Request |
|
Pricing |
Available upon Request |
In 2021, Moringa Supplements Market was valued at US$ 459.8 Mn
Moringa Supplements Market is expected to Reach US$ 2.9 Bn In 2031
Moringa Supplements Market is estimated to rise at a CAGR of 7% during forecast period
Increasing incidences of infectious diseases and dizziness in children and women are driving the demand for iron supplements is expected to drive the Moringa Supplements Market
North America is more attractive for vendors in the Moringa Supplements Market
1. Executive Summary
1.1. Global Market Outlook
1.2. Demand Side Trends
1.3. Supply Side Trends
1.4. Analysis and Recommendations
2. Market Overview
2.1. Market Coverage / Taxonomy
2.2. Market Definition / Scope / Limitations
3. Key Market Trends
3.1. Key Trends Impacting the Market
3.2. Product Innovation / Development Trends
4. Key Success Factors
4.1. Product Adoption / Usage Analysis
4.2. Product USPs / Features
4.3. Strategic Promotional Strategies
5. Global Moringa Supplements Market Demand Analysis 2016–2020 and Forecast, 2021–2031
5.1. Historical Market Volume (Tons) Analysis, 2016–2020
5.2. Current and Future Market Volume (Tons) Projections, 2021–2031
6. Global Moringa Supplements Market - Pricing Analysis
6.1. Pricing Analysis
6.2. Global Average Pricing Analysis Benchmark
7. Global Moringa Supplements Market Demand (in Value or Size in US$ Mn) Analysis 2016–2020 and Forecast, 2021–2031
7.1. Historical Market Value (US$ Mn) Analysis, 2016–2020
7.2. Current and Future Market Value (US$ Mn) Projections, 2021–2031
7.2.1. Y-o-Y Growth Trend Analysis
7.2.2. Absolute $ Opportunity Analysis
8. Market Background
8.1. Macro-Economic Factors
8.1.1. Global GDP Growth Outlook
8.1.2. Global Industry Value Added
8.1.3. Global Food Security Index Outlook
8.1.4. Global Rank – Ease of Doing Business
8.1.5. Global Rank – Trading Across Borders
8.2. Impact of COVID-19 on Nutraceutical Industry
8.3. COVID-19 Risk Assessment/Impact
8.4. Impact of COVID-19 on Food & Beverage Industry
8.5. Impact of COVID-19 on Retail Sector
8.6. Global Food & Beverage Industry Outlook
8.7. Global Consumer Products Outlook
8.8. Plant-based Food Industry – Driving Forces The Future of Food
8.9. Production Overview of Moringa
8.10. Global Organic Agriculture Land Outlook
8.11. Value Added Products From Moringa
8.12. Industry Value and Supply Chain Analysis
8.12.1. Profit Margin Analysis at each point of sales
8.12.1.1. Moringa Supplements Processors/Producers
8.12.1.2. Distributors/Suppliers/Wholesalers
8.12.1.3. Traders/Retailers
8.12.2. End-Users
8.13. Key Regulations
8.14. Market Dynamics
8.14.1. Drivers
8.14.2. Restraints
8.14.3. Opportunity Analysis
8.15. Forecast Factors - Relevance & Impact Analysis
9. Global Moringa Supplements Market Analysis 2016–2020 and Forecast 2021–2031, By Nature
9.1. Introduction / Key Findings
9.2. Historical Market Size (US$ Mn) and Volume Analysis By Nature, 2016–2020
9.3. Current and Future Market Size (US$ Mn) and Volume Analysis and Forecast By Ingredient (Type), 2021–2031
9.3.1. Organic
9.3.2. Conventional
9.4. Market Attractiveness Analysis By Nature
10. Global Moringa Supplements Market Analysis 2016–2020 and Forecast 2021–2031, By Source
10.1. Introduction / Key Findings
10.2. Historical Market Size (US$ Mn) and Volume Analysis By Ingredient Source, 2016–2020
10.3. Current and Future Market Size (US$ Mn) and Volume Analysis and Forecast By Ingredient Source, 2021–2031
10.3.1. Seed
10.3.2. Leaves
10.4. Market Attractiveness Analysis By Source
11. Global Moringa Supplements Market Analysis 2016–2020 and Forecast 2021–2031, By Form
11.1. Introduction / Key Findings
11.2. Historical Market Size (US$ Mn) and Volume Analysis By Form, 2016–2020
11.3. Current and Future Market Size (US$ Mn) and Volume Analysis and Forecast By Form, 2021–2031
11.3.1. Powder
11.3.2. Oil
11.3.3. Others
11.4. Market Attractiveness Analysis By Form
12. Global Moringa Supplements Market Analysis 2016–2020 and Forecast 2021–2031, By Sales Channel
12.1. Introduction / Key Findings
12.2. Historical Market Size (US$ Mn) and Volume Analysis By Sales Channel, 2016–2020
12.3. Current and Future Market Size (US$ Mn) and Volume Analysis and Forecast By Sales Channel, 2021–2031
12.3.1. Hypermarkets/Supermarkets
12.3.2. Specialty Stores
12.3.3. Convenience Stores
12.3.4. Online Retail
12.4. Market Attractiveness Analysis By Sales Channel
13. Global Moringa Supplements Market Analysis 2016–2020 and Forecast 2021–2031, By Region
13.1. Introduction
13.2. Historical Market Size (US$ Mn) and Volume Analysis By Region, 2016–2020
13.3. Current Market Size (US$ Mn) and Volume Analysis and Forecast By Region, 2021–2031
13.3.1. North America
13.3.2. Latin America
13.3.3. Europe
13.3.4. South Asia
13.3.5. East Asia
13.3.6. Oceania
13.3.7. Middle East and Africa (MEA)
13.4. Market Attractiveness Analysis By Region
14. North America Moringa Supplements Market Analysis 2016–2020 and Forecast 2021–2031
14.1. Introduction
14.2. Historical Market Size (US$ Mn) and Volume Trend Analysis By Market Taxonomy, 2016–2020
14.3. Market Size (US$ Mn) and Volume Forecast By Market Taxonomy, 2021–2031
14.3.1. By Country
14.3.1.1. U.S.
14.3.1.2. Canada
14.3.2. By Nature
14.3.3. By Source
14.3.4. By Form
14.3.5. By Sales Channel
14.4. Market Attractiveness Analysis
14.4.1. By Nature
14.4.2. By Source
14.4.3. By Form
14.4.4. By Sales Channel
14.5. Drivers and Restraints - Impact Analysis
15. Latin America Moringa Supplements Market Analysis 2016–2020 and Forecast 2021–2031
15.1. Introduction
15.2. Historical Market Size (US$ Mn) and Volume Trend Analysis By Market Taxonomy, 2016–2020
15.3. Market Size (US$ Mn) and Volume Forecast By Market Taxonomy, 2021–2031
15.3.1. By Country
15.3.1.1. Brazil
15.3.1.2. Mexico
15.3.1.3. Rest of Latin America
15.3.2. By Nature
15.3.3. By Source
15.3.4. By Form
15.3.5. By Sales Channel
15.4. Market Attractiveness Analysis
15.4.1. By Nature
15.4.2. By Source
15.4.3. By Form
15.4.4. By Sales Channel
15.5. Drivers and Restraints - Impact Analysis
16. Europe Moringa Supplements Market Analysis 2016–2020 and Forecast 2021–2031
16.1. Introduction
16.2. Historical Market Size (US$ Mn) and Volume Trend Analysis By Market Taxonomy, 2016–2020
16.3. Market Size (US$ Mn) and Volume Forecast By Market Taxonomy, 2021–2031
16.3.1. By Country
16.3.1.1. Germany
16.3.1.2. Italy
16.3.1.3. France
16.3.1.4. U.K.
16.3.1.5. Spain
16.3.1.6. BENELUX
16.3.1.7. Nordic
16.3.1.8. Poland
16.3.1.9. Russia
16.3.1.10. Rest of Europe
16.3.2. By Nature
16.3.3. By Source
16.3.4. By Form
16.3.5. By Sales Channel
16.4. Market Attractiveness Analysis
16.4.1. By Nature
16.4.2. By Source
16.4.3. By Form
16.4.4. By Sales Channel
16.5. Drivers and Restraints - Impact Analysis
17. South Asia Moringa Supplements Market Analysis 2016–2020 and Forecast 2021–2031
17.1. Introduction
17.2. Historical Market Size (US$ Mn) and Volume Trend Analysis By Market Taxonomy, 2016–2020
17.3. Market Size (US$ Mn) and Volume Forecast By Market Taxonomy, 2021–2031
17.3.1. By Country
17.3.1.1. India
17.3.1.2. Thailand
17.3.1.3. Indonesia
17.3.1.4. Malaysia
17.3.1.5. Rest of South Asia
17.3.2. By Nature
17.3.3. By Source
17.3.4. By Form
17.3.5. By Sales Channel
17.4. Market Attractiveness Analysis
17.4.1. By Nature
17.4.2. By Source
17.4.3. By Form
17.4.4. By Sales Channel
17.5. Drivers and Restraints - Impact Analysis
18. East Asia Moringa Supplements Market Analysis 2016–2020 and Forecast 2021–2031
18.1. Introduction
18.2. Historical Market Size (US$ Mn) and Volume Trend Analysis By Market Taxonomy, 2016–2020
18.3. Market Size (US$ Mn) and Volume Forecast By Market Taxonomy, 2021–2031
18.3.1. By Country
18.3.1.1. China
18.3.1.2. Japan
18.3.1.3. South Korea
18.3.2. By Nature
18.3.3. By Source
18.3.4. By Form
18.3.5. By End Use
18.3.6. By Sales Channel
18.4. Market Attractiveness Analysis
18.4.1. By Nature
18.4.2. By Source
18.4.3. By Form
18.4.4. By Sales Channel
18.5. Drivers and Restraints - Impact Analysis
19. Oceania Moringa Supplements Market Analysis 2016–2020 and Forecast 2021–2031
19.1. Introduction
19.2. Historical Market Size (US$ Mn) and Volume Trend Analysis By Market Taxonomy, 2016–2020
19.3. Market Size (US$ Mn) and Volume Forecast By Market Taxonomy, 2021–2031
19.3.1. By Country
19.3.1.1. Australia
19.3.1.2. New Zealand
19.3.2. By Nature
19.3.3. By Source
19.3.4. By Form
19.3.5. By Sales Channel
19.4. Market Attractiveness Analysis
19.4.1. By Nature
19.4.2. By Source
19.4.3. By Form
19.4.4. By Sales Channel
19.5. Drivers and Restraints - Impact Analysis
20. Middle East and Africa Moringa Supplements Market Analysis 2016–2020 and Forecast 2021–2031
20.1. Introduction
20.2. Historical Market Size (US$ Mn) and Volume Trend Analysis By Market Taxonomy, 2016–2020
20.3. Market Size (US$ Mn) and Volume Forecast By Market Taxonomy, 2021–2031
20.3.1. By Country
20.3.1.1. GCC Countries
20.3.1.2. Turkey
20.3.1.3. South Africa
20.3.1.4. Rest of Middle East and Africa
20.3.2. By Nature
20.3.3. By Source
20.3.4. By Form
20.3.5. By Sales Channel
20.4. Market Attractiveness Analysis
20.4.1. By Nature
20.4.2. By Source
20.4.3. By Form
20.4.4. By Sales Channel
20.5. Drivers and Restraints - Impact Analysis
21. Market Structure Analysis
21.1. Market Analysis by Tier of Companies
21.2. Market Concentration
21.3. Market Presence Analysis
22. Competition Analysis
22.1. Competition Dashboard
22.2. Competition Benchmarking
22.3. Competition Deep Dive
22.3.1. Bio-Botanica Inc.
22.3.1.1. Overview
22.3.1.2. Product Portfolio
22.3.1.3. Key Developments/Takeaways
22.3.1.4. Strategy Overview
22.3.2. Green Era Foods & Nutraceutics
22.3.2.1. Overview
22.3.2.2. Product Portfolio
22.3.2.3. Key Developments/Takeaways
22.3.2.4. Strategy Overview
22.3.3. Growello Private Limited
22.3.3.1. Overview
22.3.3.2. Product Portfolio
22.3.3.3. Key Developments/Takeaways
22.3.3.4. Strategy Overview
22.3.4. MotherTree Nutra Pvt. Ltd.
22.3.4.1. Overview
22.3.4.2. Product Portfolio
22.3.4.3. Key Developments/Takeaways
22.3.4.4. Strategy Overview
22.3.5. Aayuritz Phytonutrients Pvt. Ltd.
22.3.5.1. Overview
22.3.5.2. Product Portfolio
22.3.5.3. Key Developments/Takeaways
22.3.5.4. Strategy Overview
22.3.6. K V Natural Ingredients Pvt. Ltd.
22.3.6.1. Overview
22.3.6.2. Product Portfolio
22.3.6.3. Key Developments/Takeaways
22.3.6.4. Strategy Overview
22.3.7. Ancient Greenfields Pvt. Ltd.
22.3.7.1. Overview
22.3.7.2. Product Portfolio
22.3.7.3. Key Developments/Takeaways
22.3.7.4. Strategy Overview
22.3.8. TAIYO GmbH
22.3.8.1. Overview
22.3.8.2. Product Portfolio
22.3.8.3. Key Developments/Takeaways
22.3.8.4. Strategy Overview
22.3.9. Darsh Biotech Private Limited
22.3.9.1. Overview
22.3.9.2. Product Portfolio
22.3.9.3. Key Developments/Takeaways
22.3.9.4. Strategy Overview
22.3.10. Organic Spirulina
22.3.10.1. Overview
22.3.10.2. Product Portfolio
22.3.10.3. Key Developments/Takeaways
22.3.10.4. Strategy Overview
22.3.11. Herbal hills
22.3.11.1. Overview
22.3.11.2. Product Portfolio
22.3.11.3. Key Developments/Takeaways
22.3.11.4. Strategy Overview
22.3.12. The Himalaya Drug Company
22.3.12.1. Overview
22.3.12.2. Product Portfolio
22.3.12.3. Key Developments/Takeaways
22.3.12.4. Strategy Overview
22.3.13. DRP Herbal
22.3.13.1. Overview
22.3.13.2. Product Portfolio
22.3.13.3. Key Developments/Takeaways
22.3.13.4. Strategy Overview
22.3.14. Angel Starch and Food Pvt. Ltd.
22.3.14.1. Overview
22.3.14.2. Product Portfolio
22.3.14.3. Key Developments/Takeaways
22.3.14.4. Strategy Overview
22.3.15. HNCO Organics
22.3.15.1. Overview
22.3.15.2. Product Portfolio
22.3.15.3. Key Developments/Takeaways
22.3.15.4. Strategy Overview
22.3.16. Organic Dehydrated Foods Pvt. Ltd.
22.3.16.1. Overview
22.3.16.2. Product Portfolio
22.3.16.3. Key Developments/Takeaways
22.3.16.4. Strategy Overview
22.3.17. Grenera Nutrients Pvt Ltd.
22.3.17.1. Overview
22.3.17.2. Product Portfolio
22.3.17.3. Key Developments/Takeaways
22.3.17.4. Strategy Overview
22.3.18. Moringa Agro
22.3.18.1. Overview
22.3.18.2. Product Portfolio
22.3.18.3. Key Developments/Takeaways
22.3.18.4. Strategy Overview
22.3.19. Dominate Industries
22.3.19.1. Overview
22.3.19.2. Product Portfolio
22.3.19.3. Key Developments/Takeaways
22.3.19.4. Strategy Overview
22.3.20. Connolis
22.3.20.1. Overview
22.3.20.2. Product Portfolio
22.3.20.3. Key Developments/Takeaways
22.3.20.4. Strategy Overview
22.3.21. Others (Available on Request)
23. Assumptions and Acronyms Used
24. Research Methodology
List of Tables:
Table 01: Global Moringa Supplements Market Value (US$ Mn) Analysis and Forecast by Nature, 2016-2031
Table 02: Global Moringa Supplements Market Volume (Tons) Analysis and Forecast by Nature, 2016-2031
Table 03: Global Moringa Supplements Market Value (US$ Mn) Analysis and Forecast by Form, 2016-2031
Table 04: Global Moringa Supplements Market Volume (Tons) Analysis and Forecast by Form, 2016-2031
Table 05: Global Moringa Supplements Market Value (US$ Mn) Analysis and Forecast by Source, 2016-2031
Table 06: Global Moringa Supplements Market Volume (Tons) Analysis and Forecast by Source, 2016-2031
Table 07: Global Moringa Supplements Market Value (US$ Mn) Analysis and Forecast by Sales Channel, 2016-2031
Table 08: Global Moringa Supplements Market Volume (Tons) Analysis and Forecast by Sales Channel, 2016-2031
Table 09: Global Moringa Supplements Market Value (US$ Mn) Analysis and Forecast by Region, 2016-2031
Table 10: Global Moringa Supplements Market Volume (Tons) Analysis and Forecast by Region, 2016-2031
Table 11: North America Moringa Supplements Market Value (US$ Mn) Analysis and Forecast by Nature, 2016-2031
Table 12: North America Moringa Supplements Market Volume (Tons) Analysis and Forecast by Nature, 2016-2031
Table 13: North America Moringa Supplements Market Value (US$ Mn) Analysis and Forecast by Form, 2016-2031
Table 14: North America Moringa Supplements Market Volume (Tons) Analysis and Forecast by Form, 2016-2031
Table 15: North America Moringa Supplements Market Value (US$ Mn) Analysis and Forecast by Source, 2016-2031
Table 16: North America Moringa Supplements Market Volume (Tons) Analysis and Forecast by Source, 2016-2031
Table 17: North America Moringa Supplements Market Value (US$ Mn) Analysis and Forecast by Sales Channel, 2015–2031
Table 18: North America Moringa Supplements Market Volume (Tons) Analysis and Forecast by Sales Channel, 2015–2031
Table 19: North America Moringa Supplements Market Value (US$ Mn) Analysis and Forecast by Country, 2015–2031
Table 20: North America Moringa Supplements Market Volume (Tons) Analysis and Forecast by Country, 2015–2031
Table 21: Latin America Moringa Supplements Market Value (US$ Mn) Analysis and Forecast by Nature, 2016-2031
Table 22: Latin America Moringa Supplements Market Volume (Tons) Analysis and Forecast by Nature, 2016-2031
Table 23: Latin America Moringa Supplements Market Value (US$ Mn) Analysis and Forecast by Form, 2016-2031
Table 24: Latin America Moringa Supplements Market Volume (Tons) Analysis and Forecast by Form, 2016-2031
Table 25: Latin America Moringa Supplements Market Value (US$ Mn) Analysis and Forecast by Source, 2016-2031
Table 26: Latin America Moringa Supplements Market Volume (Tons) Analysis and Forecast by Source, 2016-2031
Table 27: Latin America Moringa Supplements Market Value (US$ Mn) Analysis and Forecast by Sales Channel, 2015–2031
Table 28: Latin America Moringa Supplements Market Volume (Tons) Analysis and Forecast by Sales Channel, 2015–2031
Table 29: Latin America Moringa Supplements Market Value (US$ Mn) Analysis and Forecast by Country, 2015–2031
Table 30: Latin America Moringa Supplements Market Volume (Tons) Analysis and Forecast by Country, 2015–2031
Table 31: Europe Moringa Supplements Market Value (US$ Mn) Analysis and Forecast by Nature, 2016-2031
Table 32: Europe Moringa Supplements Market Volume (Tons) Analysis and Forecast by Nature, 2016-2031
Table 33: Europe Moringa Supplements Market Value (US$ Mn) Analysis and Forecast by Form, 2016-2031
Table 34: Europe Moringa Supplements Market Volume (Tons) Analysis and Forecast by Form, 2016-2031
Table 35: Europe Moringa Supplements Market Value (US$ Mn) Analysis and Forecast by Source, 2016-2031
Table 36: Europe Moringa Supplements Market Volume (Tons) Analysis and Forecast by Source, 2016-2031
Table 37: Europe Moringa Supplements Market Value (US$ Mn) Analysis and Forecast by Sales Channel, 2015–2031
Table 38: Europe Moringa Supplements Market Volume (Tons) Analysis and Forecast by Sales Channel, 2015–2031
Table 39: Europe Moringa Supplements Market Value (US$ Mn) Analysis and Forecast by Country, 2015–2031
Table 40: Europe Moringa Supplements Market Volume (Tons) Analysis and Forecast by Country, 2015–2031
Table 41: South Asia Moringa Supplements Market Value (US$ Mn) Analysis and Forecast by Nature, 2016-2031
Table 42: South Asia Moringa Supplements Market Volume (Tons) Analysis and Forecast by Nature, 2016-2031
Table 43: South Asia Moringa Supplements Market Value (US$ Mn) Analysis and Forecast by Form, 2016-2031
Table 44: South Asia Moringa Supplements Market Volume (Tons) Analysis and Forecast by Form, 2016-2031
Table 45: South Asia Moringa Supplements Market Value (US$ Mn) Analysis and Forecast by Source, 2016-2031
Table 46: South Asia Moringa Supplements Market Volume (Tons) Analysis and Forecast by Source, 2016-2031
Table 47: South Asia Moringa Supplements Market Value (US$ Mn) Analysis and Forecast by Sales Channel, 2015–2031
Table 48: South Asia Moringa Supplements Market Volume (Tons) Analysis and Forecast by Sales Channel, 2015–2031
Table 49: South Asia Moringa Supplements Market Value (US$ Mn) Analysis and Forecast by Country, 2015–2031
Table 50: South Asia Moringa Supplements Market Volume (Tons) Analysis and Forecast by Country, 2015–2031
Table 51: East Asia Moringa Supplements Market Value (US$ Mn) Analysis and Forecast by Nature, 2016-2031
Table 52: East Asia Moringa Supplements Market Volume (Tons) Analysis and Forecast by Nature, 2016-2031
Table 53: East Asia Moringa Supplements Market Value (US$ Mn) Analysis and Forecast by Form, 2016-2031
Table 54: East Asia Moringa Supplements Market Volume (Tons) Analysis and Forecast by Form, 2016-2031
Table 55: East Asia Moringa Supplements Market Value (US$ Mn) Analysis and Forecast by Source, 2016-2031
Table 56: East Asia Moringa Supplements Market Volume (Tons) Analysis and Forecast by Source, 2016-2031
Table 57: East Asia Moringa Supplements Market Value (US$ Mn) Analysis and Forecast by Sales Channel, 2015–2031
Table 58: East Asia Moringa Supplements Market Volume (Tons) Analysis and Forecast by Sales Channel, 2015–2031
Table 59: East Asia Moringa Supplements Market Value (US$ Mn) Analysis and Forecast by Country, 2015–2031
Table 60: East Asia Moringa Supplements Market Volume (Tons) Analysis and Forecast by Country, 2015–2031
Table 61: Oceania Moringa Supplements Market Value (US$ Mn) Analysis and Forecast by Nature, 2016-2031
Table 62: Oceania Moringa Supplements Market Volume (Tons) Analysis and Forecast by Nature, 2016-2031
Table 63: Oceania Moringa Supplements Market Value (US$ Mn) Analysis and Forecast by Form, 2016-2031
Table 64: Oceania Moringa Supplements Market Volume (Tons) Analysis and Forecast by Form, 2016-2031
Table 65: Oceania Moringa Supplements Market Value (US$ Mn) Analysis and Forecast by Source, 2016-2031
Table 66: Oceania Moringa Supplements Market Volume (Tons) Analysis and Forecast by Source, 2016-2031
Table 67: Oceania Moringa Supplements Market Value (US$ Mn) Analysis and Forecast by Sales Channel, 2015–2031
Table 68: Oceania Moringa Supplements Market Volume (Tons) Analysis and Forecast by Sales Channel, 2015–2031
Table 69: Oceania Moringa Supplements Market Value (US$ Mn) Analysis and Forecast by Country, 2015–2031
Table 70: Oceania Moringa Supplements Market Volume (Tons) Analysis and Forecast by Country, 2015–2031
Table 71: Middle East & Africa Moringa Supplements Market Value (US$ Mn) Analysis and Forecast by Nature, 2016-2031
Table 72: Middle East & Africa Moringa Supplements Market Volume (Tons) Analysis and Forecast by Nature, 2016-2031
Table 73: Middle East & Africa Moringa Supplements Market Value (US$ Mn) Analysis and Forecast by Form, 2016-2031
Table 74: Middle East & Africa Moringa Supplements Market Volume (Tons) Analysis and Forecast by Form, 2016-2031
Table 75: Middle East & Africa Moringa Supplements Market Value (US$ Mn) Analysis and Forecast by Source, 2016-2031
Table 76: Middle East & Africa Moringa Supplements Market Volume (Tons) Analysis and Forecast by Source, 2016-2031
Table 77: Middle East & Africa Moringa Supplements Market Value (US$ Mn) Analysis and Forecast by Sales Channel, 2015–2031
Table 78: Middle East & Africa Moringa Supplements Market Volume (Tons) Analysis and Forecast by Sales Channel, 2015–2031
Table 79: Middle East & Africa Moringa Supplements Market Value (US$ Mn) Analysis and Forecast by Country, 2015–2031
Table 80: Middle East & Africa Moringa Supplements Market Volume (Tons) Analysis and Forecast by Country, 2015–2031
List of Figures:
Figure 01: Global Moringa Supplements Market Value (US$ Mn) Forecast, 2021 –2031
Figure 02: Global Moringa Supplements Market Volume (Tons) Forecast, 2021 –2031
Figure 03: Global Moringa Supplements Market Value Share Analysis by Nature, 2021 E
Figure 04: Global Moringa Supplements Market Y-o-Y Growth Rate by Nature, 2021 -2031
Figure 05: Global Moringa Supplements Market Value (US$ Mn) Analysis & Forecast by Nature, 2021 –2031
Figure 06: Global Moringa Supplements Market Volume (Tons) Analysis & Forecast by Nature, 2021 –2031
Figure 07: Global Moringa Supplements Market Value Share Analysis by Form, 2021 E
Figure 08: Global Moringa Supplements Market Y-o-Y Growth Rate by Form, 2021 -2031
Figure 09: Global Moringa Supplements Market Value (US$ Mn) Analysis & Forecast by Form, 2021 –2031
Figure 10: Global Moringa Supplements Market Volume (Tons) Analysis & Forecast by Form, 2021 –2031
Figure 11: Global Moringa Supplements Market Value Share Analysis by Source, 2021 E
Figure 12: Global Moringa Supplements Market Y-o-Y Growth Rate by Source, 2021 -2031
Figure 13: Global Moringa Supplements Market Value (US$ Mn) Analysis & Forecast by Source, 2021 –2031
Figure 14: Global Moringa Supplements Market Volume (Tons) Analysis & Forecast by Source, 2021 –2031
Figure 15: Global Moringa Supplements Market Value Share Analysis by Sales Channel, 2021 E
Figure 16: Global Moringa Supplements Market Y-o-Y Growth Rate by Sales Channel, 2021 -2031
Figure 17: Global Moringa Supplements Market Value (US$ Mn) Analysis & Forecast by Sales Channel, 2021 –2031
Figure 18: Global Moringa Supplements Market Volume (Tons) Analysis & Forecast by Sales Channel, 2021 –2031
Figure 19: Global Moringa Supplements Market Value Share Analysis by Region, 2021 E
Figure 20: Global Moringa Supplements Market Y-o-Y Growth Rate by Region, 2021 -2031
Figure 21: Global Moringa Supplements Market Value (US$ Mn) Analysis & Forecast by Region, 2021 –2031
Figure 22: Global Moringa Supplements Market Volume (Tons) Analysis & Forecast by Region, 2021 –2031
Figure 23: Global Moringa Supplements Market Attractiveness Analysis by Region, 2021 -2031
Figure 24: Global Moringa Supplements Market Attractiveness Analysis by Form, 2021 -2031
Figure 25: Global Moringa Supplements Market Attractiveness Analysis by Nature, 2021-2031
Figure 26: Global Moringa Supplements Market Attractiveness Analysis by Sales Channel, 2021 -2031
Figure 27: Global Moringa Supplements Market Attractiveness Analysis by Source, 2021-2031
Figure 28: North America Moringa Supplements Market Value (US$ Mn) Analysis & Forecast by Nature, 2021 –2031
Figure 29: North America Moringa Supplements Market Volume (Tons) Analysis & Forecast by Nature, 2021 –2031
Figure 30: North America Moringa Supplements Market Value (US$ Mn) Analysis & Forecast by Form, 2021 –2031
Figure 31: North America Moringa Supplements Market Volume (Tons) Analysis & Forecast by Form, 2021 –2031
Figure 32: North America Moringa Supplements Market Value (US$ Mn) Analysis & Forecast by Source, 2021 –2031
Figure 33: North America Moringa Supplements Market Volume (Tons) Analysis & Forecast by Source, 2021 –2031
Figure 34: North America Moringa Supplements Market Value (US$ Mn) Analysis & Forecast by Sales Channel, 2021 –2031
Figure 35: North America Moringa Supplements Market Volume (Tons) Analysis & Forecast by Sales Channel, 2021 –2031
Figure 36: North America Moringa Supplements Market Value (US$ Mn) Analysis & Forecast by Country, 2021 –2031
Figure 37: North America Moringa Supplements Market Volume (Tons) Analysis & Forecast by Country, 2021 –2031
Figure 38: North America Moringa Supplements Market Attractiveness Analysis by Region, 2021 -2031
Figure 39: North America Moringa Supplements Market Attractiveness Analysis by Form, 2021 -2031
Figure 40: North America Moringa Supplements Market Attractiveness Analysis by Nature, 2021-2031
Figure 41: North America Moringa Supplements Market Attractiveness Analysis by Sales Channel, 2021 -2031
Figure 42: North America Moringa Supplements Market Attractiveness Analysis by Source, 2021-2031
Figure 43: Latin America Moringa Supplements Market Value (US$ Mn) Analysis & Forecast by Nature, 2021 –2031
Figure 44: Latin America Moringa Supplements Market Volume (Tons) Analysis & Forecast by Nature, 2021 –2031
Figure 45: Latin America Moringa Supplements Market Value (US$ Mn) Analysis & Forecast by Form, 2021 –2031
Figure 46: Latin America Moringa Supplements Market Volume (Tons) Analysis & Forecast by Form, 2021 –2031
Figure 47: Latin America Moringa Supplements Market Value (US$ Mn) Analysis & Forecast by Source, 2021 –2031
Figure 48: Latin America Moringa Supplements Market Volume (Tons) Analysis & Forecast by Source, 2021 –2031
Figure 49: Latin America Moringa Supplements Market Value (US$ Mn) Analysis & Forecast by Sales Channel, 2021 –2031
Figure 50: Latin America Moringa Supplements Market Volume (Tons) Analysis & Forecast by Sales Channel, 2021 –2031
Figure 51: Latin America Moringa Supplements Market Value (US$ Mn) Analysis & Forecast by Country, 2021 –2031
Figure 52: Latin America Moringa Supplements Market Volume (Tons) Analysis & Forecast by Country, 2021 –2031
Figure 53: Latin America Moringa Supplements Market Attractiveness Analysis by Region, 2021 -2031
Figure 54: Latin America Moringa Supplements Market Attractiveness Analysis by Form, 2021 -2031
Figure 55: Latin America Moringa Supplements Market Attractiveness Analysis by Nature, 2021-2031
Figure 56: Latin America Moringa Supplements Market Attractiveness Analysis by Sales Channel, 2021 -2031
Figure 57: Latin America Moringa Supplements Market Attractiveness Analysis by Source, 2021-2031
Figure 58: Europe Moringa Supplements Market Value (US$ Mn) Analysis & Forecast by Nature, 2021 –2031
Figure 59: Europe Moringa Supplements Market Volume (Tons) Analysis & Forecast by Nature, 2021 –2031
Figure 60: Europe Moringa Supplements Market Value (US$ Mn) Analysis & Forecast by Form, 2021 –2031
Figure 61: Europe Moringa Supplements Market Volume (Tons) Analysis & Forecast by Form, 2021 –2031
Figure 62: Europe Moringa Supplements Market Value (US$ Mn) Analysis & Forecast by Source, 2021 –2031
Figure 63: Europe Moringa Supplements Market Volume (Tons) Analysis & Forecast by Source, 2021 –2031
Figure 64: Europe Moringa Supplements Market Value (US$ Mn) Analysis & Forecast by Sales Channel, 2021 –2031
Figure 65: Europe Moringa Supplements Market Volume (Tons) Analysis & Forecast by Sales Channel, 2021 –2031
Figure 66: Europe Moringa Supplements Market Value (US$ Mn) Analysis & Forecast by Country, 2021 –2031
Figure 67: Europe Moringa Supplements Market Volume (Tons) Analysis & Forecast by Country, 2021 –2031
Figure 68: Europe Moringa Supplements Market Attractiveness Analysis by Region, 2021 -2031
Figure 69: Europe Moringa Supplements Market Attractiveness Analysis by Form, 2021 -2031
Figure 70: Europe Moringa Supplements Market Attractiveness Analysis by Nature, 2021-2031
Figure 71: Europe Moringa Supplements Market Attractiveness Analysis by Sales Channel, 2021 -2031
Figure 72: Europe Moringa Supplements Market Attractiveness Analysis by Source, 2021-2031
Figure 73: South Asia Moringa Supplements Market Value (US$ Mn) Analysis & Forecast by Nature, 2021 –2031
Figure 74: South Asia Moringa Supplements Market Volume (Tons) Analysis & Forecast by Nature, 2021 –2031
Figure 75: South Asia Moringa Supplements Market Value (US$ Mn) Analysis & Forecast by Form, 2021 –2031
Figure 76: South Asia Moringa Supplements Market Volume (Tons) Analysis & Forecast by Form, 2021 –2031
Figure 77: South Asia Moringa Supplements Market Value (US$ Mn) Analysis & Forecast by Source, 2021 –2031
Figure 78: South Asia Moringa Supplements Market Volume (Tons) Analysis & Forecast by Source, 2021 –2031
Figure 79: South Asia Moringa Supplements Market Value (US$ Mn) Analysis & Forecast by Sales Channel, 2021 –2031
Figure 80: South Asia Moringa Supplements Market Volume (Tons) Analysis & Forecast by Sales Channel, 2021 –2031
Figure 81: South Asia Moringa Supplements Market Value (US$ Mn) Analysis & Forecast by Country, 2021 –2031
Figure 82: South Asia Moringa Supplements Market Volume (Tons) Analysis & Forecast by Country, 2021 –2031
Figure 83: South Asia Moringa Supplements Market Attractiveness Analysis by Region, 2021 -2031
Figure 84: South Asia Moringa Supplements Market Attractiveness Analysis by Form, 2021 -2031
Figure 85: South Asia Moringa Supplements Market Attractiveness Analysis by Nature, 2021-2031
Figure 86: South Asia Moringa Supplements Market Attractiveness Analysis by Sales Channel, 2021 -2031
Figure 87: South Asia Moringa Supplements Market Attractiveness Analysis by Source, 2021-2031
Figure 88: East Asia Moringa Supplements Market Value (US$ Mn) Analysis & Forecast by Nature, 2021 –2031
Figure 89: East Asia Moringa Supplements Market Volume (Tons) Analysis & Forecast by Nature, 2021 –2031
Figure 90: East Asia Moringa Supplements Market Value (US$ Mn) Analysis & Forecast by Form, 2021 –2031
Figure 91: East Asia Moringa Supplements Market Volume (Tons) Analysis & Forecast by Form, 2021 –2031
Figure 92: East Asia Moringa Supplements Market Value (US$ Mn) Analysis & Forecast by Source, 2021 –2031
Figure 93: East Asia Moringa Supplements Market Volume (Tons) Analysis & Forecast by Source, 2021 –2031
Figure 94: East Asia Moringa Supplements Market Value (US$ Mn) Analysis & Forecast by Sales Channel, 2021 –2031
Figure 95: East Asia Moringa Supplements Market Volume (Tons) Analysis & Forecast by Sales Channel, 2021 –2031
Figure 96: East Asia Moringa Supplements Market Value (US$ Mn) Analysis & Forecast by Country, 2021 –2031
Figure 97: East Asia Moringa Supplements Market Volume (Tons) Analysis & Forecast by Country, 2021 –2031
Figure 98: East Asia Moringa Supplements Market Attractiveness Analysis by Region, 2021 -2031
Figure 99: East Asia Moringa Supplements Market Attractiveness Analysis by Form, 2021 -2031
Figure 100: East Asia Moringa Supplements Market Attractiveness Analysis by Nature, 2021-2031
Figure 101: East Asia Moringa Supplements Market Attractiveness Analysis by Sales Channel, 2021 -2031
Figure 102: East Asia Moringa Supplements Market Attractiveness Analysis by Source, 2021-2031
Figure 103: Oceania Moringa Supplements Market Value (US$ Mn) Analysis & Forecast by Nature, 2021 –2031
Figure 104: Oceania Moringa Supplements Market Volume (Tons) Analysis & Forecast by Nature, 2021 –2031
Figure 105: Oceania Moringa Supplements Market Value (US$ Mn) Analysis & Forecast by Form, 2021 –2031
Figure 106: Oceania Moringa Supplements Market Volume (Tons) Analysis & Forecast by Form, 2021 –2031
Figure 107: Oceania Moringa Supplements Market Value (US$ Mn) Analysis & Forecast by Source, 2021 –2031
Figure 108: Oceania Moringa Supplements Market Volume (Tons) Analysis & Forecast by Source, 2021 –2031
Figure 109: Oceania Moringa Supplements Market Value (US$ Mn) Analysis & Forecast by Sales Channel, 2021 –2031
Figure 110: Oceania Moringa Supplements Market Volume (Tons) Analysis & Forecast by Sales Channel, 2021 –2031
Figure 111: Oceania Moringa Supplements Market Value (US$ Mn) Analysis & Forecast by Country, 2021 –2031
Figure 112: Oceania Moringa Supplements Market Volume (Tons) Analysis & Forecast by Country, 2021 –2031
Figure 113: Oceania Moringa Supplements Market Attractiveness Analysis by Region, 2021 -2031
Figure 114: Oceania Moringa Supplements Market Attractiveness Analysis by Form, 2021 -2031
Figure 115: Oceania Moringa Supplements Market Attractiveness Analysis by Nature, 2021-2031
Figure 116: Oceania Moringa Supplements Market Attractiveness Analysis by Sales Channel, 2021 -2031
Figure 117: Oceania Moringa Supplements Market Attractiveness Analysis by Source, 2021-2031
Figure 118: Middle East & Africa Moringa Supplements Market Value (US$ Mn) Analysis & Forecast by Nature, 2021 –2031
Figure 119: Middle East & Africa Moringa Supplements Market Volume (Tons) Analysis & Forecast by Nature, 2021 –2031
Figure 120: Middle East & Africa Moringa Supplements Market Value (US$ Mn) Analysis & Forecast by Form, 2021 –2031
Figure 121: Middle East & Africa Moringa Supplements Market Volume (Tons) Analysis & Forecast by Form, 2021 –2031
Figure 122: Middle East & Africa Moringa Supplements Market Value (US$ Mn) Analysis & Forecast by Source, 2021 –2031
Figure 123: Middle East & Africa Moringa Supplements Market Volume (Tons) Analysis & Forecast by Source, 2021 –2031
Figure 124: Middle East & Africa Moringa Supplements Market Value (US$ Mn) Analysis & Forecast by Sales Channel, 2021 –2031
Figure 125: Middle East & Africa Moringa Supplements Market Volume (Tons) Analysis & Forecast by Sales Channel, 2021 –2031
Figure 126: Middle East & Africa Moringa Supplements Market Value (US$ Mn) Analysis & Forecast by Country, 2021 –2031
Figure 127: Middle East & Africa Moringa Supplements Market Volume (Tons) Analysis & Forecast by Country, 2021 –2031
Figure 128: Middle East & Africa Moringa Supplements Market Attractiveness Analysis by Region, 2021 -2031
Figure 129: Middle East & Africa Moringa Supplements Market Attractiveness Analysis by Form, 2021 -2031
Figure 130: Middle East & Africa Moringa Supplements Market Attractiveness Analysis by Nature, 2021-2031
Figure 131: Middle East & Africa Moringa Supplements Market Attractiveness Analysis by Sales Channel, 2021 -2031
Figure 132: Middle East & Africa Moringa Supplements Market Attractiveness Analysis by Source, 2021-2031
Copyright © Transparency Market Research, Inc. All Rights reserved
Trust Online

Moringa Supplements Market
