Analysts’ Viewpoint on Macular Degeneration Treatment Market Scenario
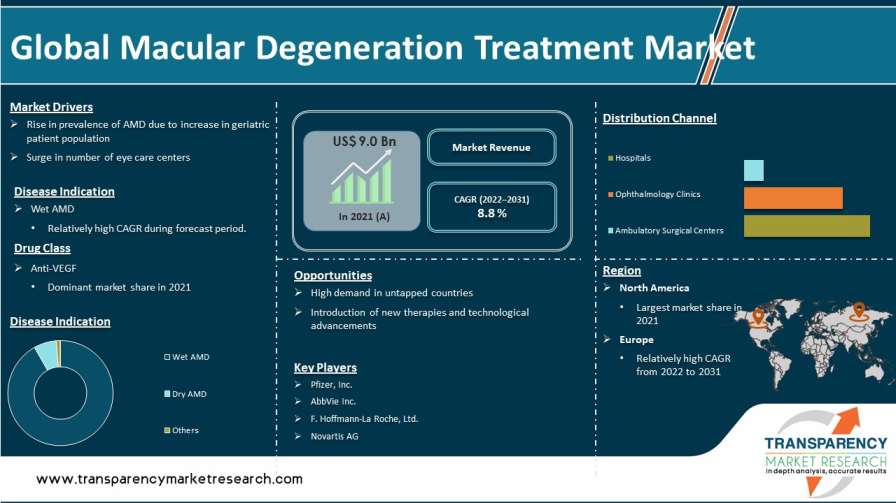
Macular degeneration is an eye condition that could deteriorate over time. It is the primary factor in severe, lifelong vision loss in adults over 60 years of age. Rise in prevalence and incidence of retinal disorders, increase in geriatric population, high annual cost of therapy (ACOT) for pipeline drugs, improved health care infrastructure, introduction of novel therapies, and surge in number of programs and initiatives to spread awareness are expected to drive the global macular degeneration treatment market during the forecast period. The global market is likely to be restrained in the near future by continual pressure from players mandating the use of Avastin for wAMD and invasive administration methods.
Treatment innovations for macular degeneration are providing hope that the disease could be cured one day. Promising treatments are dependent on the stage of disease progression. Nutritional therapy can help in dry macular degeneration treatment during the early stage of the disease. It includes a healthy diet that is high in antioxidants to support the cells of the macula. If macular degeneration is advanced but still dry, supplements to increase the number of certain vitamins and minerals that could increase healthy pigments and support cell structure are prescribed. Each affected eye is assigned to either laser treatment or observation at random. Laser treatment reduces the risk of severe visual loss in eligible eyes with CNV in extrafoveal, juxtafoveal, and subfoveal locations.
Rise in prevalence of age-related macular degeneration (AMD) is primarily expected to propel the global macular degeneration treatment market in the next few years. Increase in healthcare spending and rise in patient awareness are also likely to fuel the global market during the forecast period. Launch of novel products for the treatment of geographic atrophy, late stage of dry age-related macular degeneration treatment (dAMD), and wet AMD (wAMD) are projected to augment the age-related macular degeneration market. Drugs such as Apellis’ APL-2, Ophthotech’s Zimura, and Novartis’ brolucizumab, a longer-acting anti-VEGF, are anticipated to drive the global macular degeneration treatment market size in the near future. In particular, the launch of drugs in the AMD market to treat dAMD is anticipated to be a major driver, as currently, no prescription medications are available for this condition.
Patent expiry is likely to pose a threat to the market players' expansion strategies. On the other hand, exorbitant pricing may not be a good strategy to adopt for players who hold patents for their drugs. For instance, the patent for Lucentis expired in the U.S. in 2020, while its European patent expired in July 2022. Several companies are in the race to introduce Lucentis biosimilar for the monthly treatment of neovascular age-related macular degeneration treatment (nAMD). Lack of prescription drugs in the international AMD market is expected to hamper demand in the near future.
In terms of disease indication, the global maculation degeneration market has been bifurcated into wet age-related macular degeneration and dry age-related macular degeneration. The wet age-related macular degeneration segment accounted for major share of the global market in 2021. Wet AMD is treated with intravitreal injections (IVT), with an estimated 22.3 million procedures performed globally in 2017. Around 75% of anti-VEGF injections were given to treat wet AMD. High prevalence of the condition, branded medications, growth in awareness, and increase in the number of treatments for wet AMD contributed to the segment's dominant market share.
Based on drug class, the global macular degeneration treatment market has been bifurcated into anti-vascular endothelial growth factors and others. Blinding retinal conditions, such as diabetic macular edoema (DME), age-related macular degeneration (AMD), and retinal diseases, are largely attributed to the pathogenesis of vascular endothelial growth factor (VEGF). It has been demonstrated that inhibiting VEGF activity within the eye can improve and restore visual function in AMD patients. Direct macular degeneration injections of anti-VEGF medications are made into the eye's vitreous cavity. Large patient pool across the globe is another factor likely to propel the anti-vascular endothelial growth factors segment in the near future.
In terms of distribution channel, the global macular degeneration treatment market has been divided into hospitals, ophthalmology clinics, and ambulatory surgical centers. The hospitals segment is expected to account for more than 51.6% share of the global market by 2031. The segment is likely to grow at a CAGR of 6.6% during the forecast period. Hospitals treat the majority of new AMD cases in developed countries.
North America accounted for the largest global macular degeneration treatment market share in 2021. The trend is projected to continue during the forecast period. Adoption rate of prescription AMD drugs is high in the U.S., and the number of new drug approvals in the country is increasing.
Europe accounted for more than 32.1% share of the global macular degeneration treatment market in 2021. The macular degeneration treatment market in the region is expected to grow at a rapid pace during the forecast period due to large unmet needs and increase in purchasing power to obtain branded drugs. Improvement in lifestyle, particularly among the urban population, and the introduction of new drugs for macular degeneration are expected to boost the demand for macular degeneration treatment drugs in Europe.
Asia Pacific accounted for more than 13% share of the global market in 2021 due to large population base and increase in treatment adoption rate in the region. Rise in disposable income and health awareness have increased the diagnosis and treatment rates. This has resulted in a rise in number of macular degeneration drugs in the market. Key players are investing significantly to establish themselves in Asia Pacific. This is expected to augment the market in the region.
The global macular degeneration treatment market is fragmented, with the presence of a vast number of large-scale players. Key players operating in the global macular degeneration treatment market include AbbVie, Inc., Pfizer, Inc., Bayer AG, F. Hoffmann-La Roche Ltd., Regeneron Pharmaceuticals, Inc., Novartis AG, and Santen Pharmaceutical Co., Ltd. These players are adopting growth strategies such as new product development, product launches, agreements, partnerships, and mergers.
Each of these players has been profiled in the macular degeneration treatment market report based on parameters such as company overview, financial overview, business strategies, product portfolio, business segments, and recent developments.
|
Attribute |
Detail |
|
Market Size Value in 2021 |
US$ 9.0 Bn |
|
Market Forecast Value in 2031 |
More than US$ 21.1 Bn |
|
Growth Rate (CAGR) 2022-2031 |
8.8% |
|
Forecast Period |
2022–2031 |
|
Historical Data Available for |
2017–2021 |
|
Quantitative Units |
US$ Bn for Value |
|
Market Analysis |
It includes segment analysis as well as regional level analysis. Moreover, qualitative analysis includes drivers, restraints, opportunities, key trends, Porter’s Five Forces analysis, value chain analysis, and key trend analysis. |
|
Competition Landscape |
|
|
Format |
Electronic (PDF) + Excel |
|
Market Segmentation |
|
|
Regions Covered |
|
|
Countries Covered |
|
|
Companies Profiled |
|
|
Customization Scope |
Available upon request |
|
Pricing |
Available upon request |
The global macular degeneration treatment market was valued at US$ 9.0 Bn in 2021
The global macular degeneration treatment market is projected to reach more than US$ 21.1 Bn by 2031
The global macular degeneration treatment market grew at a CAGR of 7.4% from 2017 to 2021
The global macular degeneration treatment market is anticipated to grow at a CAGR of 8.8% from 2022 to 2031
The wet AMD segment held major share of around 94% of the global macular degeneration treatment market in 2021
North America is expected to account for major share of the global macular degeneration treatment market during the forecast period.
Pfizer, Inc., AbbVie Inc., F. Hoffmann-La Roche, Ltd., Regeneron Pharmaceuticals, Inc., Bayer AG, Novartis AG, and Santen Pharmaceutical Co., Ltd.
1. Preface
1.1. Market Definition and Scope
1.2. Market Segmentation
1.3. Key Research Objectives
1.4. Research Highlights
2. Assumptions and Research Methodology
3. Executive Summary: Global Macular Degeneration Treatment Market
4. Market Overview
4.1. Introduction
4.1.1. Segment Definition
4.2. Overview
4.3. Market Dynamics
4.3.1. Drivers
4.3.2. Restraints
4.3.3. Opportunities
4.4. Global Macular Degeneration Treatment Market Analysis and Forecast, 2017–2031
4.4.1. Market Revenue Projections (US$ Mn)
5. Key Insights
5.1. Regulatory Scenario
5.2. Pipeline Analysis
5.3. Disease Prevalence & incidence rate with key countries
5.4. Covid-19 Impact Analysis
6. Global Macular Degeneration Treatment Market Analysis and Forecast, by Disease Indication
6.1. Introduction & Definition
6.2. Key Findings / Developments
6.3. Market Value Forecast, by Disease Indication, 2017–2031
6.3.1. Wet Age-related Macular Degeneration
6.3.2. Dry Age-related Macular Degeneration
6.3.3. Others
6.4. Market Attractiveness Analysis, by Disease Indication
7. Global Macular Degeneration Treatment Market Analysis and Forecast, by Drug Class
7.1. Introduction & Definition
7.2. Key Findings / Developments
7.3. Market Value Forecast, by Drug Class, 2017–2031
7.3.1. Anti-vascular Endothelial Growth Factor
7.3.2. Others
7.4. Market Attractiveness Analysis, by Drug Class
8. Global Macular Degeneration Treatment Market Analysis and Forecast, by Distribution Channel
8.1. Introduction & Definition
8.2. Key Findings / Developments
8.3. Market Value Forecast, by Distribution Channel, 2017–2031
8.3.1. Hospitals
8.3.2. Ophthalmology Clinics
8.3.3. Ambulatory Surgical Centers
8.4. Market Attractiveness Analysis, by Distribution Channel
9. Global Macular Degeneration Treatment Market Analysis and Forecast, by Region
9.1. Key Findings
9.2. Market Value Forecast, by Region
9.2.1. North America
9.2.2. Europe
9.2.3. Asia Pacific
9.2.4. Latin America
9.2.5. Middle East & Africa
9.3. Market Attractiveness Analysis, by Region
10. North America Macular Degeneration Treatment Market Analysis and Forecast
10.1. Introduction
10.1.1. Key Findings
10.2. Market Value Forecast, by Disease Indication, 2017–2031
10.2.1. Wet Age-related Macular Degeneration
10.2.2. Dry Age-related Macular Degeneration
10.2.3. Others
10.3. Market Value Forecast, by Drug Class, 2017–2031
10.3.1. Anti-vascular Endothelial Growth Factor
10.3.2. Others
10.4. Market Value Forecast, by Distribution Channel, 2017–2031
10.4.1. Hospitals
10.4.2. Ophthalmology Clinics
10.4.3. Ambulatory Surgical Centers
10.5. Market Value Forecast, by Country, 2017–2031
10.5.1. U.S.
10.5.2. Canada
10.6. Market Attractiveness Analysis
10.6.1. By Disease Indication
10.6.2. By Drug Class
10.6.3. By Distribution Channel
10.6.4. By Country
11. Europe Macular Degeneration Treatment Market Analysis and Forecast
11.1. Introduction
11.1.1. Key Findings
11.2. Market Value Forecast, by Disease Indication, 2017–2031
11.2.1. Wet Age-related Macular Degeneration
11.2.2. Dry Age-related Macular Degeneration
11.2.3. Others
11.3. Market Value Forecast, by Drug Class, 2017–2031
11.3.1. Anti-vascular Endothelial Growth Factor
11.3.2. Others
11.4. Market Value Forecast, by Distribution Channel, 2017–2031
11.4.1. Hospitals
11.4.2. Ophthalmology Clinics
11.4.3. Ambulatory Surgical Centers
11.5. Market Value Forecast, by Country/Sub-region, 2017–2031
11.5.1. Germany
11.5.2. U.K.
11.5.3. France
11.5.4. Italy
11.5.5. Spain
11.5.6. Rest of Europe
11.6. Market Attractiveness Analysis
11.6.1. By Disease Indication
11.6.2. By Drug Class
11.6.3. By Distribution Channel
11.6.4. By Country/Sub-region
12. Asia Pacific Macular Degeneration Treatment Market Analysis and Forecast
12.1. Introduction
12.1.1. Key Findings
12.2. Market Value Forecast, by Disease Indication, 2017–2031
12.2.1. Wet Age-related Macular Degeneration
12.2.2. Dry Age-related Macular Degeneration
12.2.3. Others
12.3. Market Value Forecast, by Drug Class, 2017–2031
12.3.1. Anti-vascular Endothelial Growth Factor
12.3.2. Others
12.4. Market Value Forecast, by Distribution Channel, 2017–2031
12.4.1. Hospitals
12.4.2. Ophthalmology Clinics
12.4.3. Ambulatory Surgical Centers
12.5. Market Value Forecast, by Country/Sub-region, 2017–2031
12.5.1. China
12.5.2. India
12.5.3. Japan
12.5.4. Australia & New Zealand
12.5.5. Rest of Asia Pacific
12.6. Market Attractiveness Analysis
12.6.1. By Disease Indication
12.6.2. By Drug Class
12.6.3. By Distribution Channel
12.6.4. By Country/Sub-region
13. Latin America Macular Degeneration Treatment Market Analysis and Forecast
13.1. Introduction
13.1.1. Key Findings
13.2. Market Value Forecast, by Disease Indication, 2017–2031
13.2.1. Wet Age-related Macular Degeneration
13.2.2. Dry Age-related Macular Degeneration
13.2.3. Others
13.3. Market Value Forecast, by Drug Class, 2017–2031
13.3.1. Anti-vascular Endothelial Growth Factor
13.3.2. Others
13.4. Market Value Forecast, by Distribution Channel, 2017–2031
13.4.1. Hospitals
13.4.2. Ophthalmology Clinics
13.4.3. Ambulatory Surgical Centers
13.5. Market Value Forecast, by Country/Sub-region, 2017–2031
13.5.1. Brazil
13.5.2. Mexico
13.5.3. Rest of Latin America
13.6. Market Attractiveness Analysis
13.6.1. By Disease Indication
13.6.2. By Drug Class
13.6.3. By Distribution Channel
13.6.4. By Country/Sub-region
14. Middle East & Africa Macular Degeneration Treatment Market Analysis and Forecast
14.1. Introduction
14.1.1. Key Findings
14.2. Market Value Forecast, by Disease Indication, 2017–2031
14.2.1. Wet Age-related Macular Degeneration
14.2.2. Dry Age-related Macular Degeneration
14.2.3. Others
14.3. Market Value Forecast, by Drug Class, 2017–2031
14.3.1. Anti-vascular Endothelial Growth Factor
14.3.2. Others
14.4. Market Value Forecast, by Distribution Channel, 2017–2031
14.4.1. Hospitals
14.4.2. Ophthalmology Clinics
14.4.3. Ambulatory Surgical Centers
14.5. Market Value Forecast, by Country/Sub-region, 2017–2031
14.5.1. GCC
14.5.2. South Africa
14.5.3. Rest of Middle East & Africa
14.6. Market Attractiveness Analysis
14.6.1. By Disease Indication
14.6.2. By Drug Class
14.6.3. By Distribution Channel
14.6.4. By Country/Sub-region
15. Competition Landscape
15.1. Market Player - Competition Matrix (by tier and size of companies)
15.2. Market Share Analysis, by Company, 2021
15.3. Company Profiles
15.3.1. Pfizer, Inc.
15.3.1.1. Company Overview
15.3.1.2. Product Portfolio
15.3.1.3. SWOT Analysis
15.3.1.4. Financial Overview
15.3.1.5. Strategic Overview
15.3.2. AbbVie, Inc.
15.3.2.1. Company Overview
15.3.2.2. Product Portfolio
15.3.2.3. SWOT Analysis
15.3.2.4. Financial Overview
15.3.2.5. Strategic Overview
15.3.3. F. Hoffmann-La Roche, Ltd.
15.3.3.1. Company Overview
15.3.3.2. Product Portfolio
15.3.3.3. SWOT Analysis
15.3.3.4. Financial Overview
15.3.3.5. Strategic Overview
15.3.4. Regeneron Pharmaceuticals, Inc.
15.3.4.1. Company Overview
15.3.4.2. Product Portfolio
15.3.4.3. SWOT Analysis
15.3.4.4. Financial Overview
15.3.4.5. Strategic Overview
15.3.5. Bayer AG
15.3.5.1. Company Overview
15.3.5.2. Product Portfolio
15.3.5.3. SWOT Analysis
15.3.5.4. Financial Overview
15.3.5.5. Strategic Overview
15.3.6. Novartis AG
15.3.6.1. Company Overview
15.3.6.2. Product Portfolio
15.3.6.3. SWOT Analysis
15.3.6.4. Financial Overview
15.3.6.5. Strategic Overview
15.3.7. Santen Pharmaceutical Co., Ltd.
15.3.7.1. Company Overview
15.3.7.2. Product Portfolio
15.3.7.3. SWOT Analysis
15.3.7.4. Financial Overview
15.3.7.5. Strategic Overview
List of Tables
Table 01: Global Macular Degeneration Treatment Market Value (US$ Mn) Forecast, by Disease Indication, 2017–2031
Table 02: Global Macular Degeneration Treatment Market Value (US$ Mn) Forecast, by Drug Class, 2017–2031
Table 03: Global Macular Degeneration Treatment Market Value (US$ Mn) Forecast, by Distribution Channel, 2017–2031
Table 04: Global Macular Degeneration Treatment Market Value (US$ Mn) Forecast, by Region, 2017–2031
Table 05: North America Macular Degeneration Treatment Market Value (US$ Mn) Forecast, by Drug Class, 2017–2031
Table 06: North America Macular Degeneration Treatment Market Value (US$ Mn) Forecast, by Disease Indication, 2017–2031
Table 07: North America Macular Degeneration Treatment Market Value (US$ Mn) Forecast, by Distribution Channel, 2017–2031
Table 08: North America Macular Degeneration Treatment Market Value (US$ Mn) Forecast, by Country, 2017–2031
Table 08: Europe Macular Degeneration Treatment Market Value (US$ Mn) Forecast, by Drug Class, 2017–2031
Table 09: Europe Macular Degeneration Treatment Market Value (US$ Mn) Forecast, by Disease Indication, 2017–2031
Table 10: Europe Macular Degeneration Treatment Market Value (US$ Mn) Forecast, by Distribution Channel, 2017–2031
Table 11: Europe Macular Degeneration Treatment Market Value (US$ Mn) Forecast, by Country/Sub-region, 2017–2031
Table 12: Asia Pacific Macular Degeneration Treatment Market Value (US$ Mn) Forecast, by Drug Class, 2017–2031
Table 13: Asia Pacific Macular Degeneration Treatment Market Value (US$ Mn) Forecast, by Disease Indication, 2017–2031
Table 14: Asia Pacific Macular Degeneration Treatment Market Value (US$ Mn) Forecast, by Distribution Channel, 2017–2031
Table 15: Asia Pacific Macular Degeneration Treatment Market Value (US$ Mn) Forecast, by Country/Sub-region, 2017–2031
Table 16: Latin America Macular Degeneration Treatment Market Value (US$ Mn) Forecast, by Drug Class, 2017–2031
Table 17: Latin America Macular Degeneration Treatment Market Value (US$ Mn) Forecast, by Disease Indication, 2017–2031
Table 18: Latin America Macular Degeneration Treatment Market Value (US$ Mn) Forecast, by Distribution Channel, 2017–2031
Table 19: Latin America Macular Degeneration Treatment Market Value (US$ Mn) Forecast, by Country/Sub-region, 2017–2031
Table 20: Middle East & Africa Macular Degeneration Treatment Market Value (US$ Mn) Forecast, by Drug Class, 2017–2031
Table 21: Middle East & Africa Macular Degeneration Treatment Market Value (US$ Mn) Forecast, by Disease Indication, 2017–2031
Table 22: Middle East & Africa Macular Degeneration Treatment Market Value (US$ Mn) Forecast, by Distribution Channel, 2017–2031
Table 23: Middle East & Africa Macular Degeneration Treatment Market Value (US$ Mn) Forecast, by Country/Sub-region, 2017–2031
List of Figures
Figure 01: Global Macular Degeneration Treatment Market Snapshot
Figure 02: Global Macular Degeneration Treatment Market Value (US$ Mn) Forecast and Y-o-Y Growth (%), 2017–2031
Figure 03: Global Macular Degeneration Treatment Market Value Share, by Disease Indication, 2021
Figure 04: Global Macular Degeneration Treatment Market Value Share, by Drug Class, 2021
Figure 05: Global Macular Degeneration Treatment Market Value Share, by Distribution Channel, 2021
Figure 06: Global Macular Degeneration Treatment Market Value Share, by Region, 2021
Figure 07: Global Macular Degeneration Treatment Market Value Share Analysis, by Disease Indication, 2021 and 2031
Figure 08: Global Macular Degeneration Treatment Market Value (US$ Mn) and Y-o-Y Growth, by Wet AMD, 2017–2031
Figure 09: Global Macular Degeneration Treatment Market Value (US$ Mn) and Y-o-Y Growth, by Dry AMD, 2017–2031
Figure 10: Global Macular Degeneration Treatment Market Value (US$ Mn) and Y-o-Y Growth, by Other Indications, 2017–2031
Figure 11: Global Macular Degeneration Treatment Market Attractiveness Analysis, by Disease Indication, 2022–2031
Figure 12: Global Macular Degeneration Treatment Market Value Share Analysis, by Drug Class, 2021 and 2031
Figure 13: Global Macular Degeneration Treatment Market Value (US$ Mn) and Y-o-Y Growth, by Anti-vascular Endothelial Growth Factor, 2017–2031
Figure 14: Global Macular Degeneration Treatment Market Value (US$ Mn) and Y-o-Y Growth, by Others, 2017–2031
Figure 15: Global Macular Degeneration Treatment Market Attractiveness Analysis, by Drug Class, 2022–2031
Figure 16: Global Macular Degeneration Treatment Market Value Share Analysis, by Distribution Channel, 2021 and 2031
Figure 17: Global Macular Degeneration Treatment Market Value (US$ Mn) and Y-o-Y Growth, by Hospitals, 2017–2031
Figure 18: Global Macular Degeneration Treatment Market Value (US$ Mn) and Y-o-Y Growth, by Ophthalmology Clinics, 2017–2031
Figure 19: Global Macular Degeneration Treatment Market Value (US$ Mn) and Y-o-Y Growth, by Ambulatory Surgical Centers, 2017–2031
Figure 20: Global Macular Degeneration Treatment Market Attractiveness Analysis, by Distribution Channel, 2022–2031
Figure 21: Macular Degeneration Treatment Market Value Share Analysis, by Region, 2017 and 2031
Figure 22: Macular Degeneration Treatment Market Attractiveness Analysis by Region, 2022–2031
Figure 23: North America Macular Degeneration Treatment Market Value (US$ Mn) Forecast and Y-o-Y Growth (%) Projection, 2017–2031
Figure 24 North America Macular Degeneration Treatment Market Value Share Analysis, by Drug Class, 2017 and 2031
Figure 25: North America Macular Degeneration Treatment Market Attractiveness Analysis, by Drug Class, 2022–2031
Figure 26: North America Macular Degeneration Treatment Market Value Share Analysis, by Disease Indication, 2017 and 2031
Figure 27: North America Macular Degeneration Treatment Market Attractiveness Analysis, by Disease Indication, 2022–2031
Figure 28: North America Macular Degeneration Treatment Market Value Share Analysis, by Distribution Channel, 2017–2031
Figure 29: North America Macular Degeneration Treatment Market Attractiveness Analysis, by Distribution Channel, 2022–2031
Figure 30: North America Macular Degeneration Treatment Market Value Share Analysis, by Country, 2017 and 2031
Figure 31: North America Macular Degeneration Treatment Market Attractiveness Analysis, by Country, 2022–2031
Figure 32: Europe Macular Degeneration Treatment Market Value (US$ Mn) Forecast and Y-o-Y Growth (%) Projection, 2017–2031
Figure 33: Europe Macular Degeneration Treatment Market Value Share Analysis, by Drug Class, 2017 and 2031
Figure 34: Europe Macular Degeneration Treatment Market Attractiveness Analysis, by Drug Class, 2022–2031
Figure 35: Europe Macular Degeneration Treatment Market Value Share Analysis, by Disease Indication, 2017 and 2031
Figure 36: Europe Macular Degeneration Treatment Market Attractiveness Analysis, by Disease Indication, 2022–2031
Figure 37: Europe Macular Degeneration Treatment Market Value Share Analysis, by Distribution Channel, 2021–2031
Figure 38: Europe Macular Degeneration Treatment Market Attractiveness Analysis, by Distribution Channel, 2022–2031
Figure 39: Europe Macular Degeneration Treatment Market Value Share Analysis, by Country/Sub-region, 2017 and 2031
Figure 40: Europe Macular Degeneration Treatment Market Attractiveness Analysis, by Country/Sub-region, 2022–2031
Figure 41: Asia Pacific Macular Degeneration Treatment Market Value (US$ Mn) Forecast and Y-o-Y Growth (%) Projection, 2017–2031
Figure 42: Asia Pacific Macular Degeneration Treatment Market Value Share Analysis, by Drug Class, 2017 and 2031
Figure 43: Asia Pacific Macular Degeneration Treatment Market Attractiveness Analysis, by Drug Class, 2022–2031
Figure 44: Asia Pacific Macular Degeneration Treatment Market Value Share Analysis, by Disease Indication, 2017 and 2031
Figure 45: Asia Pacific Macular Degeneration Treatment Market Attractiveness Analysis, by Disease Indication, 2022–2031
Figure 46: Asia Pacific Macular Degeneration Treatment Market Value Share Analysis, by Distribution Channel, 2017–2031
Figure 47: Asia Pacific Macular Degeneration Treatment Market Attractiveness Analysis, by Distribution Channel, 2022–2031
Figure 48: Asia Pacific Macular Degeneration Treatment Market Value Share Analysis, by Country/Sub-region, 2017 and 2031
Figure 49: Asia Pacific Macular Degeneration Treatment Market Attractiveness Analysis, by Country/Sub-region, 2022–2031
Figure 50: Latin America Macular Degeneration Treatment Market Value (US$ Mn) Forecast and Y-o-Y Growth (%) Projection, 2017–2031
Figure 51: Latin America Macular Degeneration Treatment Market Value Share Analysis, by Drug Class, 2017 and 2031
Figure 52: Latin America Macular Degeneration Treatment Market Attractiveness Analysis, by Drug Class, 2022–2031
Figure 53: Latin America Macular Degeneration Treatment Market Value Share Analysis, by Disease Indication, 2017 and 2031
Figure 54: Latin America Macular Degeneration Treatment Market Attractiveness Analysis, by Disease Indication, 2022–2031
Figure 55: Latin America Macular Degeneration Treatment Market Value Share Analysis, by Distribution Channel, 2017–2031
Figure 56: Latin America Macular Degeneration Treatment Market Attractiveness Analysis, by Distribution Channel, 2022–2031
Figure 57: Latin America Macular Degeneration Treatment Market Value Share Analysis, by Country/Sub-region, 2017 and 2031
Figure 58: Latin America Macular Degeneration Treatment Market Attractiveness Analysis, by Country/Sub-region, 2022–2031
Figure 59: Middle East & Africa Macular Degeneration Treatment Market Value (US$ Mn) Forecast and Y-o-Y Growth (%) Projection, 2017–2031
Figure 60: Middle East & Africa Macular Degeneration Treatment Market Value Share Analysis, by Drug Class, 2017 and 2031
Figure 61: Middle East & Africa Macular Degeneration Treatment Market Attractiveness Analysis, by Drug Class, 2022–2031
Figure 62: Middle East & Africa Macular Degeneration Treatment Market Value Share Analysis, by Disease Indication, 2017 and 2031
Figure 63: Middle East & Africa Macular Degeneration Treatment Market Attractiveness Analysis, by Disease Indication, 2022–2031
Figure 64: Middle East & Africa Macular Degeneration Treatment Market Value Share Analysis, by Distribution Channel, 2017–2031
Figure 65: Middle East & Africa Macular Degeneration Treatment Market Attractiveness Analysis, by Distribution Channel, 2022–2031
Figure 66: Middle East & Africa Macular Degeneration Treatment Market Value Share Analysis, by Country, 2017 and 2031
Figure 67: Middle East & Africa Macular Degeneration Treatment Market Attractiveness Analysis, by Country, 2022–2031
Copyright © Transparency Market Research, Inc. All Rights reserved
Trust Online

Macular Degeneration Treatment Market
