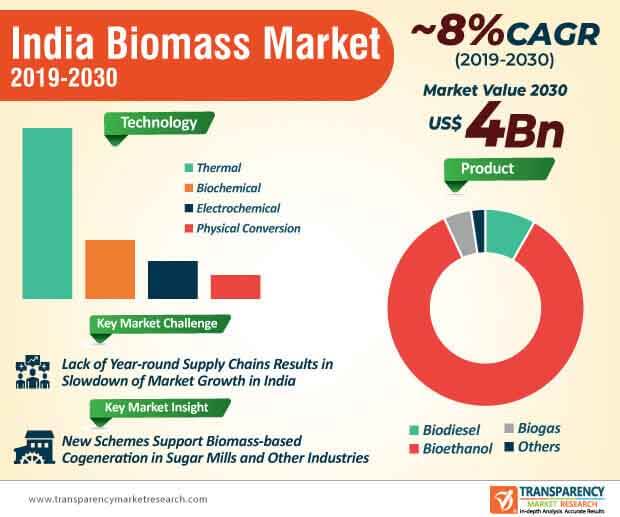
The launch of new schemes is anticipated to generate incremental opportunities for companies in the India biomass market. For instance, the Ministry of New and Renewable Energy (MNRE) in India announced a scheme to support biomass-based cogeneration in sugar mills and other industries. It is found that India has the capability to generate several thousands of megawatts of renewable energy from biomass available in bagasse cogeneration from sugar mills. Moreover, the Indian Government’s financial assistance is projected to play an instrumental role for energy generation through biomass cogeneration projects.
With the help of the Government’s financial aid, companies in the India biomass market are investing in their exports capacities to tap into revenue opportunities. Moreover, surplus biomass availability, especially from the agriculture sector, is another key driver that is fueling the market growth. The launch of new schemes in the support of biomass cogeneration projects is playing a vital role to leverage capacity additions in small biogas plants located in remote and rural parts of India.

The India biomass market is attracting investments from green energy companies outside of India to capitalize on value-grab opportunities. For instance, in October 2019, Bloom Energy-a provider of sustainable and cost-efficient on-site electricity for organizations announced a joint effort with EnergyPower, a zero carbon and net zero emissions technology company to deploy its first-of-its-kind commercial scale on-site project to power organizations in India. There is a growing demand for integrated solutions for the supply of clean and reliable power to businesses in India.
Novel agricultural and municipal waste digesters are being combined with the solid oxide fuel cell technology to deploy reliable and renewable power sources to customers. Such technological advancements are powering growth of the India biomass market, which is estimated to reach a value of ~US$ 4 Bn by the end of 2030. Renewable power generation using biomass has significantly reduced methane emissions, which is relatively more harmful to the atmosphere as compared to CO2 emissions.
Customers in the India biomass market are assured continuous energy flow through biomass energy generation, unlike wind and solar energy, which is subject to energy fluctuations. However, poor supply chains are some of the biggest hurdles that are inhibiting market growth. This can be attributed to biomass availability is not certain during the year. For instance, biomass from agriculture is available only after the harvesting period, which indicates that the raw material can only last up to a few months. Hence, companies in the India biomass market are procuring and storing the required volume of biomass to avoid supply chain fluctuations.
Among all agriculture-intensive states in India, companies in Uttar Pradesh are utilizing their biomass up to its full potential, due to the abundance of sugarcane industries. The India biomass market is flourishing due to increased availability of co-generation power plants in North Indian states, where the market is estimated to expand at a CAGR of ~8% during the forecast period.
The Punjab State Transmission Corporation Limited (PSTCL) has recently announced the cutback of renewable power generation until coronavirus (COVID-19) outbreak subsides. The Government is imposing the force majeure clause for renewable energy generators since continuation power generation could significantly impact supply chains. Apart from business activities in the India biomass market, other industries related to biomass generation are also experiencing a curtailment in various business processes. Moreover, lack of free flow in public transport is another restraining factor that has caused a major slowdown in the market landscape.
Apart from biomass, energy generators of solar and wind have also been forced to shut down their business activities. Cogen power, biogas, and mini hydel projects are experiencing a halt in revenue generation. As such, energy generators are positively responding to regulations issues under the nationwide lockdown.

Analysts’ Viewpoint
The India biomass market is undergoing a slight downtrend, as state governments have issued a curtailment on renewable energy generation activities until the COVID-19 outbreak subsides. Foreign green energy companies are eyeing opportunities in India’s flourishing industrial sector to establish clean energy ecosystems in Indian organizations.
New schemes supporting biomass cogeneration projects are generating incremental opportunities for renewable energy generators. However, many agriculture-intensive states, such as Maharashtra, Karnataka, and Andhra Pradesh are underutilizing the potential of the biomass energy. Hence, companies should focus their investments in North Indian states such as Uttar Pradesh and Punjab where companies can tap opportunities due to the abundance of sugarcane industries and co-generation power plants.
India Biomass Market – Segmentation
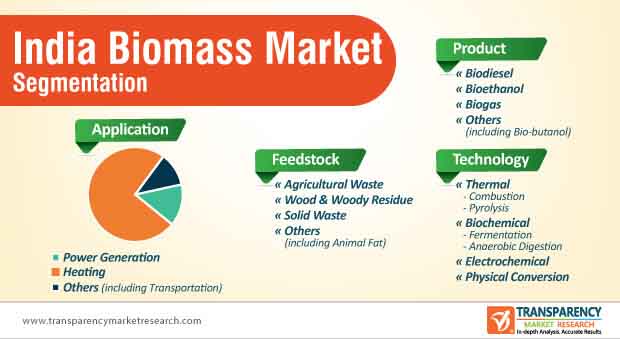
TMR’s research study assesses the biomass market in India based on feedstock, product, application, and technology. This report presents extensive market dynamics and progressive trends associated with different segments, and how they are influencing the growth prospects of the biomass market.
|
Feedstock |
Agricultural Waste Wood & Woody Residue Solid Waste Others (including Animal Fat) |
|
Product |
Biodiesel Bioethanol Biogas Others (including Bio-butanol) |
|
Application |
Power Generation Heating Others (including Transportation) |
|
Technology |
Thermal Biochemical Electrochemical Physical Conversion |
1. Executive Summary
1.1. Market Outlook
1.2. Key Facts and Figures
1.3. Key Trends
1.4. TMR’s Growth Opportunity Wheel
2. Market Overview
2.1. Market Segmentation
2.2. Market Indicators
3. Market Dynamics
3.1. Drivers and Restraints Snapshot Analysis
3.1.1.1. Drivers
3.1.1.2. Restraints
3.1.1.3. Opportunities
3.2. Porter’s Five Forces Analysis
3.2.1. Threat of Substitutes
3.2.2. Bargaining Power of Buyers
3.2.3. Bargaining Power of Suppliers
3.2.4. Threat of New Entrants
3.2.5. Degree of Competition
3.3. Regulatory Scenario
3.4. Value Chain Analysis
4. India Biomass Market Volume (Kilo Tons of Oil Equivalent) and Value (US$ Mn) Analysis, by Feedstock
4.1. Key Findings and Introduction
4.2. India Biomass Market Volume (Kilo Tons of Oil Equivalent) and Value (US$ Mn) Forecast, by Feedstock, 2019–2030
4.2.1. India Biomass Market Volume (Kilo Tons of Oil Equivalent) and Value (US$ Mn) Forecast, by Agricultural Waste, 2019–2030
4.2.2. India Biomass Market Volume (Kilo Tons of Oil Equivalent) and Value (US$ Mn) Forecast, by Wood & Woody Residue, 2019–2030
4.2.3. India Biomass Market Volume (Kilo Tons of Oil Equivalent) and Value (US$ Mn) Forecast, by Solid Waste, 2019–2030
4.2.4. India Biomass Market Volume (Kilo Tons of Oil Equivalent) and Value (US$ Mn) Forecast, by Others, 2019–2030
4.3. India Biomass Market Attractiveness Analysis, by Feedstock
5. India Biomass Market Volume (Kilo Tons of Oil Equivalent) and Value (US$ Mn) Analysis, by Product
5.1. Key Findings and Introduction
5.2. India Biomass Market Volume (Kilo Tons of Oil Equivalent) and Value (US$ Mn) Forecast, by Product, 2019–2030
5.2.1. India Biomass Market Volume (Kilo Tons of Oil Equivalent) and Value (US$ Mn) Forecast, by Biodiesel, 2019–2030
5.2.2. India Biomass Market Volume (Kilo Tons of Oil Equivalent) and Value (US$ Mn) Forecast, by Bioethanol, 2019–2030
5.2.3. India Biomass Market Volume (Kilo Tons of Oil Equivalent) and Value (US$ Mn) Forecast, by Biogas, 2019–2030
5.2.4. India Biomass Market Volume (Kilo Tons of Oil Equivalent) and Value (US$ Mn) Forecast, by Others, 2019–2030
5.3. India Biomass Market Attractiveness Analysis, by Product
6. India Biomass Market Volume (Kilo Tons of Oil Equivalent) and Value (US$ Mn) Analysis, by Application
6.1. Key Findings and Introduction
6.2. India Biomass Market Volume (Kilo Tons of Oil Equivalent) and Value (US$ Mn) Forecast, by Application, 2019–2030
6.2.1. India Biomass Market Volume (Kilo Tons of Oil Equivalent) and Value (US$ Mn) Forecast, by Power Generation, 2019–2030
6.2.2. India Biomass Market Volume (Kilo Tons of Oil Equivalent) and Value (US$ Mn) Forecast, by Heating, 2019–2030
6.2.3. India Biomass Market Volume (Kilo Tons of Oil Equivalent) and Value (US$ Mn) Forecast, by Others, 2019–2030
6.3. India Biomass Market Attractiveness Analysis, by Application
7. India Biomass Market Volume (Kilo Tons of Oil Equivalent) and Value (US$ Mn) Analysis, by Technology
7.1. Key Findings and Introduction
7.2. India Biomass Market Volume (Kilo Tons of Oil Equivalent) and Value (US$ Mn) Forecast, by Technology, 2019–2030
7.2.1. India Biomass Market Volume (Kilo Tons of Oil Equivalent) and Value (US$ Mn) Forecast, by Thermal, 2019–2030
7.2.1.1. India Biomass Market Volume (Kilo Tons of Oil Equivalent) and Value (US$ Mn) Forecast, by Combustion, 2019–2030
7.2.1.2. India Biomass Market Volume (Kilo Tons of Oil Equivalent) and Value (US$ Mn) Forecast, by Pyrolysis, 2019–2030
7.2.2. India Biomass Market Volume (Kilo Tons of Oil Equivalent) and Value (US$ Mn) Forecast, by Biochemical, 2019–2030
7.2.2.1. India Biomass Market Volume (Kilo Tons of Oil Equivalent) and Value (US$ Mn) Forecast, by Fermentation, 2019–2030
7.2.2.2. India Biomass Market Volume (Kilo Tons of Oil Equivalent) and Value (US$ Mn) Forecast, by Anaerobic Digestion, 2019–2030
7.2.3. India Biomass Market Volume (Kilo Tons of Oil Equivalent) and Value (US$ Mn) Forecast, by Electrochemical, 2019–2030
7.2.4. India Biomass Market Volume (Kilo Tons of Oil Equivalent) and Value (US$ Mn) Forecast, by Physical Conversion, 2019–2030
7.3. India Biomass Market Attractiveness Analysis, by Technology
8. Competition Landscape
8.1. Competition Matrix
8.2. Biomass Market Share Analysis, by Company (2019)
8.3. Market Footprint Analysis
8.4. Company Profiles
8.4.1. Emami Agrotech Ltd.
8.4.1.1. Company Details
8.4.1.2. Company Description
8.4.1.3. Business Overview
8.4.1.4. Financial Details
8.4.1.5. Strategic Overview/Recent Developments
8.4.2. Muenzer Bioindustrie GmbH
8.4.2.1. Company Details
8.4.2.2. Company Description
8.4.2.3. Business Overview
8.4.2.4. Financial Details
8.4.2.5. Strategic Overview/Recent Developments
8.4.3. Universal Biofuel
8.4.3.1. Company Details
8.4.3.2. Company Description
8.4.3.3. Business Overview
8.4.3.4. Financial Details
8.4.3.5. Strategic Overview/Recent Developments
8.4.4. Aemetis
8.4.4.1. Company Details
8.4.4.2. Company Description
8.4.4.3. Business Overview
8.4.4.4. Financial Details
8.4.4.5. Strategic Overview/Recent Developments
8.4.5. BIOD ENERGY (INDIA) PVT LTD
8.4.5.1. Company Details
8.4.5.2. Company Description
8.4.5.3. Business Overview
8.4.5.4. Financial Details
8.4.5.5. Strategic Overview/Recent Developments
8.4.6. Monopoly Innovations Private Limited
8.4.6.1. Company Details
8.4.6.2. Company Description
8.4.6.3. Business Overview
8.4.6.4. Financial Details
8.4.6.5. Strategic Overview/Recent Developments
8.4.7. EnviTec Biogas AG
8.4.7.1. Company Details
8.4.7.2. Company Description
8.4.7.3. Business Overview
8.4.7.4. Financial Details
8.4.7.5. Strategic Overview/Recent Developments
9. Primary Research – Key Insights
10. Appendix
10.1. Research Methodology and Assumptions
List of Tables
Table 01: India Biomass Market Volume (Kilo Tons of Oil Equivalent) Forecast, by Feedstock, 2019–2030
Table 02: India Biomass Market Value (US$ Mn) Forecast, by Feedstock, 2019–2030
Table 03: India Biomass Market Volume (Kilo Tons of Oil Equivalent) Forecast, by Product, 2019–2030
Table 04: India Biomass Market Value (US$ Mn) Forecast, by Product, 2019–2030
Table 05: India Biomass Market Volume (Kilo Tons of Oil Equivalent) Forecast, by Application, 2019–2030
Table 06: India Biomass Market Value (US$ Mn) Forecast, by Application, 2019–2030
Table 07: India Biomass Market Volume (Kilo Tons of Oil Equivalent) Forecast, by Technology, 2019–2030
Table 08: India Biomass Market Value (US$ Mn) Forecast, by Technology, 2019–2030
List of Figures
Figure 01: India Biomass Market Value Analysis, by Feedstock
Figure 02: India Biomass Market Attractiveness Analysis, by Feedstock
Figure 03: India Biomass Market Value Analysis, by Product
Figure 04: India Biomass Market Attractiveness Analysis, by Product
Figure 05: India Biomass Market Value Analysis, by Application
Figure 06: India Biomass Market Attractiveness Analysis, by Application
Figure 07: India Biomass Market Value Share Analysis, by Technology
Figure 08: India Biomass Market Attractiveness Analysis, by Technology