Due to the ongoing COVID-19 pandemic, several individuals are considering delaying their in vitro fertilization (IVF) treatment. Since the IVF treatment is linked with genetic compatibility test and sperm aneuploidy test, the delay in the IVF treatment of women may lead to staggered revenue growth in the in vitro fertilization test market. In order to overcome this challenge, healthcare professionals are increasing awareness that majority of patients in the reproductive age are generally not in the high risk-group in contracting the novel infection. Such awareness is anticipated to revive the growth of the in vitro fertilization test market.
Telemedicine appointments for initial and follow-up consultations are further reducing the risk of contracting COVID-19 among patients, medical professionals and individuals. In case of urgent and emergency visits at fertility clinics & hospitals, facilities are taking extra precaution to install HEPA (high efficiency particulate air) filtration systems.
The IVF procedure is potentially challenging in patients with pre-existing medical conditions. The IVF is a complex series of procedures involving ovarian stimulation, oocyte retrieval, and laboratory techniques to achieve maximal rates of fertilization, embryo development, and embryo transfer (ET). In order to ensure the faith of medically complicated patients, healthcare professionals are offering specific treatments to hypertension patients or patients with cardiovascular diseases. These include antihypertensive medications and regular cardiology consultation, respectively, to improve clinical outcomes in the in vitro fertilization test market.
Describing medical outcomes from in vitro fertilization test has been an evolving challenge throughout the world. This has led to the importance of three simple metrics that provide a transparent and highly accurate summary of IVF tests. These include the probability of having no embryo available to transfer, sustained implantation rate, and the number of supernumerary embryos cryopreserved during the cycle.
The preimplantation genetic testing (PGT) is being associated with significantly reducing the chances of having a baby with a specific genetic condition or chromosomal abnormality. This is evident since the preimplantation genetic testing is predicted to dictate the highest revenue share among all test types in the in vitro fertilization test market during the forecast period. Medical laboratory Reproductive Genetic Innovations in Illinois is gaining popularity for its PGT services that can be customized to obtain the most accurate diagnosis for a patient’s embryo.
Fertility clinics and hospitals in the in vitro fertilization test market are on-boarding scientists and genetic counselors that work with the patient’s physician to determine the optimal testing plan for each individual case. Such testing strategies help to determine which biopsy test will be recommended.
Based on claims of better live birth and reduced miscarriage rates, the technique of the preimplantation genetic testing for aneuploidy (PGT-A) in association with IVF has increasingly grown in the U.S. Companies in developing economies of South Asia are taking cues from such findings to improve their medical services in hospitals and fertility clinics.
PGT-A in a single trophectoderm biopsy at blastocyst stage reliably determines whether an embryo is euploid or chromosomal abnormal. PGT-A is gaining recognition in the in vitro fertilization test market for improving implantation rates and reducing miscarriages. This strategy has now become a routine add-on for IVF to determine whether human embryos are to be clinically utilized or disposed.
Analysts’ Viewpoint
Digital consultation and counselling are growing prominent in healthcare facilities during the coronavirus outbreak to minimize patient visits and avoid the novel infection. The Clomid challenge test is gaining increased popularity, and it is performed before the start of the IVF treatment. However, it is found that the test is either inconclusive or less reliable than other ovarian reserve tests. Hence, companies in the in vitro fertilization test market should increase awareness about PGT-A and the three simple metrics that help to improve clinical numbers and provide a highly accurate summary of ovarian reserve tests. PGT-A helps to reduce miscarriages and improve implantation rates.
In vitro fertilization test market is expected to reach a valuation of ~US$ 3 Bn by 2031
In vitro fertilization test market is projected to expand at a CAGR of ~6% from 2021 to 2031
In vitro fertilization test market is driven by increase in population with infertility issues and inclination toward delayed pregnancies
The preimplantation genetic testing (PGD) segment is expected to dominate the global in vitro fertilization test market from 2021 to 2031
Key players in the global in vitro fertilization test market include CooperSurgical, Inc., Esco Micro Pte Ltd., FUJIFILM Irvine Scientific, Hamilton Thorne, Inc., Vitrolife AB, IVFtech ApS
1. Preface
1.1. Market Definition and Scope
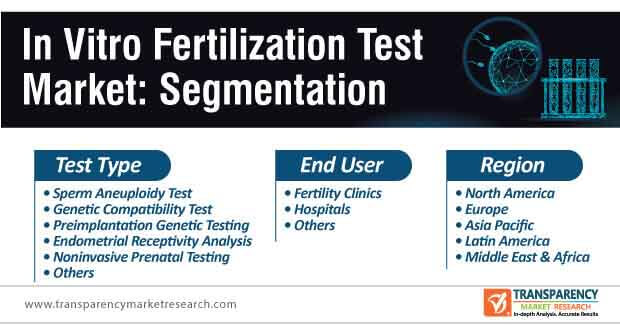
1.2. Market Segmentation
1.3. Key Research Objectives
1.4. Research Highlights
2. Assumptions and Research Methodology
3. Executive Summary: Global In Vitro Fertilization Test Market
4. Market Overview
4.1. Introduction
4.1.1. Market Introduction
4.1.2. Industry Evolution / Developments
4.2. Overview
4.3. Market Dynamics
4.3.1. Drivers
4.3.2. Restraints
4.3.3. Opportunities
4.4. Global In Vitro Fertilization Test Market Analysis and Forecast, 2017–2031
4.4.1. Market Revenue Projections (US$ Mn)
5. Key Insights
5.1. Key Mergers & Acquisitions
5.2. COVID-19 Pandemics Impact on Industry (Value Chain and Short / Mid /Long Term Impact)
5.3. Regulatory Scenario by Region/globally
5.4. Top 3 players operating in the market space
5.5. Key product/brand Analysis
6. Global In Vitro Fertilization Test Market Analysis and Forecast, by Test Type
6.1. Introduction & Definition
6.2. Key Findings / Developments
6.3. Market Value Forecast, by Test Type, 2017–2031
6.3.1. Sperm Aneuploidy Test
6.3.2. Genetic Compatibility Test
6.3.3. Preimplantation Genetic Testing
6.3.4. Endometrial Receptivity Analysis
6.3.5. Noninvasive Prenatal Testing
6.3.6. Others
6.4. Market Attractiveness Analysis, by Test Type
7. Global In Vitro Fertilization Test Market Analysis and Forecast, by End-user
7.1. Introduction & Definition
7.2. Key Findings / Developments
7.3. Market Value Forecast, by End-user, 2017–2031
7.3.1. Fertility Clinics
7.3.2. Hospitals
7.3.3. Others
7.4. Market Attractiveness Analysis, by End-user
8. Global In Vitro Fertilization Test Market Analysis and Forecast, by Region
8.1. Key Findings
8.2. Market Value Forecast by Region
8.2.1. North America
8.2.2. Europe
8.2.3. Asia Pacific
8.2.4. Latin America
8.2.5. Middle East & Africa
8.3. Market Attractiveness Analysis, by Country/Region
9. North America In Vitro Fertilization Test Market Analysis and Forecast
9.1. Introduction
9.1.1. Key Findings
9.2. Market Value Forecast, by Test Type, 2017–2031
9.2.1. Sperm Aneuploidy Test
9.2.2. Genetic Compatibility Test
9.2.3. Preimplantation Genetic Testing
9.2.4. Endometrial Receptivity Analysis
9.2.5. Noninvasive Prenatal Testing
9.2.6. Others
9.3. Market Value Forecast, by End-user, 2017–2031
9.3.1. Fertility Clinics
9.3.2. Hospitals
9.3.3. Others
9.4. Market Value Forecast, by Country, 2017–2031
9.4.1. U.S.
9.4.2. Canada
9.5. Market Attractiveness Analysis
9.5.1. By Test Type
9.5.2. By End-user
9.5.3. By Country
10. Europe In Vitro Fertilization Test Market Analysis and Forecast
10.1. Introduction
10.1.1. Key Findings
10.2. Market Value Forecast, by Test Type, 2017–2031
10.2.1. Sperm Aneuploidy Test
10.2.2. Genetic Compatibility Test
10.2.3. Preimplantation Genetic Testing
10.2.4. Endometrial Receptivity Analysis
10.2.5. Noninvasive Prenatal Testing
10.2.6. Others
10.3. Market Value Forecast, by End-user, 2017–2031
10.3.1. Fertility Clinics
10.3.2. Hospitals
10.3.3. Others
10.4. Market Value Forecast, by Country/Sub-region, 2017–2031
10.4.1. Germany
10.4.2. U.K.
10.4.3. France
10.4.4. Spain
10.4.5. Italy
10.4.6. Rest of Europe
10.5. Market Attractiveness Analysis
10.5.1. By Test Type
10.5.2. By End-user
10.5.3. By Country/Sub-region
11. Asia Pacific In Vitro Fertilization Test Market Analysis and Forecast
11.1. Introduction
11.1.1. Key Findings
11.2. Market Value Forecast, by Test Type, 2017–2031
11.2.1. Sperm Aneuploidy Test
11.2.2. Genetic Compatibility Test
11.2.3. Preimplantation Genetic Testing
11.2.4. Endometrial Receptivity Analysis
11.2.5. Noninvasive Prenatal Testing
11.2.6. Others
11.3. Market Value Forecast, by End-user, 2017–2031
11.3.1. Fertility Clinics
11.3.2. Hospitals
11.3.3. Others
11.4. Market Value Forecast, by Country/Sub-region, 2017–2031
11.4.1. China
11.4.2. Japan
11.4.3. India
11.4.4. Australia & New Zealand
11.4.5. Rest of Asia Pacific
11.5. Market Attractiveness Analysis
11.5.1. By Test Type
11.5.2. By End-user
11.5.3. By Country/Sub-region
12. Latin America In Vitro Fertilization Test Market Analysis and Forecast
12.1. Introduction
12.1.1. Key Findings
12.2. Market Value Forecast, by Test Type, 2017–2031
12.2.1. Sperm Aneuploidy Test
12.2.2. Genetic Compatibility Test
12.2.3. Preimplantation Genetic Testing
12.2.4. Endometrial Receptivity Analysis
12.2.5. Noninvasive Prenatal Testing
12.2.6. Others
12.3. Market Value Forecast, by End-user, 2017–2031
12.3.1. Fertility Clinics
12.3.2. Hospitals
12.3.3. Others
12.4. Market Value Forecast, by Country/Sub-region, 2017–2031
12.4.1. Brazil
12.4.2. Mexico
12.4.3. Rest of Latin America
12.5. Market Attractiveness Analysis
12.5.1. By Test Type
12.5.2. By End-user
12.5.3. By Country/Sub-region
13. Middle East & Africa In Vitro Fertilization Test Market Analysis and Forecast
13.1. Introduction
13.1.1. Key Findings
13.2. Market Value Forecast, by Test Type, 2017–2031
13.2.1. Sperm Aneuploidy Test
13.2.2. Genetic Compatibility Test
13.2.3. Preimplantation Genetic Testing
13.2.4. Endometrial Receptivity Analysis
13.2.5. Noninvasive Prenatal Testing
13.2.6. Others
13.3. Market Value Forecast, by End-user, 2017–2031
13.3.1. Fertility Clinics
13.3.2. Hospitals
13.3.3. Others
13.4. Market Value Forecast, by Country/Sub-region, 2017–2031
13.4.1. GCC Countries
13.4.2. South Africa
13.4.3. Rest of Middle East & Africa
13.5. Market Attractiveness Analysis
13.5.1. By Test Type
13.5.2. By End-user
13.5.3. By Country/Sub-region
14. Competition Landscape
14.1. Market Player - Competition Matrix (by Tier and Size of companies)
14.2. Market Share Analysis, by Company, 2020
14.3. Company Profiles
14.3.1. CooperSurgical, Inc.
14.3.1.1. Company Overview (HQ, Business Segments, Employee Strength)
14.3.1.2. Growth Strategies
14.3.1.3. SWOT Analysis
14.3.2. Esco Micro Pte Ltd.
14.3.2.1. Company Overview (HQ, Business Segments, Employee Strength)
14.3.2.2. Growth Strategies
14.3.2.3. SWOT Analysis
14.3.3. FUJIFILM Irvine Scientific
14.3.3.1. Company Overview (HQ, Business Segments, Employee Strength)
14.3.3.2. Growth Strategies
14.3.3.3. SWOT Analysis
14.3.4. Hamilton Thorne, Inc.
14.3.4.1. Company Overview (HQ, Business Segments, Employee Strength)
14.3.4.2. Growth Strategies
14.3.4.3. SWOT Analysis
14.3.5. Vitrolife AB
14.3.5.1. Company Overview (HQ, Business Segments, Employee Strength)
14.3.5.2. Growth Strategies
14.3.5.3. SWOT Analysis
14.3.6. IVFtech ApS
14.3.6.1. Company Overview (HQ, Business Segments, Employee Strength)
14.3.6.2. Growth Strategies
14.3.6.3. SWOT Analysis
14.3.7. Nidacon International AB
14.3.7.1. Company Overview (HQ, Business Segments, Employee Strength)
14.3.7.2. Growth Strategies
14.3.7.3. SWOT Analysis
14.3.8. Igenomix
14.3.8.1. Company Overview (HQ, Business Segments, Employee Strength)
14.3.8.2. Growth Strategies
14.3.8.3. SWOT Analysis
14.3.9. Thermo Fisher Scientific
14.3.9.1. Company Overview (HQ, Business Segments, Employee Strength)
14.3.9.2. Growth Strategies
14.3.9.3. SWOT Analysis
14.3.10. Cook
14.3.10.1. Company Overview (HQ, Business Segments, Employee Strength)
14.3.10.2. Growth Strategies
14.3.10.3. SWOT Analysis
14.3.11. Genea Biomedx
14.3.11.1. Company Overview (HQ, Business Segments, Employee Strength)
14.3.11.2. Growth Strategies
14.3.11.3. SWOT Analysis
14.3.12. FertiPro N.V
14.3.12.1. Company Overview (HQ, Business Segments, Employee Strength)
14.3.12.2. Growth Strategies
14.3.12.3. SWOT Analysis
14.3.13. Kitazato Corporation
14.3.13.1. Company Overview (HQ, Business Segments, Employee Strength)
14.3.13.2. Growth Strategies
14.3.13.3. SWOT Analysis
14.3.14. PerkinElmer, Inc.
14.3.14.1. Company Overview (HQ, Business Segments, Employee Strength)
14.3.14.2. Growth Strategies
14.3.14.3. SWOT Analysis
14.3.15. Natera
14.3.15.1. Company Overview (HQ, Business Segments, Employee Strength)
14.3.15.2. Growth Strategies
14.3.15.3. SWOT Analysis
14.3.16. Takara Bio, Inc.
14.3.16.1. Company Overview (HQ, Business Segments, Employee Strength)
14.3.16.2. Growth Strategies
14.3.16.3. SWOT Analysis
14.3.17. iGLS
14.3.17.1. Company Overview (HQ, Business Segments, Employee Strength)
14.3.17.2. Growth Strategies
14.3.17.3. SWOT Analysis
14.3.18. CiceroDx
14.3.18.1. Company Overview (HQ, Business Segments, Employee Strength)
14.3.18.2. Growth Strategies
14.3.18.3. SWOT Analysis
List of Tables
Table 01: Global In Vitro Fertilization Test Market Value (US$ Mn) Forecast, by Test Type, 2017–2031
Table 02: Global In Vitro Fertilization Test Market Value (US$ Mn) Forecast, by End-user, 2017–2031
Table 03: Global In Vitro Fertilization Test Market Value (US$ Mn) Forecast, by Region, 2017–2031
Table 04: North America In Vitro Fertilization Test Market Value (US$ Mn) Forecast, by Country, 2017–2031
Table 05: North America In Vitro Fertilization Test Market Value (US$ Mn) Forecast, by Test Type, 2017–2031
Table 06: North America In Vitro Fertilization Test Market Value (US$ Mn) Forecast, by End-user, 2017–2031
Table 07: Europe In Vitro Fertilization Test Market Value (US$ Mn) Forecast, by Country/Sub-region, 2017–2031
Table 08: Europe In Vitro Fertilization Test Market Value (US$ Mn) Forecast, by Test Type, 2017–2031
Table 09: Europe In Vitro Fertilization Test Market Value (US$ Mn) Forecast, by End-user, 2017–2031
Table 10: Asia Pacific In Vitro Fertilization Test Market Value (US$ Mn) Forecast, by Country/Sub-region, 2017–2031
Table 11: Asia Pacific In Vitro Fertilization Test Market Value (US$ Mn) Forecast, by Test Type, 2017–2031
Table 12: Asia Pacific In Vitro Fertilization Test Market Value (US$ Mn) Forecast, by End-user, 2017–2031
Table 13: Latin America In Vitro Fertilization Test Market Value (US$ Mn) Forecast, by Country/Sub-Region, 2017–2031
Table 14: Latin America In Vitro Fertilization Test Market Value (US$ Mn) Forecast, by Test Type, 2017–2031
Table 15: Latin America In Vitro Fertilization Test Market Value (US$ Mn) Forecast, by End-user, 2017–2031
Table 16: Middle East & Africa In Vitro Fertilization Test Market Value (US$ Mn) Forecast, by Country/Sub-region, 2017–2031
Table 17: Middle East & Africa In Vitro Fertilization Test Market Value (US$ Mn) Forecast, by Test Type, 2017–2031
Table 18: Middle East & Africa In Vitro Fertilization Test Market Value (US$ Mn) Forecast, by End-user, 2017–2031
List of Figures
Figure 01: Global In-vitro Fertilization Test Market Value (US$ Mn) Forecast, 2017–2031
Figure 02: Global In-vitro Fertilization Test Market Value Share, by Test Type, 2020
Figure 03: Global In-vitro Fertilization Test Market Value Share, by End-user, 2020
Figure 04: Global In-vitro Fertilization Test Market Value Share, by Region, 2020
Figure 05: Global In Vitro Fertilization Test Market Value Share Analysis, by Test Type, 2020 and 2031
Figure 06: Global In Vitro Fertilization Test Market Attractiveness Analysis, by Test Type, 2021–2031
Figure 07: Global In Vitro Fertilization Test Market Value (US$ Mn), by Sperm Aneuploidy Test, 2017–2031
Figure 08: Global In Vitro Fertilization Test Market Value (US$ Mn), by Genetic Compatibility Test, 2017–2031
Figure 09: Global In Vitro Fertilization Test Market Value (US$ Mn), by Preimplantation Genetic Testing, 2017–2031
Figure 10: Global In Vitro Fertilization Test Market Value (US$ Mn), by Endometrial Receptivity Analysis, 2017–2031
Figure 11: Global In Vitro Fertilization Test Market Value (US$ Mn), by Noninvasive Prenatal Testing, 2017–2031
Figure 12: Global In Vitro Fertilization Test Market Value (US$ Mn), by Others, 2017–2031
Figure 13: Global In Vitro Fertilization Test Market Value Share Analysis, by End-user, 2020 and 2031
Figure 14: Global In Vitro Fertilization Test Market Attractiveness Analysis, by End-user, 2021–2031
Figure 15: Global In Vitro Fertilization Test Market Value (US$ Mn), by Fertility Clinics, 2017–2031
Figure 16: Global In Vitro Fertilization Test Market Value (US$ Mn), by Hospitals, 2017–2031
Figure 17: Global In Vitro Fertilization Test Market Value (US$ Mn), by Others, 2017–2031
Figure 18: Global In Vitro Fertilization Test Market Value Share Analysis, by Region, 2020 and 2031
Figure 19: Global In Vitro Fertilization Test Market Attractiveness Analysis, by Region, 2021–2031
Figure 20: North America In Vitro Fertilization Test Market Value (US$ Mn) Forecast, 2017–2031
Figure 21: North America In Vitro Fertilization Test Market Value Share Analysis, by Country, 2020 and 2031
Figure 22: North America In Vitro Fertilization Test Market Attractiveness Analysis, by Country, 2021–2031
Figure 23: North America In Vitro Fertilization Test Market Value Share Analysis, by Test Type, 2020 and 2031
Figure 24: North America In Vitro Fertilization Test Market Attractiveness Analysis, by Test Type, 2021–2031
Figure 25: North America In Vitro Fertilization Test Market Value Share Analysis, by End-user, 2020 and 2031
Figure 26: North America In Vitro Fertilization Test Market Attractiveness Analysis, by End-user, 2021–2031
Figure 27: Europe In Vitro Fertilization Test Market Value (US$ Mn) Forecast, 2017–2031
Figure 28: Europe In Vitro Fertilization Test Market Value Share Analysis, by Country/Sub-region, 2020 and 2031
Figure 29: Europe In Vitro Fertilization Test Market Attractiveness Analysis, by Country/Sub-region, 2021–2031
Figure 30: Europe In Vitro Fertilization Test Market Value Share Analysis, by Test Type, 2020 and 2031
Figure 31: Europe In Vitro Fertilization Test Market Attractiveness Analysis, by Test Type, 2021–2031
Figure 32: Europe In Vitro Fertilization Test Market Value Share Analysis, by End-user, 2020 and 2031
Figure 33: Europe In Vitro Fertilization Test Market Attractiveness Analysis, by End-user, 2021–2031
Figure 34: Asia Pacific In Vitro Fertilization Test Market Value (US$ Mn) Forecast, 2017–2031
Figure 35: Asia Pacific In Vitro Fertilization Test Market Value Share Analysis, by Country/Sub-region, 2020 and 2031
Figure 36: Asia Pacific In Vitro Fertilization Test Market Attractiveness Analysis, by Country/Sub-region, 2021–2031
Figure 37: Asia Pacific In Vitro Fertilization Test Market Value Share Analysis, by Test Type, 2020 and 2031
Figure 38: Asia Pacific In Vitro Fertilization Test Market Attractiveness Analysis, by Test Type, 2021–2031
Figure 39: Asia Pacific In Vitro Fertilization Test Market Value Share Analysis, by End-user, 2020 and 2031
Figure 40: Asia Pacific In Vitro Fertilization Test Market Attractiveness Analysis, by End-user, 2021–2031
Figure 41: Latin America In Vitro Fertilization Test Market Value (US$ Mn) Forecast, 2017–2031
Figure 42: Latin America In Vitro Fertilization Test Market Value Share Analysis, by Country/Sub-region, 2020 and 2031
Figure 43: Latin America In Vitro Fertilization Test Market Attractiveness Analysis, by Country/Sub-region, 2021–2031
Figure 44: Latin America In Vitro Fertilization Test Market Value Share Analysis, by Test Type, 2020 and 2031
Figure 45: Latin America In Vitro Fertilization Test Market Attractiveness Analysis, by Test Type, 2021–2031
Figure 46: Latin America In Vitro Fertilization Test Market Value Share Analysis, by End-user, 2020 and 2031
Figure 47: Latin America In Vitro Fertilization Test Market Attractiveness Analysis, by End-user, 2021–2031
Figure 48: Middle East & Africa In Vitro Fertilization Test Market Value (US$ Mn) Forecast, 2017–2031
Figure 49: Middle East & Africa In Vitro Fertilization Test Market Value Share Analysis, by Country/Sub-region, 2020 and 2031
Figure 50: Middle East & Africa In Vitro Fertilization Test Market Attractiveness Analysis, by Country/Sub-region, 2021–2031
Figure 51: Middle East & Africa In Vitro Fertilization Test Market Value Share Analysis, by Test Type, 2020 and 2031
Figure 52: Middle East & Africa In Vitro Fertilization Test Market Attractiveness Analysis, by Test Type, 2021–2031
Figure 53: Middle East & Africa In Vitro Fertilization Test Market Value Share Analysis, by End-user, 2020 and 2031
Figure 54: Middle East & Africa In Vitro Fertilization Test Market Attractiveness Analysis, by End-user, 2021–2031
Figure 55: Global In Vitro Fertilization Test Market: Company Share Analysis, 2020
Figure 56: CooperSurgical, Inc. Revenue (US$ Mn) and Y-o-Y Growth (%), 2017–2020
Figure 57: CooperSurgical, Inc. Breakdown of Net Sales (%), by Region/Country, 2020
Figure 58: CooperSurgical, Inc. Breakdown of Net Sales (%), by Business Segment, 2020
Figure 59: CooperSurgical, Inc. R&D Expenses (US$ Mn) Y-o-Y Growth (%), 2017–2020
Figure 60: FUJIFILM Holding Corporation Revenue (US$ Mn) and Y-o-Y Growth (%), 2018–2020
Figure 61: FUJIFILM Holding Corporation Revenue Breakdown of Net Sales (%), by Business Segment, 2020
Figure 62: FUJIFILM Holding Corporation R&D Expenses (US$ Mn) and Y-o-Y Growth (%), 2017–2020
Figure 63: Hamilton Thorne, Inc. Revenue (US$ Mn) and Y-o-Y Growth (%), 2018–2020
Figure 64: Hamilton Thorne, Inc. Breakdown of Net Sales (%), by Business Segment, 2020
Figure 65: Hamilton Thorne, Inc. R&D Expenses (US$ Mn) and Y-o-Y Growth (%), 2018–2020
Figure 66: Vitrolife AB Revenue (US$ Mn) and Y-o-Y Growth (%), 2017–2020
Figure 67: Vitrolife AB Breakdown of Net Sales (%), by Region/Country, 2020
Figure 68: Vitrolife AB Breakdown of Net Sales (%), by Business Segment, 2020
Figure 69: Thermo Fisher Scientific Revenue (US$ Mn) and Y-o-Y Growth (%), 2017–2020
Figure 70: Thermo Fisher Scientific Breakdown of Net Sales (%), by Region/Country, 2020
Figure 71: Thermo Fisher Scientific Breakdown of Net Sales (%), by Business Segment, 2020
Figure 72: Thermo Fisher Scientific R&D Expenses (US$ Mn) and Y-o-Y Growth (%), 2017–2020
Figure 73: PerkinElmer, Inc. Revenue (US$ Mn) and Y-o-Y Growth (%), 2017–2020
Figure 74: PerkinElmer, Inc. Breakdown of Net Sales (%), by Region/Country, 2020
Figure 75: PerkinElmer, Inc. Breakdown of Net Sales (%), by Business Segment, 2020
Figure 76: PerkinElmer, Inc. R&D Expenses (US$ Mn) and Y-o-Y Growth (%), 2018–2020
Figure 77: Natera Revenue (US$ Mn) and Y-o-Y Growth (%), 2017–2020
Figure 78: Natera Breakdown of Net Sales (%), by Region/Country, 2020
Figure 79: Natera R&D Expenses (US$ Mn) and Y-o-Y Growth (%), 2018–2020
Figure 80: Takara Bio, Inc. Revenue (US$ Mn) and Y-o-Y Growth (%), 2017–2020
Figure 81: Takara Bio, Inc. Breakdown of Net Sales (%), by Region/Country, 2020
Figure 82: Takara Bio, Inc. Breakdown of Net Sales (%), by Business Segment, 2020
Figure 83: Takara Bio, Inc. R&D Expenses (US$ Mn) and Y-o-Y Growth (%), 2018–2020
Copyright © Transparency Market Research, Inc. All Rights reserved
Trust Online

In Vitro Fertilization Test Market
