The rising demand for effective monitoring of manufacturing plants across industry verticals such as oil and gas as well as mining is one of the most significant growth drivers for the expansion of the global human machine interface (HMI) market over the forecast period of 2016 to 2024. Furthermore, the increase in the demand for smart technological solutions in manufacturing industry as well as the rising utilization of industrial automation are also likely to foster the development trajectory of the global human machine interface (HMI) market in coming years. On the other hand, lack of standardization as well as rising concerns pertaining to safety and security may restrain the growth within the global human machine interface (HMI) market in coming years.
However, the rising adoption of HMI terminals in manufacturing sector, intended for efficient plant management may drive the growth in the industry in coming years. The business intelligence study on the global human machine interface (HMI) market predicts that the global human machine interface (HMI) market will expand at a substantial growth rate of 2.50 % over the forecast years i.e. 2016 to 2024. It also projects that the global human machine interface (HMI) market will grow from its initial evaluation of US$ 3.9 billion in 2015 to cross the mark of US$ 11 billion by the end of the forecast period in 2024. One of the major drivers for the global human machine interface (HMI) market is the rising need for convenient machine communication in various end use industries.
Types of products and solutions offered by the vendors and players operational within the global human machine interface (HMI) market include software, services, and hardware (including processor or computer, display, and others, such as keypad, joystick, and indicator). The sturdiness as well as efficiency provided by the hardware products in the global human machine interface (HMI) market is causing increased demand for this segment in the industry. The hardware segment is predicted to dominate the global human machine interface (HMI) market in coming years.
Some of the most prominent end use industry verticals that use the solutions offered by the players in the global human machine interface (HMI) market include automotive, oil and gas, food and beverage, metal and mining, transportation, healthcare and pharmaceutical, manufacturing, packaging, defense and aerospace, and retail, among others. The manufacturing end use industry accounted for highest demand within the global human machine interface (HMI) market in recent past and the same trend is anticipated to withstand during the forecast years.
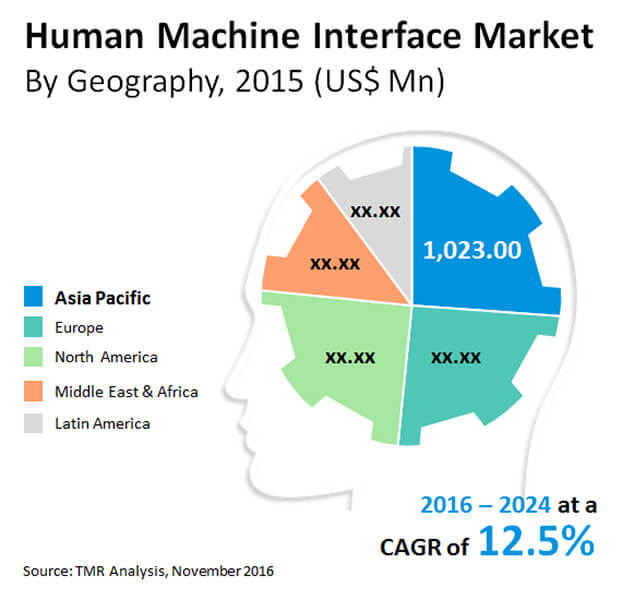
Key regions covered within the professional survey report on the global human machine interface (HMI) market include Europe, Middle East and Africa, North America, South America, and Asia Pacific. The continuous rise in the production activities in Asian economies, such as Japan, India, and China is paving the way for considerable development of the global human machine interface (HMI) market in Asia Pacific region in coming years. Furthermore, another major driving factor influencing the growth in global human machine interface (HMI) market in Asia Pacific is the increasing regional population as well as the rise in their disposable income.
Few of the leading players and vendors functional within the global human machine interface (HMI) market include Danaher Corp., Schneider Electric SE, Beijer Electronics Inc., American Industrial Systems Inc., Rockwell Automation Inc., Gefran SPA, EAO AG, ABB Ltd., Siemens AG, Atmel Corp., Omron Corp., Yokoawa Electric Corp., Emerson Electric Corp., Advantech Co. Ltd., Elektrobit Corp., General Electric Co., Bartec GmbH, Honeywell International Inc., and Eaton Corp., among others.
Chapter 1 Preface
1.1 Market Definition and Scope
1.2 Market Segmentation
1.3 Key Research Objectives
1.4 Research Highlights
Chapter 2 Assumptions and Research Methodology
Chapter 3 Executive Summary: Human Machine Interface (HMI) Market
Chapter 4 Market Overview
4.1 Introduction
4.1.1 Definition
4.1.2 Industry Evolution / Developments
4.2 Market Dynamics
4.2.1 Drivers
4.2.2 Restraint
4.2.3 Opportunity
4.3 Global Human Machine Interface (HMI) Market Analysis and Forecasts, 2011 – 2024
4.3.1 Market Revenue Projections (US$ Mn)
4.4 Porter’s Five Force Analysis
4.5 Value Chain Analysis
4.5.1 List of Active Market Participants (suppliers/distributors/manufacturers/vendors)
4.5.2 Forward – Backward Integration Scenario
4.6 Market Outlook
Chapter 5 Global Human Machine Interface (HMI) Market Analysis and Forecasts, By Type
5.1 Introduction & Definition
5.2 Key Findings / Developments
5.3 Key Trends
5.4 Market Size (US$ Mn) Forecast, By Type
5.4.1 Hardware, 2014 – 2024 (US$ Mn)
5.4.1.1 Display, 2014 – 2024 (US$ Mn)
5.4.1.2 Processor/Computer, 2014 – 2024 (US$ Mn)
5.4.1.3 Others (Joystick and Keypad, 2014 – 2024 (US$ Mn)
5.4.2 Software, 2014 – 2024 (US$ Mn)
5.4.3 Services, 2014 – 2024 (US$ Mn)
5.5 Comparison Matrix
5.6 Market Attractiveness By Type
Chapter 6 Global Human Machine Interface (HMI) Market Analysis and Forecasts, By End-use Industry
6.1 Introduction & Definition
6.2 Key Findings / Developments
6.3 Key Trends
6.4 Global Human Machine Interface Market Size (US$ Mn) Forecast, By End-use Industry
6.4.1 Healthcare, 2014 – 2024 (US$ Mn)
6.4.2 Automotive, 2014 – 2024 (US$ Mn)
6.4.3 Manufacturing, 2014 – 2024 (US$ Mn)
6.4.4 Oil & Gas, 2014 – 2024 (US$ Mn)
6.4.5 Packaging, 2014 – 2024 (US$ Mn)
6.4.6 Food & Beverage, 2014 – 2024 (US$ Mn)
6.4.7 Metal and Mining, 2014 – 2024 (US$ Mn)
6.4.8 Defense and Aerospace, 2014 – 2024 (US$ Mn)
6.4.9 Others, 2014 – 2024 (US$ Mn)
6.5 Comparison Matrix
6.6 Market Attractiveness By End-use Industry
Chapter 7 Global Human Machine Interface (HMI) Market Analysis and Forecasts, By Region
7.1 Key Findings
7.2 Policies and Regulations
7.3 Global Human Machine Interface Market Size (US$ Mn) Forecast, By Region, 2014 – 2024
7.3.1 North America
7.3.2 Europe
7.3.3 Asia Pacific
7.3.4 Middle East and Africa (MEA)
7.3.5 South America
7.4 Market Attractiveness By Country/ Region
Chapter 8 North America Human Machine Interface (HMI) Market Analysis and Forecast
8.1 Key Findings
8.2 Key Trends
8.3 Market Size (US$ Mn) Forecast, By Type
8.3.1 Hardware
8.3.1.1 Display
8.3.1.2 Processor/Computer
8.3.1.3 Others (Joystick and Keypad)
8.3.2 Software
8.3.3 Services
8.4 Market Size (US$ Mn) Forecast, By End-use Industry
8.4.1 Healthcare, 2014 – 2024 (US$ Mn)
8.4.2 Automotive, 2014 – 2024 (US$ Mn)
8.4.3 Manufacturing, 2014 – 2024 (US$ Mn)
8.4.4 Oil & Gas, 2014 – 2024 (US$ Mn)
8.4.5 Packaging, 2014 – 2024 (US$ Mn)
8.4.6 Food & Beverage, 2014 – 2024 (US$ Mn)
8.4.7 Metal and Mining, 2014 – 2024 (US$ Mn)
8.4.8 Defence and Aerospace, 2014 – 2024 (US$ Mn)
8.4.9 Others, 2014 – 2024 (US$ Mn)
8.5 Market Size (US$ Mn) and Forecast By Country, 2014 – 2024
8.5.1 The U.S.
8.5.2 Rest of North America
8.6 Market Attractiveness Analysis
8.6.1 By Country
8.6.2 By Type
8.6.3 By End-use Industry
Chapter 9 Europe Human Machine Interface (HMI) Market Analysis and Forecast
9.1 Key Findings
9.2 Key Trends
9.3 Market Size (US$ Mn) Forecast, By Type
9.3.1 Hardware
9.3.1.1 Display
9.3.1.2 Processor/Computer
9.3.1.3 Others (Joystick and Keypad)
9.3.2 Software
9.3.3 Services
9.4 Market Size (US$ Mn) Forecast, By End-use Industry
9.4.1 Healthcare, 2014 – 2024 (US$ Mn)
9.4.2 Automotive, 2014 – 2024 (US$ Mn)
9.4.3 Manufacturing, 2014 – 2024 (US$ Mn)
9.4.4 Oil & Gas, 2014 – 2024 (US$ Mn)
9.4.5 Packaging, 2014 – 2024 (US$ Mn)
9.4.6 Food & Beverage, 2014 – 2024 (US$ Mn)
9.4.7 Metal and Mining, 2014 – 2024 (US$ Mn)
9.4.8 Defence and Aerospace, 2014 – 2024 (US$ Mn)
9.4.9 Others, 2014 – 2024 (US$ Mn)
9.5 Market Size (US$ Mn) and Forecast By Country, 2014 – 2024v
9.5.1 The U.S.
9.5.2 Rest of North America
9.6 Market Attractiveness Analysis
9.6.1 By Country
9.6.2 By Type
9.6.3 By End-use Industry
Chapter 10 Asia Pacific Human Machine Interface (HMI) Market Analysis and Forecast
10.1 Key Findings
10.2 Key Trends
10.3 Market Size (US$ Mn) Forecast, By Type
10.3.1 Hardware
10.3.1.1 Display
10.3.1.2 Processor/Computer
10.3.1.3 Others (Joystick and Keypad)
10.3.2 Software
10.3.3 Services
10.4 Market Size (US$ Mn) Forecast, By End-use Industry
10.4.1 Healthcare, 2014 – 2024 (US$ Mn)
10.4.2 Automotive, 2014 – 2024 (US$ Mn)
10.4.3 Manufacturing, 2014 – 2024 (US$ Mn)
10.4.4 Oil & Gas, 2014 – 2024 (US$ Mn)
10.4.5 Packaging, 2014 – 2024 (US$ Mn)
10.4.6 Food & Beverage, 2014 – 2024 (US$ Mn)
10.4.7 Metal and Mining, 2014 – 2024 (US$ Mn)
10.4.8 Defence and Aerospace, 2014 – 2024 (US$ Mn)
10.4.9 Others, 2014 – 2024 (US$ Mn)
10.5 Market Size (US$ Mn) and Forecast By Country, 2014 – 2024
10.5.1 The U.S.
10.5.2 Rest of North America
10.6 Market Attractiveness Analysis
10.6.1 By Country
10.6.2 By Type
10.6.3 By End-use Industry
Chapter 11 Middle East and Africa (MEA) Human Machine Interface (HMI) Market Analysis and Forecast
11.1 Key Findings
11.2 Key Trends
11.3 Market Size (US$ Mn) Forecast, By Type
11.3.1 Hardware
11.3.1.1 Display
11.3.1.2 Processor/Computer
11.3.1.3 Others (Joystick and Keypad)
11.3.2 Software
11.3.3 Services
11.4 Market Size (US$ Mn) Forecast, By End-use Industry
11.4.1 Healthcare, 2014 – 2024 (US$ Mn)
11.4.2 Automotive, 2014 – 2024 (US$ Mn)
11.4.3 Manufacturing, 2014 – 2024 (US$ Mn)
11.4.4 Oil & Gas, 2014 – 2024 (US$ Mn)
11.4.5 Packaging, 2014 – 2024 (US$ Mn)
11.4.6 Food & Beverage, 2014 – 2024 (US$ Mn)
11.4.7 Metal and Mining, 2014 – 2024 (US$ Mn)
11.4.8 Defence and Aerospace, 2014 – 2024 (US$ Mn)
11.4.9 Others, 2014 – 2024 (US$ Mn)
11.5 Market Size (US$ Mn) and Forecast By Country, 2014 – 2024
11.5.1 The U.S.
11.5.2 Rest of North America
11.6 Market Attractiveness Analysis
11.6.1 By Country
11.6.2 By Type
11.6.3 By End-use Industry
Chapter 12 South America Human Machine Interface (HMI) Market Analysis and Forecast
12.1 Key Findings
12.2 Key Trends
12.3 Market Size (US$ Mn) Forecast, By Type
12.3.1 Hardware
12.3.1.1 Display
12.3.1.2 Processor/Computer
12.3.1.3 Others (Joystick and Keypad)
12.3.2 Software
12.3.3 Services
12.4 Market Size (US$ Mn) Forecast, By End-use Industry
12.4.1 Healthcare, 2014 – 2024 (US$ Mn)
12.4.2 Automotive, 2014 – 2024 (US$ Mn)
12.4.3 Manufacturing, 2014 – 2024 (US$ Mn)
12.4.4 Oil & Gas, 2014 – 2024 (US$ Mn)
12.4.5 Packaging, 2014 – 2024 (US$ Mn)
12.4.6 Food & Beverage, 2014 – 2024 (US$ Mn)
12.4.7 Metal and Mining, 2014 – 2024 (US$ Mn)
12.4.8 Defence and Aerospace, 2014 – 2024 (US$ Mn)
12.4.9 Others, 2014 – 2024 (US$ Mn)
12.5 Market Size (US$ Mn) and Forecast By Country, 2014 – 2024
12.5.1 The U.S.
12.5.2 Rest of North America
12.6 Market Attractiveness Analysis
12.6.1 By Country
12.6.2 By Type
12.6.3 By End-use Industry
Chapter 13 Competition Landscape
13.1 Market Player – Competition Matrix
13.2 Market Share Analysis By Company (2015)
13.3 Company Profiles (Details – Overview, Financials, Recent Developments, Strategy)
13.3.1 Atmel Corporation
13.3.1.1 Company Details (HQ, Foundation Year, Revenue, Employee Strength)
13.3.1.2 Market Presence, By Component Segmentation
13.3.1.3 SWOT Analysis
13.3.1.4 Strategic Overview
13.3.2 Siemens AG
13.3.2.1 Company Details (HQ, Foundation Year, Revenue, Employee Strength)
13.3.2.2 Market Presence, By Component Segmentation
13.3.2.3 SWOT Analysis
13.3.2.4 Strategic Overview
13.3.3 Eaton Corporation
13.3.3.1 Company Details (HQ, Foundation Year, Revenue, Employee Strength)
13.3.3.2 Market Presence, By Component Segmentation
13.3.3.3 SWOT Analysis
13.3.3.4 Strategic Overview
13.3.4 ABB Ltd.
13.3.4.1 Company Details (HQ, Foundation Year, Revenue, Employee Strength)
13.3.4.2 Market Presence, By Component Segmentation
13.3.4.3 SWOT Analysis
13.3.4.4 Strategic Overview
13.3.5 Honeywell International Inc.
13.3.5.1 Company Details (HQ, Foundation Year, Revenue, Employee Strength)
13.3.5.2 Market Presence, By Component Segmentation
13.3.5.3 SWOT Analysis
13.3.5.4 Strategic Overview
13.3.6 EAO AG
13.3.6.1 Company Details (HQ, Foundation Year, Revenue, Employee Strength)
13.3.6.2 Market Presence, By Component Segmentation
13.3.6.3 SWOT Analysis
13.3.6.4 Strategic Overview
13.3.7 Bartec GmbH
13.3.7.1 Company Details (HQ, Foundation Year, Revenue, Employee Strength)
13.3.7.2 Market Presence, By Component Segmentation
13.3.7.3 SWOT Analysis
13.3.7.4 Strategic Overview
13.3.8 Gefran SPA
13.3.8.1 Company Details (HQ, Foundation Year, Revenue, Employee Strength)
13.3.8.2 Market Presence, By Component Segmentation
13.3.8.3 SWOT Analysis
13.3.8.4 Strategic Overview
13.3.9 General Electric Co.
13.3.9.1 Company Details (HQ, Foundation Year, Revenue, Employee Strength)
13.3.9.2 Market Presence, By Component Segmentation
13.3.9.3 SWOT Analysis
13.3.9.4 Strategic Overview
13.3.10 Rockwell Automation, Inc.
13.3.10.1 Company Details (HQ, Foundation Year, Revenue, Employee Strength)
13.3.10.2 Market Presence, By Component Segmentation
13.3.10.3 SWOT Analysis
13.3.10.4 Strategic Overview
13.3.11 Elektrobit Corporation
13.3.11.1 Company Details (HQ, Foundation Year, Revenue, Employee Strength)
13.3.11.2 Market Presence, By Component Segmentation
13.3.11.3 SWOT Analysis
13.3.11.4 Strategic Overview
13.3.12 American Industrial Systems, Inc.
13.3.12.1 Company Details (HQ, Foundation Year, Revenue, Employee Strength)
13.3.12.2 Market Presence, By Component Segmentation
13.3.12.3 SWOT Analysis
13.3.12.4 Strategic Overview
13.3.13 Parker Hannifin Corporation
13.3.13.1 Company Details (HQ, Foundation Year, Revenue, Employee Strength)
13.3.13.2 Market Presence, By Component Segmentation
13.3.13.3 SWOT Analysis
13.3.13.4 Strategic Overview
13.3.14 Advantech Co. Ltd.
13.3.14.1 Company Details (HQ, Foundation Year, Revenue, Employee Strength)
13.3.14.2 Market Presence, By Component Segmentation
13.3.14.3 SWOT Analysis
13.3.14.4 Strategic Overview
13.3.15 Beijer Electronics Inc.
13.3.15.1 Company Details (HQ, Foundation Year, Revenue, Employee Strength)
13.3.15.2 Market Presence, By Component Segmentation
13.3.15.3 SWOT Analysis
13.3.15.4 Strategic Overview
13.3.16 Emerson Electric Corporation
13.3.16.1 Company Details (HQ, Foundation Year, Revenue, Employee Strength)
13.3.16.2 Market Presence, By Component Segmentation
13.3.16.3 SWOT Analysis
13.3.16.4 Strategic Overview
13.3.17 Schneider Electric SE
13.3.17.1 Company Details (HQ, Foundation Year, Revenue, Employee Strength)
13.3.17.2 Market Presence, By Component Segmentation
13.3.17.3 SWOT Analysis
13.3.17.4 Strategic Overview
13.3.18 Yokogawa Electric Corporation
13.3.18.1 Company Details (HQ, Foundation Year, Revenue, Employee Strength)
13.3.18.2 Market Presence, By Component Segmentation
13.3.18.3 SWOT Analysis
13.3.18.4 Strategic Overview
13.3.19 Danaher Corporation
13.3.19.1 Company Details (HQ, Foundation Year, Revenue, Employee Strength)
13.3.19.2 Market Presence, By Component Segmentation
13.3.19.3 SWOT Analysis
13.3.19.4 Strategic Overview
13.3.20 Omron Corporation
13.3.20.1 Company Details (HQ, Foundation Year, Revenue, Employee Strength)
13.3.20.2 Market Presence, By Component Segmentation
13.3.20.3 SWOT Analysis
13.3.20.4 Strategic Overview
Chapter 14 Key Takeaway
List of Figures
Figure 1 Market Revenue Projections, 2014 - 2024 (US$ Mn)
Figure 2 HMI Market Value Chain
Figure 3 Market Value Share By Type (2016)
Figure 4 Market Value Share By Hardware (2016)
Figure 5 Market Value Share By End-use Industry (2016)
Figure 6 Global HMI Market Value Share Analysis, By Type, 2016 and 2024
Figure 7 Hardware
Figure 8 Software
Figure 9 Service
Figure 10 Human Machine Interface Comparison Matrix, By Type
Figure 11 HMI Market Attractiveness Analysis, By Type
Figure 12 Global HMI Market Value Share Analysis, By End-use Industry, 2016 and 2024
Figure 13 Healthcare & Pharmaceutical
Figure 14 Automotive
Figure 15 Manufacturing
Figure 16 Oil & Gas
Figure 17 Packaging
Figure 18 Food & Beverage
Figure 19 Defense & Aerospace
Figure 20 Metal & Mining
Figure 21 Others (Retail and Transportation)
Figure 22 Human Machine Interface Comparison Matrix, By End-use Industry
Figure 23 HMI Market Attractiveness Analysis, By End-use Industry
Figure 24 HMI Market CAGR (2016 – 2024) Analysis, By Country
Figure 25 Market Attractiveness Analysis, By Region
Figure 26 North America Human Machine Interface Market Size (US$ Mn) Forecast, 2014 – 2024
Figure 27 North America Human Machine Interface Market Y-o-Y Growth Projection, 2014 – 2024
Figure 28 North America HMI Market Value Share Analysis, By Type, 2016 and 2024
Figure 29 North America HMI Market Value Share Analysis, By End-use Industry, 2016 and 2024
Figure 31 North America Human Machine Interface Market Attractiveness Analysis, By Type
Figure 30 North America Human Machine Interface Market Attractiveness Analysis By End-Use Industry
Figure 32 North America Human Machine Interface Market Attractiveness Analysis, By Country
Figure 33 Europe Human Machine Interface Market Size (US$ Mn) Forecast, 2014 – 2024
Figure 34 Europe Human Machine Interface Market Y-o-Y Growth Projection, 2014 – 2024
Figure 35 Europe HMI Market Value Share Analysis, By Type, 2016 and 2024
Figure 36 Europe HMI Market Value Share Analysis, By End-use Industry, 2016 and 2024
Figure 38 Europe Human Machine Interface Market Attractiveness Analysis, By Type
Figure 37 Europe Human Machine Interface Market Attractiveness Analysis By End-Use Industry
Figure 39 Europe Human Machine Interface Market Attractiveness Analysis, By Country
Figure 40 Asia Pacific Human Machine Interface Market Size (US$ Mn) Forecast, 2014 – 2024
Figure 41 Asia Pacific Human Machine Interface Market Y-o-Y Growth Projection, 2014 – 2024
Figure 42 Asia Pacific HMI Market Value Share Analysis, By Type, 2016 and 2024
Figure 43 Asia Pacific HMI Market Value Share Analysis, By End-use Industry, 2016 and 2024
Figure 45 Asia Pacific Human Machine Interface Market Attractiveness Analysis, By Type
Figure 44 Asia Pacific Human Machine Interface Market Attractiveness Analysis By End-Use Industry
Figure 46 Asia Pacific Human Machine Interface Market Attractiveness Analysis, By Country
Figure 47 MEA Human Machine Interface Market Size (US$ Mn) Forecast, 2014 – 2024
Figure 48 MEA Human Machine Interface Market Y-o-Y Growth Projection, 2014 – 2024
Figure 49 MEA HMI Market Value Share Analysis, By Type, 2016 and 2024
Figure 50 MEA HMI Market Value Share Analysis, By End-use Industry, 2016 and 2024
Figure 52 MEA Human Machine Interface Market Attractiveness Analysis, By Type
Figure 51 MEA Human Machine Interface Market Attractiveness Analysis By End-Use Industry
Figure 53 MEA Human Machine Interface Market Attractiveness Analysis, By Country
Figure 54 South America Human Machine Interface Market Size (US$ Mn) Forecast, 2014 – 2024
Figure 55 South America Human Machine Interface Market Y-o-Y Growth Projection, 2014 – 2024
Figure 56 South America HMI Market Value Share Analysis, By Type, 2016 and 2024
Figure 57 South America HMI Market Value Share Analysis, By End-use Industry, 2016 and 2024
Figure 59 South America Human Machine Interface Market Attractiveness Analysis, By Type
Figure 58 South America Human Machine Interface Market Attractiveness Analysis By End-Use Industry
Figure 60 South America Human Machine Interface Market Attractiveness Analysis, By Country
Figure 61 Global HMI Market Share Analysis (2015)
Copyright © Transparency Market Research, Inc. All Rights reserved
Trust Online

Human Machine Interface (HMI) Market
