Deadlines during work from home (WFH), home schooling, and other indoor activities have led to increased coffee consumption and new customers trying to explore various brands during the coronavirus outbreak. As such, many customers are also being mindful about the consumption of too much caffeine that may lead to insomnia, anxiety, and acid reflux, among other short- and long-term health issues. These findings are translating into revenue opportunities for manufacturers in the decaffeinated coffee market.
Overall, poor market sentiments pertaining to demand and supply are affecting the growth of the global decaffeinated coffee market. Hence, brands are tapping revenue opportunities through eCommerce to keep economies running and boost the demand for decaffeinated coffee (decaf coffee). Brands are bullish on digital marketing and advertising, since several customers are increasing their screen time on phones, laptops, tablets, and the likes.
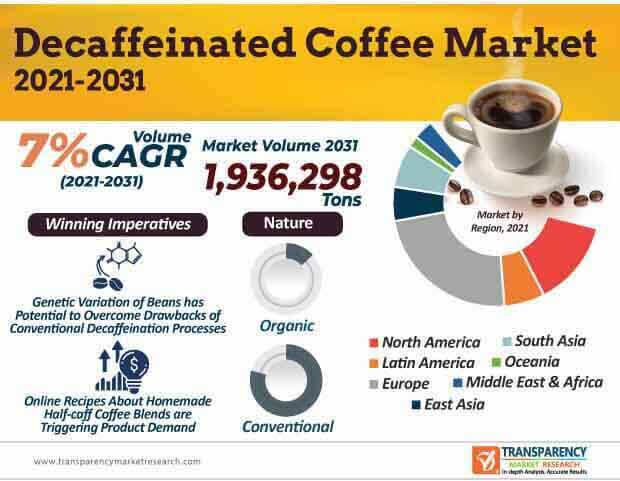
The decaffeinated coffee market is expected to reach an output of 1,936,298 tons by the end of 2031. However, possible side effects of decaf coffee such as heart complications, aggravation of rheumatoid arthritis, and acidity are affecting its adoption. As such, plenty of online information is helping to create awareness about the pros and cons of decaffeinated coffee. Brands should take this opportunity for upgrading their digital marketing strategies to educate customers about doctor’s consultation, especially for individuals with serious health issues.
It has been found that decaffeinated coffee is more expensive than regular coffee, simply as the production of decaf coffee is costlier. Such findings are influencing the growth of the decaffeinated coffee market. Since brands are opting for Colombian Arabica coffee beans, extra international shipping costs also need to be considered by market stakeholders. Brands launching new products are gaining awareness about these insights and strategically targeting premium customers opting for high quality decaffeinated coffee.
Even though the high quality decaf coffee is expensive than regular coffee, manufacturers in the decaffeinated coffee market are creating awareness about the journey from farm to market to educate people about good quality coffee beans.
The decaffeinated coffee market is projected to cross the value of US$ 14.83 Bn by 2031. Due to the COVID-19 pandemic, out-of-home coffee consumption in cafes and restaurants has been largely replaced by in-home brewing. Consumers are searching for online recipes about homemade half-caff coffee blends. Such trends are contributing to the growth of the decaffeinated coffee market.
Although Europe is anticipated to dominate the highest revenue share among all regions in the market, the market in South Asia is estimated to grow at a rapid rate in terms of revenue generation. Vidya Coffee - an India based overseas supplier of special green coffee is gaining recognition for its decaffeinated coffee, which aligns with the European law.
The decaffeinated coffee market is expected to clock a CAGR of 7.9% in terms of value. There is a growing demand for creating a secure food future. Stakeholders are witnessing a shift in consumer perception toward genetic variation of coffee beans, as processes that involve carbon dioxide, coffee oil, or water also include methyle acetate and ethylene chloride. These processes not only decaffeinate coffee, but also extract or alter the other chemicals that give coffee its fantastically complex taste and health benefits.
Moreover, the adoption of genetic variation of coffee beans is growing popular in the decaffeinated coffee market. This not only eliminates the need for a decaffeination process, but also helps to preserve the natural taste and chemistry of the coffee beans. On the other hand, companies are enabling decaffeination of beans while they are still green before they are roasted.
Analysts’ Viewpoint
As the world has witnessed a shift in preferences during the ongoing COVID-19 crisis, an increasing number of customers are transitioning from regular coffee to decaf coffee to reduce their caffeine intake. Different decaffeination processes such as methylene chloride decaf coffee process, ethyle acetate decaf coffee process, and Swiss water decaff coffee processes are being publicized. However, these processes rob off the excellently complex taste of coffee whilst eliminating its health benefits. Hence, companies in the decaffeinated coffee market should increase their research in genetic variation of coffee beans to overcome drawbacks of conventional decaffeination processes. As such, decaffeination processes should be carefully controlled so that any possible solvent residue remains below the strict limits fixed by law.
Decaffeinated Coffee Market: Overview
Decaffeinated Coffee: Market Frontrunners
Decaffeinated Coffee Market: Trends
Decaffeinated Coffee: Market Strategies
Decaffeinated Coffee Market: Key Players
Decaffeinated Coffee Market Snapshot
|
Attribute |
Detail |
|
Market Size Value in 2021 (Base Year) |
USD 6.93 Bn |
|
Market Forecast Value in 2031 |
USD 14.83 Bn |
|
Growth Rate (CAGR) |
7.9% |
|
Forecast Period |
2021-2031 |
|
Quantitative Units |
US$ Mn for Value & Tons for Volume |
|
Market Analysis |
It includes cross segment analysis at global as well as regional level. Furthermore, qualitative analysis includes drivers, restraints, opportunities, key trends, Porters Five Forces analysis, supply chain analysis, parent industry overview, etc. |
|
Competition Landscape |
|
|
Format |
Electronic (PDF) + Excel |
|
Market Segmentation |
|
|
Regions Covered |
|
|
Countries Covered |
|
|
Companies Profiled |
|
|
Customization Scope |
Available upon Request |
|
Pricing |
Available upon Request |
Decaffeinated Coffee Market is expected to Reach US$ 14.83 Bn In 2031
Decaffeinated Coffee Market is estimated to rise at a CAGR of 7.9% during forecast period
Increasing demand for non-GMO food products is expected to drive the Decaffeinated Coffee Market
Europe is more attractive for vendors in the Decaffeinated Coffee Market
Key players of Decaffeinated Coffee Market are Nestle SA, Keurig Dr Pepper Inc., The J.M. Smucker Company, The Kraft Heinz Company, Strauss Group Ltd, Tchibo Coffee International Ltd, Fresh Roasted Coffee LLC, Luigi Lavazza SPA, Costa Limited, Caribou Coffee Operating Company Inc., Tim Hortons, Jacobs Douwe Egberts Pro, Peet’s Coffee, Massimo Zanetti Beverage Group, Illycaffè S.p.A, Caffè Nero, Bewley’s Tea & Coffee, Alois Dallmayr KG, Cameron’s Coffee and Puroast Coffee Company
1. Executive Summary
1.1. Global Market Outlook
1.2. Demand Side Trends
1.3. Supply Side Trends
1.4. Analysis and Recommendations
2. Market Overview
2.1. Market Coverage / Taxonomy
2.2. Market Definition / Scope / Limitations
3. Key Market Trends
3.1. Key Trends Impacting the Market
3.2. Product Innovation / Development Trends
4. Key Success Factors
4.1. Product Adoption / Usage Analysis
4.2. Product USPs / Features
4.3. Strategic Promotional Strategies
5. Global Decaffeinated Coffee Demand Analysis 2016–2020 and Forecast, 2021–2031
5.1. Historical Market Volume (Tons) Analysis, 2016–2020
5.2. Current and Future Market Volume (Tons) Projections, 2021–2031
6. Global Decaffeinated Coffee - Pricing Analysis
6.1. Regional Pricing Analysis By Type
6.2. Global Average Pricing Analysis Benchmark
7. Global Decaffeinated Coffee Demand (in Value or Size in US$ Mn) Analysis 2016–2020 and Forecast, 2021–2031
7.1. Historical Market Value (US$ Mn) Analysis, 2016–2020
7.2. Current and Future Market Value (US$ Mn) Projections, 2021–2031
7.2.1. Y-o-Y Growth Trend Analysis
7.2.2. Absolute $ Opportunity Analysis
8. Market Background
8.1. Macro-Economic Factors
8.1.1. Global GDP Growth Outlook
8.1.2. Global Industry Value Added
8.1.3. Global Urbanization Growth Outlook
8.1.4. Global Food Security Index Outlook
8.1.5. Global Rank – Ease of Doing Business
8.1.6. Global Rank – Trading Across Borders
8.2. Impact of COVID-19 on Coffee Market
8.2.1. Manufacturer/Processors
8.2.2. Supply Chain and Logistics
8.2.3. Wholesalers/Traders
8.2.4. Retailers
8.3. Impact of COVID-19 on Food & Beverage Industry
8.4. Impact of COVID-19 on Retail Sector
8.5. COVID-19 Risk Assessment/Impact
8.6. Global Food & Beverage Industry Outlook
8.7. Global Organic Food & Beverage Market Overview
8.8. Global Coffee Production Outlook
8.9. Export/Import Trade Analysis of Coffee by Country
8.9.1. List of Key Exporters
8.9.1.1. By Value (US$ Mn)
8.9.1.2. By Volume (Tons)
8.9.2. List of Key Importers
8.9.2.1. By Value (US$ Mn)
8.9.2.2. By Volume (Tons)
8.10. Per Capita Coffee Consumption by Country
8.11. Types of Coffee offered by Key Players
8.12. List of Key Retail Coffee House Chain Outlets – Global
8.13. Value Chain Analysis
8.14. Key Rules and Regulations
8.15. Market Dynamics
8.15.1. Drivers
8.15.2. Restraints
8.15.3. Opportunity Analysis
8.16. Forecast Factors - Relevance & Impact
9. Global Decaffeinated Coffee Analysis 2016–2020 and Forecast 2021–2031, by Nature
9.1. Introduction / Key Findings
9.2. Historical Market Size (US$ Mn) and Volume Analysis By Nature, 2016–2020
9.3. Current and Future Market Size (US$ Mn) and Volume Analysis and Forecast By Nature, 2021–2031
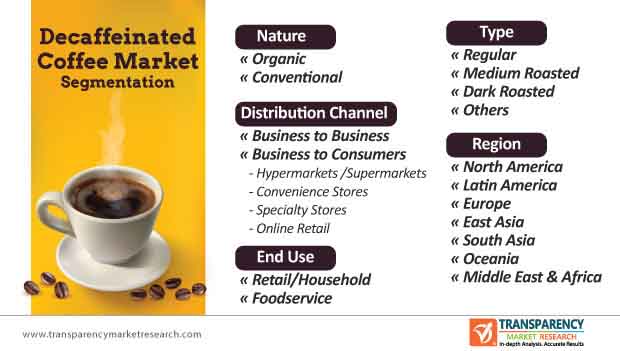
9.3.1. Organic
9.3.2. Conventional
9.4. Market Attractiveness Analysis By Nature
10. Global Decaffeinated Coffee Analysis 2016–2020 and Forecast 2021–2031, By Type
10.1. Introduction / Key Findings
10.2. Historical Market Size (US$ Mn) and Volume Analysis By Type, 2016–2020
10.3. Current and Future Market Size (US$ Mn) and Volume Analysis and Forecast By Type, 2021–2031
10.3.1. Regular
10.3.2. Medium Roasted
10.3.3. Dark Roasted
10.3.4. Others
10.4. Market Attractiveness Analysis By Type
11. Global Lion’s Mane Mushroom Market Analysis 2016-2020 and Forecast 2021–2031, by Distribution Channel
11.1. Introduction / Key Findings
11.2. Historical Market Size (US$ Mn) and Volume Analysis By End Use, 2016–2020
11.3. Current and Future Market Size (US$ Mn) and Volume Analysis and Forecast By End Use, 2021–2031
11.3.1. Retail/Household
11.3.2. Foodservice Industry
11.4. Market Attractiveness Analysis By End Use
12. Global Decaffeinated Coffee Analysis 2016–2020 and Forecast 2021–2031, by Distribution Channel
12.1. Introduction / Key Findings
12.2. Historical Market Size (US$ Mn) and Volume Analysis By Distribution Channel, 2016-2020
12.3. Current and Future Market Size (US$ Mn) and Volume Analysis and Forecast By Distribution Channel, 2021–2031
12.3.1. Business to Business
12.3.2. Business to Consumer
12.3.2.1. Hypermarkets/Supermarkets
12.3.2.2. Convenience Stores
12.3.2.3. Specialty Stores
12.3.2.4. Online Retail
12.4. Market Attractiveness Analysis By Distribution Channel
13. Global Decaffeinated Coffee Analysis 2016–2020 and Forecast 2021–2031, by Region
13.1. Introduction
13.2. Historical Market Size (US$ Mn) and Volume Analysis By Region, 2016–2020
13.3. Current Market Size (US$ Mn) and Volume Analysis and Forecast By Region, 2021–2031
13.3.1. North America
13.3.2. Latin America
13.3.3. Europe
13.3.4. East Asia
13.3.5. South Asia
13.3.6. Oceania
13.3.7. Middle East and Africa (MEA)
13.4. Market Attractiveness Analysis By Region
14. North America Decaffeinated Coffee Analysis 2016–2020 and Forecast 2021–2031
14.1. Introduction
14.2. Historical Market Size (US$ Mn) and Volume Trend Analysis By Market Taxonomy, 2016–2020
14.3. Market Size (US$ Mn) and Volume Forecast By Market Taxonomy, 2021–2031
14.3.1. By Country
14.3.1.1. U.S.
14.3.1.2. Canada
14.3.2. By Nature
14.3.3. By End Use
14.3.4. By Type
14.3.5. By Distribution Channel
14.4. Market Attractiveness Analysis
14.4.1. By Country
14.4.2. By Nature
14.4.3. By Type
14.4.4. By End Use
14.4.5. By Distribution Channel
14.5. Drivers and Restraints - Impact Analysis
15. Latin America Decaffeinated Coffee Analysis 2016–2020 and Forecast 2021–2031
15.1. Introduction
15.2. Historical Market Size (US$ Mn) and Volume Trend Analysis By Market Taxonomy, 2016–2020
15.3. Market Size (US$ Mn) and Volume Forecast By Market Taxonomy, 2021–2031
15.3.1. By Country
15.3.1.1. Brazil
15.3.1.2. Mexico
15.3.1.3. Rest of Latin America
15.3.2. By Nature
15.3.3. By End Use
15.3.4. By Type
15.3.5. By Distribution Channel
15.4. Market Attractiveness Analysis
15.4.1. By Country
15.4.2. By Nature
15.4.3. By Type
15.4.4. By End Use
15.4.5. By Distribution Channel
15.5. Drivers and Restraints - Impact Analysis
16. Europe Decaffeinated Coffee Analysis 2016–2020 and Forecast 2021–2031
16.1. Introduction
16.2. Historical Market Size (US$ Mn) and Volume Trend Analysis By Market Taxonomy, 2016–2020
16.3. Market Size (US$ Mn) and Volume Forecast By Market Taxonomy, 2021–2031
16.3.1. By Country
16.3.1.1. Germany
16.3.1.2. Italy
16.3.1.3. France
16.3.1.4. U.K.
16.3.1.5. Spain
16.3.1.6. BENELUX
16.3.1.7. Nordic
16.3.1.8. Russia
16.3.1.9. Poland
16.3.1.10. Rest of Europe
16.3.2. By Nature
16.3.3. By End Use
16.3.4. By Type
16.3.5. By Distribution Channel
16.4. Market Attractiveness Analysis
16.4.1. By Country
16.4.2. By Nature
16.4.3. By Type
16.4.4. By End Use
16.4.5. By Distribution Channel
16.5. Drivers and Restraints - Impact Analysis
17. South Asia Decaffeinated Coffee Analysis 2016–2020 and Forecast 2021–2031
17.1. Introduction
17.2. Historical Market Size (US$ Mn) and Volume Trend Analysis By Market Taxonomy, 2016–2020
17.3. Market Size (US$ Mn) and Volume Forecast By Market Taxonomy, 2021–2031
17.3.1. By Country
17.3.1.1. India
17.3.1.2. Thailand
17.3.1.3. Indonesia
17.3.1.4. Malaysia
17.3.1.5. Rest of South Asia
17.3.2. By Nature
17.3.3. By Type
17.3.4. By End Use
17.3.5. By Distribution Channel
17.4. Market Attractiveness Analysis
17.4.1. By Country
17.4.2. By Nature
17.4.3. By End Use
17.4.4. By Type
17.4.5. By Distribution Channel
17.5. Drivers and Restraints - Impact Analysis
18. East Asia Decaffeinated Coffee Analysis 2016–2020 and Forecast 2021–2031
18.1. Introduction
18.2. Historical Market Size (US$ Mn) and Volume Trend Analysis By Market Taxonomy, 2016–2020
18.3. Market Size (US$ Mn) and Volume Forecast By Market Taxonomy, 2021–2031
18.3.1. By Country
18.3.1.1. China
18.3.1.2. Japan
18.3.1.3. South Korea
18.3.2. By Nature
18.3.3. By End Use
18.3.4. By Type
18.3.5. By Distribution Channel
18.4. Market Attractiveness Analysis
18.4.1. By Country
18.4.2. By Nature
18.4.3. By Type
18.4.4. By End Use
18.4.5. By Distribution Channel
18.5. Drivers and Restraints - Impact Analysis
19. Oceania Decaffeinated Coffee Analysis 2016–2020 and Forecast 2021–2031
19.1. Introduction
19.2. Historical Market Size (US$ Mn) and Volume Trend Analysis By Market Taxonomy, 2016–2020
19.3. Market Size (US$ Mn) and Volume Forecast By Market Taxonomy, 2021–2031
19.3.1. By Country
19.3.1.1. Australia
19.3.1.2. New Zealand
19.3.2. By Nature
19.3.3. By End Use
19.3.4. By Type
19.3.5. By Distribution Channel
19.4. Market Attractiveness Analysis
19.4.1. By Country
19.4.2. By Nature
19.4.3. By Type
19.4.4. By End Use
19.4.5. By Distribution Channel
19.5. Drivers and Restraints - Impact Analysis
20. Middle East and Africa Decaffeinated Coffee Analysis 2016–2020 and Forecast 2021–2031
20.1. Introduction
20.2. Historical Market Size (US$ Mn) and Volume Trend Analysis By Market Taxonomy, 2016–2020
20.3. Market Size (US$ Mn) and Volume Forecast By Market Taxonomy, 2021–2031
20.3.1. By Country
20.3.1.1. GCC Countries
20.3.1.2. Turkey
20.3.1.3. South Africa
20.3.1.4. Rest of Middle East and Africa
20.3.2. By Nature
20.3.3. By End Use
20.3.4. By Type
20.3.5. By Distribution Channel
20.4. Market Attractiveness Analysis
20.4.1. By Country
20.4.2. By Nature
20.4.3. By Type
20.4.4. By End Use
20.4.5. By Distribution Channel
20.5. Drivers and Restraints - Impact Analysis
21. Market Structure Analysis
21.1. Market Analysis by Tier of Companies
21.2. Market Concentration
21.3. Market Presence Analysis
22. Competition Analysis
22.1. Competition Dashboard
22.2. Competition Benchmarking
22.3. Competition Deep Dive
22.3.1. Nestle SA
22.3.1.1. Overview
22.3.1.2. Product Portfolio
22.3.1.3. Sales Footprint
22.3.1.4. Key Developments/Key Takeaways
22.3.1.5. Strategy Overview
22.3.1.6. Financial Overview
22.3.2. Keurig Green Mountain, Inc.
22.3.2.1. Overview
22.3.2.2. Product Portfolio
22.3.2.3. Sales Footprint
22.3.2.4. Key Developments/Key Takeaways
22.3.2.5. Strategy Overview
22.3.2.6. Financial Overview
22.3.3. The J.M. Smucker Company
22.3.3.1. Overview
22.3.3.2. Product Portfolio
22.3.3.3. Sales Footprint
22.3.3.4. Key Developments/Key Takeaways
22.3.3.5. Strategy Overview
22.3.3.6. Financial Overview
22.3.4. The Kraft Heinz Company
22.3.4.1. Overview
22.3.4.2. Product Portfolio
22.3.4.3. Sales Footprint
22.3.4.4. Key Developments/Key Takeaways
22.3.4.5. Strategy Overview
22.3.4.6. Financial Overview
22.3.5. Strauss Group
22.3.5.1. Overview
22.3.5.2. Product Portfolio
22.3.5.3. Sales Footprint
22.3.5.4. Key Developments/Key Takeaways
22.3.5.5. Strategy Overview
22.3.5.6. Financial Overview
22.3.6. Tchibo Coffee International Ltd.
22.3.6.1. Overview
22.3.6.2. Product Portfolio
22.3.6.3. Sales Footprint
22.3.6.4. Key Developments/Key Takeaways
22.3.6.5. Strategy Overview
22.3.6.6. Financial Overview
22.3.7. Fresh Roasted Coffee LLC.
22.3.7.1. Overview
22.3.7.2. Product Portfolio
22.3.7.3. Sales Footprint
22.3.7.4. Key Developments/Key Takeaways
22.3.7.5. Strategy Overview
22.3.7.6. Financial Overview
22.3.8. Luigi Lavazza SPA
22.3.8.1. Overview
22.3.8.2. Product Portfolio
22.3.8.3. Sales Footprint
22.3.8.4. Key Developments/Key Takeaways
22.3.8.5. Strategy Overview
22.3.8.6. Financial Overview
22.3.9. Costa Coffee
22.3.9.1. Overview
22.3.9.2. Product Portfolio
22.3.9.3. Sales Footprint
22.3.9.4. Key Developments/Key Takeaways
22.3.9.5. Strategy Overview
22.3.9.6. Financial Overview
22.3.10. Caribou Coffee Company
22.3.10.1. Overview
22.3.10.2. Product Portfolio
22.3.10.3. Sales Footprint
22.3.10.4. Key Developments/Key Takeaways
22.3.10.5. Strategy Overview
22.3.10.6. Financial Overview
22.3.11. Tim Hortons Inc.
22.3.11.1. Overview
22.3.11.2. Product Portfolio
22.3.11.3. Sales Footprint
22.3.11.4. Key Developments/Key Takeaways
22.3.11.5. Strategy Overview
22.3.11.6. Financial Overview
22.3.12. Jacobs Douwe Egberts
22.3.12.1. Overview
22.3.12.2. Product Portfolio
22.3.12.3. Sales Footprint
22.3.12.4. Key Developments/Key Takeaways
22.3.12.5. Strategy Overview
22.3.12.6. Financial Overview
22.3.13. Peet's Coffee
22.3.13.1. Overview
22.3.13.2. Product Portfolio
22.3.13.3. Sales Footprint
22.3.13.4. Key Developments/Key Takeaways
22.3.13.5. Strategy Overview
22.3.13.6. Financial Overview
22.3.14. Massimo Zanetti Beverage Group
22.3.14.1. Overview
22.3.14.2. Product Portfolio
22.3.14.3. Sales Footprint
22.3.14.4. Key Developments/Key Takeaways
22.3.14.5. Strategy Overview
22.3.14.6. Financial Overview
22.3.15. Illycaffè S.p.A.
22.3.15.1. Overview
22.3.15.2. Product Portfolio
22.3.15.3. Sales Footprint
22.3.15.4. Key Developments/Key Takeaways
22.3.15.5. Strategy Overview
22.3.15.6. Financial Overview
22.3.16. Caffè Nero Group Ltd
22.3.16.1. Overview
22.3.16.2. Product Portfolio
22.3.16.3. Sales Footprint
22.3.16.4. Key Developments/Key Takeaways
22.3.16.5. Strategy Overview
22.3.16.6. Financial Overview
22.3.17. Bewley’s Ltd.
22.3.17.1. Overview
22.3.17.2. Product Portfolio
22.3.17.3. Sales Footprint
22.3.17.4. Key Developments/Key Takeaways
22.3.17.5. Strategy Overview
22.3.17.6. Financial Overview
22.3.18. Alois Dallmayr KG
22.3.18.1. Overview
22.3.18.2. Product Portfolio
22.3.18.3. Sales Footprint
22.3.18.4. Key Developments/Key Takeaways
22.3.18.5. Strategy Overview
22.3.18.6. Financial Overview
22.3.19. Camerons Coffee
22.3.19.1. Overview
22.3.19.2. Product Portfolio
22.3.19.3. Sales Footprint
22.3.19.4. Key Developments/Key Takeaways
22.3.19.5. Strategy Overview
22.3.19.6. Financial Overview
22.3.20. Puroast Coffee Company, Inc.
22.3.20.1. Overview
22.3.20.2. Product Portfolio
22.3.20.3. Sales Footprint
22.3.20.4. Key Developments/Key Takeaways
22.3.20.5. Strategy Overview
22.3.20.6. Financial Overview
22.3.21. Others (On Additional Request)
23. Assumptions and Acronyms Used
24. Research Methodology
List of Tables
Table 01: Global Decaffeinated Coffee Market Value (US$ Mn) Analysis and Forecast by Nature, 2016-2031
Table 02: Global Decaffeinated Coffee Market Volume (Tons) Analysis and Forecast by Nature, 2016-2031
Table 03: Global Decaffeinated Coffee Market Value (US$ Mn) Analysis and Forecast by Type, 2016-2031
Table 04: Global Decaffeinated Coffee Market Volume (Tons) Analysis and Forecast by Type, 2016-2031
Table 05: Global Decaffeinated Coffee Market Value (US$ Mn) Analysis and Forecast by End Use, 2016-2031
Table 06: Global Decaffeinated Coffee Market Volume (Tons) Analysis and Forecast by End Use, 2016-2031
Table 07: Global Decaffeinated Coffee Market Value (US$ Mn) Analysis and Forecast by Distribution Channel, 2016-2031
Table 08: Global Decaffeinated Coffee Market Volume (Tons) Analysis and Forecast by Distribution Channel, 2016-2031
Table 09: Global Decaffeinated Coffee Market Value (US$ Mn) Analysis and Forecast by Business to Consumers, 2016-2031
Table 10: Global Decaffeinated Coffee Market Volume (Tons) Analysis and Forecast by Business to Consumers, 2016-2031
Table 11: Global Decaffeinated Coffee Market Value (US$ Mn) Analysis and Forecast by Region, 2016-2031
Table 12: Global Decaffeinated Coffee Market Volume (Tons) Analysis and Forecast by Region, 2016-2031
Table 13: North America Decaffeinated Coffee Market Value (US$ Mn) Analysis and Forecast by Nature, 2016-2031
Table 14: North America Decaffeinated Coffee Market Volume (Tons) Analysis and Forecast by Nature, 2016-2031
Table 15: North America Decaffeinated Coffee Market Value (US$ Mn) Analysis and Forecast by Type, 2016-2031
Table 16: North America Decaffeinated Coffee Market Volume (Tons) Analysis and Forecast by Type, 2016-2031
Table 17: North America Decaffeinated Coffee Market Value (US$ Mn) Analysis and Forecast by End Use, 2016-2031
Table 18: North America Decaffeinated Coffee Market Volume (Tons) Analysis and Forecast by End Use, 2016-2031
Table 19: North America Decaffeinated Coffee Market Value (US$ Mn) Analysis and Forecast by Distribution Channel, 2015–2031
Table 20: North America Decaffeinated Coffee Market Volume (Tons) Analysis and Forecast by Distribution Channel, 2015–2031
Table 21: North America Decaffeinated Coffee Market Value (US$ Mn) Analysis and Forecast by Business to Consumer, 2016-2031
Table 22: North America Decaffeinated Coffee Market Volume (Tons) Analysis and Forecast by Business to Consumer, 2016-2031
Table 23: North America Decaffeinated Coffee Market Value (US$ Mn) Analysis and Forecast by Country, 2015–2031
Table 24: North America Decaffeinated Coffee Market Volume (Tons) Analysis and Forecast by Country, 2015–2031
Table 25: Latin America Decaffeinated Coffee Market Value (US$ Mn) Analysis and Forecast by Nature, 2016-2031
Table 26: Latin America Decaffeinated Coffee Market Volume (Tons) Analysis and Forecast by Nature, 2016-2031
Table 27: Latin America Decaffeinated Coffee Market Value (US$ Mn) Analysis and Forecast by Type, 2016-2031
Table 28: Latin America Decaffeinated Coffee Market Volume (Tons) Analysis and Forecast by Type, 2016-2031
Table 29: Latin America Decaffeinated Coffee Market Value (US$ Mn) Analysis and Forecast by End Use, 2016-2031
Table 30: Latin America Decaffeinated Coffee Market Volume (Tons) Analysis and Forecast by End Use, 2016-2031
Table 31: Latin America Decaffeinated Coffee Market Value (US$ Mn) Analysis and Forecast by Distribution Channel, 2015–2031
Table 32: Latin America Decaffeinated Coffee Market Volume (Tons) Analysis and Forecast by Distribution Channel, 2015–2031
Table 33: Latin America Decaffeinated Coffee Market Value (US$ Mn) Analysis and Forecast by Business to Consumer, 2016-2031
Table 34: Latin America Decaffeinated Coffee Market Volume (Tons) Analysis and Forecast by Business to Consumer, 2016-2031
Table 35: Latin America Decaffeinated Coffee Market Value (US$ Mn) Analysis and Forecast by Country, 2015–2031
Table 36: Latin America Decaffeinated Coffee Market Volume (Tons) Analysis and Forecast by Country, 2015–2031
Table 37: Europe Decaffeinated Coffee Market Value (US$ Mn) Analysis and Forecast by Nature, 2016-2031
Table 38: Europe Decaffeinated Coffee Market Volume (Tons) Analysis and Forecast by Nature, 2016-2031
Table 39: Europe Decaffeinated Coffee Market Value (US$ Mn) Analysis and Forecast by Type, 2016-2031
Table 40: Europe Decaffeinated Coffee Market Volume (Tons) Analysis and Forecast by Type, 2016-2031
Table 41: Europe Decaffeinated Coffee Market Value (US$ Mn) Analysis and Forecast by End Use, 2016-2031
Table 42: Europe Decaffeinated Coffee Market Volume (Tons) Analysis and Forecast by End Use, 2016-2031
Table 43: Europe Decaffeinated Coffee Market Value (US$ Mn) Analysis and Forecast by Distribution Channel, 2015–2031
Table 44: Europe Decaffeinated Coffee Market Volume (Tons) Analysis and Forecast by Distribution Channel, 2015–2031
Table 45: Europe Decaffeinated Coffee Market Value (US$ Mn) Analysis and Forecast by Business to Consumer, 2016-2031
Table 46: Europe Decaffeinated Coffee Market Volume (Tons) Analysis and Forecast by Business to Consumer, 2016-2031
Table 47: Europe Decaffeinated Coffee Market Value (US$ Mn) Analysis and Forecast by Country, 2015–2031
Table 48: Europe Decaffeinated Coffee Market Volume (Tons) Analysis and Forecast by Country, 2015–2031
Table 49: South Asia Decaffeinated Coffee Market Value (US$ Mn) Analysis and Forecast by Nature, 2016-2031
Table 50: South Asia Decaffeinated Coffee Market Volume (Tons) Analysis and Forecast by Nature, 2016-2031
Table 51: South Asia Decaffeinated Coffee Market Value (US$ Mn) Analysis and Forecast by Type, 2016-2031
Table 52: South Asia Decaffeinated Coffee Market Volume (Tons) Analysis and Forecast by Type, 2016-2031
Table 53: South Asia Decaffeinated Coffee Market Value (US$ Mn) Analysis and Forecast by End Use, 2016-2031
Table 54: South Asia Decaffeinated Coffee Market Volume (Tons) Analysis and Forecast by End Use, 2016-2031
Table 55: South Asia Decaffeinated Coffee Market Value (US$ Mn) Analysis and Forecast by Distribution Channel, 2015–2031
Table 56: South Asia Decaffeinated Coffee Market Volume (Tons) Analysis and Forecast by Distribution Channel, 2015–2031
Table 57: South Asia Decaffeinated Coffee Market Value (US$ Mn) Analysis and Forecast by Business to Consumer, 2016-2031
Table 58: South Asia Decaffeinated Coffee Market Volume (Tons) Analysis and Forecast by Business to Consumer, 2016-2031
Table 59: South Asia Decaffeinated Coffee Market Value (US$ Mn) Analysis and Forecast by Country, 2015–2031
Table 60: South Asia Decaffeinated Coffee Market Volume (Tons) Analysis and Forecast by Country, 2015–2031
Table 61: East Asia Decaffeinated Coffee Market Value (US$ Mn) Analysis and Forecast by Nature, 2016-2031
Table 62: East Asia Decaffeinated Coffee Market Volume (Tons) Analysis and Forecast by Nature, 2016-2031
Table 63: East Asia Decaffeinated Coffee Market Value (US$ Mn) Analysis and Forecast by Type, 2016-2031
Table 64: East Asia Decaffeinated Coffee Market Volume (Tons) Analysis and Forecast by Type, 2016-2031
Table 65: East Asia Decaffeinated Coffee Market Value (US$ Mn) Analysis and Forecast by End Use, 2016-2031
Table 66: East Asia Decaffeinated Coffee Market Volume (Tons) Analysis and Forecast by End Use, 2016-2031
Table 67: East Asia Decaffeinated Coffee Market Value (US$ Mn) Analysis and Forecast by Distribution Channel, 2015–2031
Table 68: East Asia Decaffeinated Coffee Market Volume (Tons) Analysis and Forecast by Distribution Channel, 2015–2031
Table 69: East Asia Decaffeinated Coffee Market Value (US$ Mn) Analysis and Forecast by Business to Consumer, 2016-2031
Table 70: East Asia Decaffeinated Coffee Market Volume (Tons) Analysis and Forecast by Business to Consumer, 2016-2031
Table 71: East Asia Decaffeinated Coffee Market Value (US$ Mn) Analysis and Forecast by Country, 2015–2031
Table 72: East Asia Decaffeinated Coffee Market Volume (Tons) Analysis and Forecast by Country, 2015–2031
Table 73: Oceania Decaffeinated Coffee Market Value (US$ Mn) Analysis and Forecast by Nature, 2016-2031
Table 74: Oceania Decaffeinated Coffee Market Volume (Tons) Analysis and Forecast by Nature, 2016-2031
Table 75: Oceania Decaffeinated Coffee Market Value (US$ Mn) Analysis and Forecast by Type, 2016-2031
Table 76: Oceania Decaffeinated Coffee Market Volume (Tons) Analysis and Forecast by Type, 2016-2031
Table 77: Oceania Decaffeinated Coffee Market Value (US$ Mn) Analysis and Forecast by End Use, 2016-2031
Table 78: Oceania Decaffeinated Coffee Market Volume (Tons) Analysis and Forecast by End Use, 2016-2031
Table 79: Oceania Decaffeinated Coffee Market Value (US$ Mn) Analysis and Forecast by Distribution Channel, 2015–2031
Table 80: Oceania Decaffeinated Coffee Market Volume (Tons) Analysis and Forecast by Distribution Channel, 2015–2031
Table 81: Oceania Decaffeinated Coffee Market Value (US$ Mn) Analysis and Forecast by Business to Consumer, 2016-2031
Table 82: Oceania Decaffeinated Coffee Market Volume (Tons) Analysis and Forecast by Business to Consumer, 2016-2031
Table 83: Oceania Decaffeinated Coffee Market Value (US$ Mn) Analysis and Forecast by Country, 2015–2031
Table 84: Oceania Decaffeinated Coffee Market Volume (Tons) Analysis and Forecast by Country, 2015–2031
Table 85: Middle East & Africa Decaffeinated Coffee Market Value (US$ Mn) Analysis and Forecast by Nature, 2016-2031
Table 86: Middle East & Africa Decaffeinated Coffee Market Volume (Tons) Analysis and Forecast by Nature, 2016-2031
Table 87: Middle East & Africa Decaffeinated Coffee Market Value (US$ Mn) Analysis and Forecast by Type, 2016-2031
Table 88: Middle East & Africa Decaffeinated Coffee Market Volume (Tons) Analysis and Forecast by Type, 2016-2031
Table 89: Middle East & Africa Decaffeinated Coffee Market Value (US$ Mn) Analysis and Forecast by End Use, 2016-2031
Table 90: Middle East & Africa Decaffeinated Coffee Market Volume (Tons) Analysis and Forecast by End Use, 2016-2031
Table 91: Middle East & Africa Decaffeinated Coffee Market Value (US$ Mn) Analysis and Forecast by Distribution Channel, 2015–2031
Table 92: Middle East & Africa Decaffeinated Coffee Market Volume (Tons) Analysis and Forecast by Distribution Channel, 2015–2031
Table 93: Middle East & Africa Decaffeinated Coffee Market Value (US$ Mn) Analysis and Forecast by Business to Consumer, 2016-2031
Table 94: Middle East & Africa Decaffeinated Coffee Market Volume (Tons) Analysis and Forecast by Business to Consumer, 2016-2031
Table 95: Middle East and Africa Decaffeinated Coffee Market Value (US$ Mn) Analysis and Forecast by Country, 2015–2031
Table 96: Middle East and Africa Decaffeinated Coffee Market Volume (Tons) Analysis and Forecast by Country, 2015–2031
List of Figures
Figure 01: Global Decaffeinated Coffee Market Value (US$ Mn) Forecast, 2021 –2031
Figure 02: Global Decaffeinated Coffee Market Volume (Tons) Forecast, 2021 –2031
Figure 03: Global Decaffeinated Coffee Market Value Share Analysis by Nature, 2021 E
Figure 04: Global Decaffeinated Coffee Market Y-o-Y Growth Rate by Nature, 2021 -2031
Figure 05: Global Decaffeinated Coffee Market Value (US$ Mn) Analysis & Forecast by Nature, 2021 –2031
Figure 06: Global Decaffeinated Coffee Market Volume (Tons) Analysis & Forecast by Nature, 2021 –2031
Figure 07: Global Decaffeinated Coffee Market Value Share Analysis by Type, 2021 E
Figure 08: Global Decaffeinated Coffee Market Y-o-Y Growth Rate by Type, 2021 -2031
Figure 09: Global Decaffeinated Coffee Market Value (US$ Mn) Analysis & Forecast by Type, 2021 –2031
Figure 10: Global Decaffeinated Coffee Market Volume (Tons) Analysis & Forecast by Type, 2021 –2031
Figure 11: Global Decaffeinated Coffee Market Value Share Analysis by End Use, 2021 E
Figure 12: Global Decaffeinated Coffee Market Y-o-Y Growth Rate by End Use, 2021 -2031
Figure 13: Global Decaffeinated Coffee Market Value (US$ Mn) Analysis & Forecast by End Use, 2021 –2031
Figure 14: Global Decaffeinated Coffee Market Volume (Tons) Analysis & Forecast by End Use, 2021 –2031
Figure 15: Global Decaffeinated Coffee Market Value Share Analysis by Distribution Channel, 2021 E
Figure 16: Global Decaffeinated Coffee Market Y-o-Y Growth Rate by Distribution Channel, 2021 -2031
Figure 17: Global Decaffeinated Coffee Market Value (US$ Mn) Analysis & Forecast by Distribution Channel, 2021 –2031
Figure 18: Global Decaffeinated Coffee Market Volume (Tons) Analysis & Forecast by Distribution Channel, 2021 –2031
Figure 19: Global Decaffeinated Coffee Market Value Share Analysis by Region, 2021 E
Figure 20: Global Decaffeinated Coffee Market Y-o-Y Growth Rate by Region, 2021 -2031
Figure 21: Global Decaffeinated Coffee Market Value (US$ Mn) Analysis & Forecast by Region, 2021 –2031
Figure 22: Global Decaffeinated Coffee Market Volume (Tons) Analysis & Forecast by Region, 2021 –2031
Figure 23: Global Decaffeinated Coffee Market Attractiveness Analysis by Region, 2021 -2031
Figure 24: Global Decaffeinated Coffee Market Attractiveness Analysis by Nature, 2021 -2031
Figure 25: Global Decaffeinated Coffee Market Attractiveness Analysis by Type, 2021-2031
Figure 26: Global Decaffeinated Coffee Market Attractiveness Analysis by End Use, 2021 -2031
Figure 27: Global Decaffeinated Coffee Market Attractiveness Analysis by Distribution Channel, 2021 -2031
Figure 28: North America Decaffeinated Coffee Market Value (US$ Mn) Analysis & Forecast by Nature, 2021 –2031
Figure 29: North America Decaffeinated Coffee Market Volume (Tons) Analysis & Forecast by Nature, 2021 –2031
Figure 30: North America Decaffeinated Coffee Market Value (US$ Mn) Analysis & Forecast by Type, 2021 –2031
Figure 31: North America Decaffeinated Coffee Market Volume (Tons) Analysis & Forecast by Type, 2021 –2031
Figure 32: North America Decaffeinated Coffee Market Value (US$ Mn) Analysis & Forecast by End Use, 2021 –2031
Figure 33: North America Decaffeinated Coffee Market Volume (Tons) Analysis & Forecast by End Use, 2021 –2031
Figure 34: North America Decaffeinated Coffee Market Value (US$ Mn) Analysis & Forecast by Distribution Channel, 2021 –2031
Figure 35: North America Decaffeinated Coffee Market Volume (Tons) Analysis & Forecast by Distribution Channel, 2021 –2031
Figure 36: North America Decaffeinated Coffee Market Value (US$ Mn) Analysis & Forecast by Country, 2021 –2031
Figure 37: North America Decaffeinated Coffee Market Volume (Tons) Analysis & Forecast by Country, 2021 –2031
Figure 38: North America Decaffeinated Coffee Market Attractiveness Analysis by Region, 2021 -2031
Figure 39: North America Decaffeinated Coffee Market Attractiveness Analysis by Nature, 2021 -2031
Figure 40: North America Decaffeinated Coffee Market Attractiveness Analysis by Type, 2021-2031
Figure 41: North America Decaffeinated Coffee Market Attractiveness Analysis by End Use, 2021 -2031
Figure 42: North America Decaffeinated Coffee Market Attractiveness Analysis by Distribution Channel, 2021 -2031
Figure 43: Latin America Decaffeinated Coffee Market Value (US$ Mn) Analysis & Forecast by Nature, 2021 –2031
Figure 44: Latin America Decaffeinated Coffee Market Volume (Tons) Analysis & Forecast by Nature, 2021 –2031
Figure 45: Latin America Decaffeinated Coffee Market Value (US$ Mn) Analysis & Forecast by Type, 2021 –2031
Figure 46: Latin America Decaffeinated Coffee Market Volume (Tons) Analysis & Forecast by Type, 2021 –2031
Figure 47: Latin America Decaffeinated Coffee Market Value (US$ Mn) Analysis & Forecast by End Use, 2021 –2031
Figure 48: Latin America Decaffeinated Coffee Market Volume (Tons) Analysis & Forecast by End Use, 2021 –2031
Figure 49: Latin America Decaffeinated Coffee Market Value (US$ Mn) Analysis & Forecast by Distribution Channel, 2021 –2031
Figure 50: Latin America Decaffeinated Coffee Market Volume (Tons) Analysis & Forecast by Distribution Channel, 2021 –2031
Figure 51: Latin America Decaffeinated Coffee Market Value (US$ Mn) Analysis & Forecast by Country, 2021 –2031
Figure 52: Latin America Decaffeinated Coffee Market Volume (Tons) Analysis & Forecast by Country, 2021 –2031
Figure 53: Latin America Decaffeinated Coffee Market Attractiveness Analysis by Region, 2021 -2031
Figure 54: Latin America Decaffeinated Coffee Market Attractiveness Analysis by Nature, 2021 -2031
Figure 55: Latin America Decaffeinated Coffee Market Attractiveness Analysis by Type, 2021-2031
Figure 56: Latin America Decaffeinated Coffee Market Attractiveness Analysis by End Use, 2021 -2031
Figure 57: Latin America Decaffeinated Coffee Market Attractiveness Analysis by Distribution Channel, 2021 -2031
Figure 58: Europe Decaffeinated Coffee Market Value (US$ Mn) Analysis & Forecast by Nature, 2021 –2031
Figure 59: Europe Decaffeinated Coffee Market Volume (Tons) Analysis & Forecast by Nature, 2021 –2031
Figure 60: Europe Decaffeinated Coffee Market Value (US$ Mn) Analysis & Forecast by Type, 2021 –2031
Figure 61: Europe Decaffeinated Coffee Market Volume (Tons) Analysis & Forecast by Type, 2021 –2031
Figure 62: Europe Decaffeinated Coffee Market Value (US$ Mn) Analysis & Forecast by End Use, 2021 –2031
Figure 63: Europe Decaffeinated Coffee Market Volume (Tons) Analysis & Forecast by End Use, 2021 –2031
Figure 64: Europe Decaffeinated Coffee Market Value (US$ Mn) Analysis & Forecast by Distribution Channel, 2021 –2031
Figure 65: Europe Decaffeinated Coffee Market Volume (Tons) Analysis & Forecast by Distribution Channel, 2021 –2031
Figure 66: Europe Decaffeinated Coffee Market Value (US$ Mn) Analysis & Forecast by Country, 2021 –2031
Figure 67: Europe Decaffeinated Coffee Market Volume (Tons) Analysis & Forecast by Country, 2021 –2031
Figure 68: Europe Decaffeinated Coffee Market Attractiveness Analysis by Region, 2021 -2031
Figure 69: Europe Decaffeinated Coffee Market Attractiveness Analysis by Nature, 2021 -2031
Figure 70: Europe Decaffeinated Coffee Market Attractiveness Analysis by Type, 2021-2031
Figure 71: Europe Decaffeinated Coffee Market Attractiveness Analysis by End Use, 2021 -2031
Figure 72: Europe Decaffeinated Coffee Market Attractiveness Analysis by Distribution Channel, 2021 -2031
Figure 73: South Asia Decaffeinated Coffee Market Value (US$ Mn) Analysis & Forecast by Nature, 2021 –2031
Figure 74: South Asia Decaffeinated Coffee Market Volume (Tons) Analysis & Forecast by Nature, 2021 –2031
Figure 75: South Asia Decaffeinated Coffee Market Value (US$ Mn) Analysis & Forecast by Type, 2021 –2031
Figure 76: South Asia Decaffeinated Coffee Market Volume (Tons) Analysis & Forecast by Type, 2021 –2031
Figure 77: South Asia Decaffeinated Coffee Market Value (US$ Mn) Analysis & Forecast by End Use, 2021 –2031
Figure 78: South Asia Decaffeinated Coffee Market Volume (Tons) Analysis & Forecast by End Use, 2021 –2031
Figure 79: South Asia Decaffeinated Coffee Market Value (US$ Mn) Analysis & Forecast by Distribution Channel, 2021 –2031
Figure 80: South Asia Decaffeinated Coffee Market Volume (Tons) Analysis & Forecast by Distribution Channel, 2021 –2031
Figure 81: South Asia Decaffeinated Coffee Market Value (US$ Mn) Analysis & Forecast by Country, 2021 –2031
Figure 82: South Asia Decaffeinated Coffee Market Volume (Tons) Analysis & Forecast by Country, 2021 –2031
Figure 83: South Asia Decaffeinated Coffee Market Attractiveness Analysis by Region, 2021 -2031
Figure 84: South Asia Decaffeinated Coffee Market Attractiveness Analysis by Nature, 2021 -2031
Figure 85: South Asia Decaffeinated Coffee Market Attractiveness Analysis by Type, 2021-2031
Figure 86: South Asia Decaffeinated Coffee Market Attractiveness Analysis by End Use, 2021 -2031
Figure 87: South Asia Decaffeinated Coffee Market Attractiveness Analysis by Distribution Channel, 2021 -2031
Figure 88: East Asia Decaffeinated Coffee Market Value (US$ Mn) Analysis & Forecast by Nature, 2021 –2031
Figure 89: East Asia Decaffeinated Coffee Market Volume (Tons) Analysis & Forecast by Nature, 2021 –2031
Figure 90: East Asia Decaffeinated Coffee Market Value (US$ Mn) Analysis & Forecast by Type, 2021 –2031
Figure 91: East Asia Decaffeinated Coffee Market Volume (Tons) Analysis & Forecast by Type, 2021 –2031
Figure 92: East Asia Decaffeinated Coffee Market Value (US$ Mn) Analysis & Forecast by End Use, 2021 –2031
Figure 93: East Asia Decaffeinated Coffee Market Volume (Tons) Analysis & Forecast by End Use, 2021 –2031
Figure 94: East Asia Decaffeinated Coffee Market Value (US$ Mn) Analysis & Forecast by Distribution Channel, 2021 –2031
Figure 95: East Asia Decaffeinated Coffee Market Volume (Tons) Analysis & Forecast by Distribution Channel, 2021 –2031
Figure 96: East Asia Decaffeinated Coffee Market Value (US$ Mn) Analysis & Forecast by Country, 2021 –2031
Figure 97: East Asia Decaffeinated Coffee Market Volume (Tons) Analysis & Forecast by Country, 2021 –2031
Figure 98: East Asia Decaffeinated Coffee Market Attractiveness Analysis by Region, 2021 -2031
Figure 99: East Asia Decaffeinated Coffee Market Attractiveness Analysis by Nature, 2021 -2031
Figure 100: East Asia Decaffeinated Coffee Market Attractiveness Analysis by Type, 2021-2031
Figure 101: East Asia Decaffeinated Coffee Market Attractiveness Analysis by End Use, 2021 -2031
Figure 102: East Asia Decaffeinated Coffee Market Attractiveness Analysis by Distribution Channel, 2021 -2031
Figure 103: Oceania Decaffeinated Coffee Market Value (US$ Mn) Analysis & Forecast by Nature, 2021 –2031
Figure 104: Oceania Decaffeinated Coffee Market Volume (Tons) Analysis & Forecast by Nature, 2021 –2031
Figure 105: Oceania Decaffeinated Coffee Market Value (US$ Mn) Analysis & Forecast by Type, 2021 –2031
Figure 106: Oceania Decaffeinated Coffee Market Volume (Tons) Analysis & Forecast by Type, 2021 –2031
Figure 107: Oceania Decaffeinated Coffee Market Value (US$ Mn) Analysis & Forecast by End Use, 2021 –2031
Figure 108: Oceania Decaffeinated Coffee Market Volume (Tons) Analysis & Forecast by End Use, 2021 –2031
Figure 109: Oceania Decaffeinated Coffee Market Value (US$ Mn) Analysis & Forecast by Distribution Channel, 2021 –2031
Figure 110: Oceania Decaffeinated Coffee Market Volume (Tons) Analysis & Forecast by Distribution Channel, 2021 –2031
Figure 111: Oceania Decaffeinated Coffee Market Value (US$ Mn) Analysis & Forecast by Country, 2021 –2031
Figure 112: Oceania Decaffeinated Coffee Market Volume (Tons) Analysis & Forecast by Country, 2021 –2031
Figure 113: Oceania Decaffeinated Coffee Market Attractiveness Analysis by Region, 2021 -2031
Figure 114: Oceania Decaffeinated Coffee Market Attractiveness Analysis by Nature, 2021 -2031
Figure 115: Oceania Decaffeinated Coffee Market Attractiveness Analysis by Type, 2021-2031
Figure 116: Oceania Decaffeinated Coffee Market Attractiveness Analysis by End Use, 2021 -2031
Figure 117: Oceania Decaffeinated Coffee Market Attractiveness Analysis by Distribution Channel, 2021 -2031
Figure 118: Middle East & Africa Decaffeinated Coffee Market Value (US$ Mn) Analysis & Forecast by Nature, 2021 –2031
Figure 119: Middle East & Africa Decaffeinated Coffee Market Volume (Tons) Analysis & Forecast by Nature, 2021 –2031
Figure 120: Middle East & Africa Decaffeinated Coffee Market Value (US$ Mn) Analysis & Forecast by Type, 2021 –2031
Figure 121: Middle East & Africa Decaffeinated Coffee Market Volume (Tons) Analysis & Forecast by Type, 2021 –2031
Figure 122: Middle East & Africa Decaffeinated Coffee Market Value (US$ Mn) Analysis & Forecast by End Use, 2021 –2031
Figure 123: Middle East & Africa Decaffeinated Coffee Market Volume (Tons) Analysis & Forecast by End Use, 2021 –2031
Figure 124: Middle East & Africa Decaffeinated Coffee Market Value (US$ Mn) Analysis & Forecast by Distribution Channel, 2021 –2031
Figure 125: Middle East & Africa Decaffeinated Coffee Market Volume (Tons) Analysis & Forecast by Distribution Channel, 2021 –2031
Figure 126: Middle East and Africa Decaffeinated Coffee Market Value (US$ Mn) Analysis & Forecast by Country, 2021 –2031
Figure 127: Middle East and Africa Decaffeinated Coffee Market Volume (Tons) Analysis & Forecast by Country, 2021 –2031
Figure 128: Middle East & Africa Decaffeinated Coffee Market Attractiveness Analysis by Region, 2021 -2031
Figure 129: Middle East & Africa Decaffeinated Coffee Market Attractiveness Analysis by Nature, 2021 -2031
Figure 130: Middle East & Africa Decaffeinated Coffee Market Attractiveness Analysis by Type, 2021-2031
Figure 131: Middle East & Africa Decaffeinated Coffee Market Attractiveness Analysis by End Use, 2021 -2031
Figure 132: Middle East & Africa Decaffeinated Coffee Market Attractiveness Analysis by Distribution Channel, 2021 -2031
Copyright © Transparency Market Research, Inc. All Rights reserved
Trust Online

Decaffeinated Coffee Market
