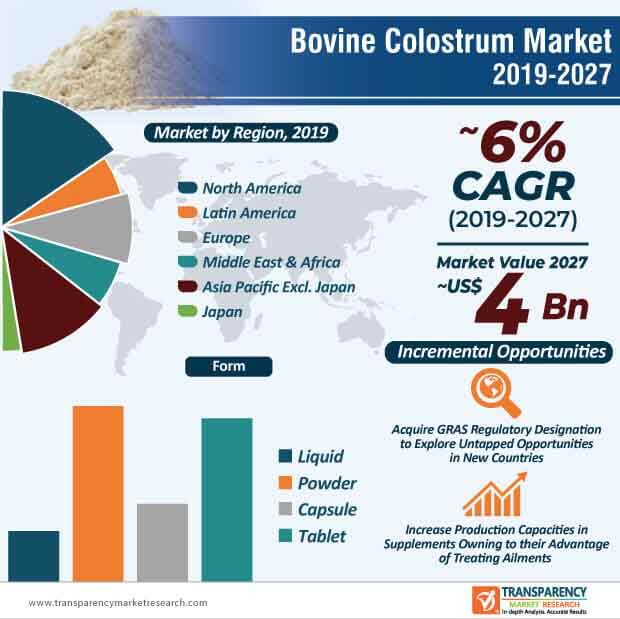
Due to growing awareness about the advantages of bovine colostrum, companies in the market landscape are strategizing ways to capitalize on this trend. For instance, PanTheryx— a U.S.-based pharmaceutical company, announced that the company’s bovine colostrum products have received GRAS (Generally Recognized as Safe), a U.S.-specific FDA regulatory designation for ingredients in foods and beverages. Such developments are triggering the expansion of the bovine colostrum market, which is estimated to reach a revenue of ~US$ 4.3 Bn by the end of 2027.
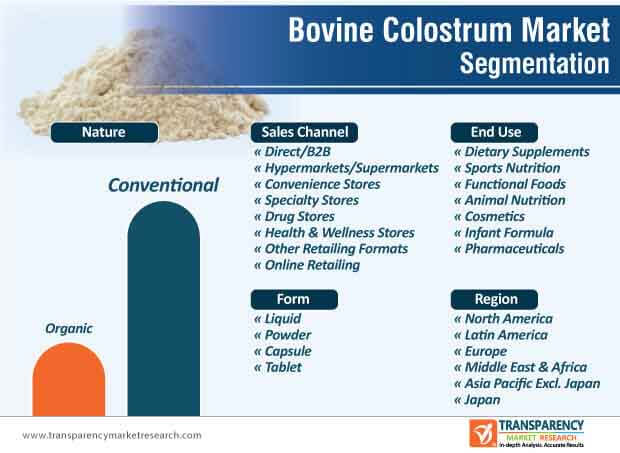
The bovine colostrum market is continuously growing since consumers are becoming aware about the novel milk’s immunity boosting attributes that deliver important health benefits. Hence, manufacturers are introducing the milk in functional foods, beverages, and nutrition bars, among others. This is evident since the functional food end use segment is estimated to lead the global market. Companies are increasing their production capacities to introduce bovine colostrum in yogurts and dietary supplements.
Bovine colostrum supplements are being highly publicized for the treatment of ailments and common diseases. Hence, companies in the market landscape are increasing their production capacities to produce dietary supplements. This explains why the dietary supplements end use segment is estimated to generate third-highest revenue in the bovine colostrum market. Hence, companies are increasing their research efforts to introduce sufficient amount of immunoglobulins in dietary supplements that are beneficial for improving the human digestive tract.
Apart from dietary supplements, companies in the bovine colostrum market are tapping opportunities in infant formula. Manufacturers are increasing efforts to boost the availability of bovine colostrum for extremely preterm infants in case material milk is insufficient. Healthcare providers are suggesting bovine colostrum supplementation in order to increase enteral protein intake in preterm infants without any apparent clinical adverse effects.
The bovine colostrum market is anticipated to progress at a CAGR of ~6.4% during the forecast period. This indicates that companies in the market for bovine colostrum are expanding their business in sports and animal nutrition to generate new revenue streams.
Human colostrum plays a pivotal role in brain development of infants and extremely preterm infants. Human colostrum has the highest concentration of lactose, which is crucial for an infant’s brain development. On the other hand, human colostrum also helps to repair intestinal permeability aka “leaky gut” in infants. However, in many cases, human colostrum is not sufficient to support the physiological growth of infants. In such cases, bovine colostrum plays an important role in brain development and fluid regulation of infants.
Though bovine colostrum is being introduced in dietary supplements, it is being argued that bovine colostrum is more beneficial for newborn calves, as compared to humans, especially adults. Hence, manufacturers in the bovine colostrum market are targeting bovine colostrum products in necessary applications to support the well-being of preterm infants.
Companies in the bovine colostrum market are entering into strategic alliances to innovate in bovine colostrum-based therapies. Renowned U.S. biotechnology companies are setting their collaboration wheels in motion by entering into multimillion-dollar agreements with nutritional dairy companies. For instance, APS Bio Group-a supplier of dietary nutraceuticals and vitamins, has joined forces with VitaDairy, a Vietnamese nutritional dairy company to become the exclusive producer and supplier of bovine colostrum ingredients for the dairy company.
The concept of proprietary colostrum has amplified competition in the bovine colostrum market. Integration of bovine colostrum in dairy goods is not only helping to boost the health of mothers and children, but also promote public health. Manufacturers are aiming to improve the health of consumers in emerging economies. This is evident since this market in Asia Pacific excluding Japan is estimated to generate the highest revenue.
Analysts’ Viewpoint
Immune-boosting properties of bovine colostrum are increasingly catching the attention of consumers in the market landscape. Integration of bovine colostrum in dairy products is one of the most prominent trends in the bovine colostrum market.
Apart from dairy goods, bovine colostrum is acquiring popularity for the development of dietary supplements. However, the use of bovine colostrum in products is raising ethical issues in some regions of the world such as in Brazil, as the novel milk is crucial for the development of newborn calves. Hence, manufacturers should target their products in emerging economies such as Asia Pacific excluding Japan where stakeholders are aiming to better the health of consumers.
Bovine Colostrum Market: Overview
Bovine Colostrum: Market Frontrunners
Bovine Colostrum Market: Trends
Bovine Colostrum Market: Strategies
Target Region for Bovine Colostrum Market
Bovine Colostrum Market: Players
1. Global Bovine Colostrum Market - Executive Summary
1.1. Global Bovine Colostrum Market Country Analysis
1.2. Application – Product Mapping
1.3. Competition Blueprint
1.4. Application Time Line Mapping
1.5. TMR Analysis and Recommendations
2. Market Overview
2.1. Market Introduction
2.2. Market Definition
2.3. Market Taxonomy
3. Key Market Trends
3.1. Key Trends Impacting the Market
3.1.1. Marketers Reach Out to Millennial
3.1.2. Desirable Health Claims by Manufacturers and Brand Owners
3.1.3. Shortened M&A Activity
3.1.4. Heightened Product Launch Frequency
3.1.5. Clean Label Products
3.1.6. Consumer Inclination Towards Natural Products
3.1.7. Rising demand for Organic, Additive-Free, Chemical-Free & Non-GMO products
3.1.8. Growing Demand for Natural Ingredients
3.2. Product Innovation / Development Trends
3.2.1. Cultural Customization to Target Specific Population and Ethnic Group
3.2.2. Creating New Delivery Mechanisms
3.2.3. Indication Specific Products
3.2.4. Shift Toward Natural Ingredients
3.2.5. Preferential Inclination towards Non-Modified Convenience Ingredients
3.2.6. Flavor to Suit Consumer Demand
4. Key Success Factors
4.1. Powerful Portfolio of Brands
4.2. Nuanced Marketing Campaigns
4.3. Exploiting Economies of Scale
4.4. Establishing Flexible Supply Chain to Optimize on Miracle Ingredients/ Products
4.5. Working in Close Vicinity of Policy
4.6. Strategic Promotional Activity
5. Product Launch Track & Trends
5.1. Key Product Launches in Last Three Years
5.2. Product Launch Frequency
5.3. Type of Launches
5.4. Regions and Countries in Focus
6. Market Dynamics
6.1. Bovine Colostrum: Miracle Ingredient
6.2. Bovine Colostrum and Nutraceutical Industry
6.3. Overview on Dietary Supplements
6.4. Macro-economic Factors
6.4.1. Rise in Consumption of Food Items across Globe
6.4.2. Global and Regional Per Capita Food Consumption (kcal per capita per day)
6.4.3. Change in Consumer Price Indexes (Percentage Change) 2018 (Forecast)
6.4.4. Population of Key Countries
6.4.5. Global Retail Dynamics
6.4.6. Per Capita Disposable Income
6.4.7. Global GDP Growth Outlook
6.4.8. Retail Sector GVA and Growth
6.4.9. Nutraceutical Industry Overview
6.4.10. Dietary Supplements Growth and GVA
6.4.11. Cosmetic and Personal Care Industry Growth and GVA
6.4.12. Others
6.5. Drivers
6.6. Market Restraints
6.7. Market Opportunities
6.8. Forecast Factors – Relevance and Impact
6.9. Key Regulations and Claims
7. Global Bovine Colostrum Market Analysis and Forecast
7.1. Market Size Analysis (2013-2018) and Forecast (2019-2027)
7.1.1. Market Value (US$ Mn) and Volume (Tons) and Y-o-Y Growth
7.1.2. Absolute $ Opportunity
7.2. Global Bovine Colostrum Market Scenario Forecast (Optimistic, Likely and Conservative Market Conditions)
7.2.1. Forecast Factors and Relevance of Impact
8. Supply Chain Analysis
8.1. Profitability and Gross Margin Analysis By Competition
8.2. List of Active Participants- By Region
8.2.1. Raw Material Suppliers
8.2.2. Key Manufacturers
8.2.3. Key Distributor/Retailers
8.2.4. Operating Margins
9. Global Bovine Colostrum Market Pricing Analysis
9.1. Price Point Assessment by Region
9.1.1. Manufacturer Level Pricing
9.1.2. Distributor Level Pricing
9.1.3. Retailer Level Pricing
9.2. Price Point Assessment by Form/ Nature
9.3. Price Forecast till 2029
10. Global Bovine Colostrum Market Analysis and Forecast
10.1. Market Size Analysis (2013-2018) and Forecast (2019-2027)
10.1.1. Market Value (US$ Mn) and Volume (Tons) and Y-o-Y Growth
10.1.2. Absolute $ Opportunity
10.2. Global Bovine Colostrum Market Scenario Forecast (Optimistic, Likely and Conservative Market Conditions)
10.2.1. Forecast Factors and Relevance of Impact
10.2.2. Regional Bovine Colostrum Market Business Performance Summary
11. Global Bovine Colostrum Market Analysis By Nature
11.1. Introduction
11.1.1. Y-o-Y Growth Comparison By Nature
11.1.2. Basis Point Share (BPS) Analysis By Nature
11.2. Bovine Colostrum Market Size (US$ Mn) and Volume (MT) Analysis (2013-2018) & Forecast (2019-2027) By Nature
11.2.1. Organic
11.2.2. Conventional
11.3. Market Attractiveness Analysis By Nature
12. Global Bovine Colostrum Market Analysis By Form
12.1. Introduction
12.1.1. Y-o-Y Growth Comparison By Form
12.1.2. Basis Point Share (BPS) Analysis By Form
12.2. Bovine Colostrum Market Size (US$ Mn) and Volume (MT) Analysis (2013-2018) & Forecast (2019-2027) By Form
12.2.1. Liquid
12.2.2. Powder
12.2.3. Capsules
12.2.4. Tablets
12.3. Market Attractiveness Analysis By Form
13. Global Bovine Colostrum Market Analysis By End-use
13.1. Introduction
13.1.1. Y-o-Y Growth Comparison By End-use
13.1.2. Basis Point Share (BPS) Analysis By End-use
13.2. Bovine Colostrum Market Size (US$ Mn) and Volume (MT) Analysis (2013-2018) & Forecast (2019-2027) By End-use
13.2.1. Dietary Supplement
13.2.2. Sports Nutrition
13.2.3. Functional Food
13.2.4. Animal Nutrition
13.2.5. Cosmetics
13.2.6. Infant Formula
13.2.7. Pharmaceuticals
13.3. Market Attractiveness Analysis By End-use
14. Global Bovine Colostrum Market Analysis By Sales Channel
14.1. Introduction
14.1.1. Y-o-Y Growth Comparison By Sales Channel
14.1.2. Basis Point Share (BPS) Analysis By Sales Channel
14.2. Bovine Colostrum Market Size (US$ Mn) and Volume (MT) Analysis (2013-2018) & Forecast (2019-2027) By Sales Channel
14.2.1. Direct/B2B
14.2.2. Hypermarket/Supermarket
14.2.3. Convenience Store
14.2.4. Specialty Store
14.2.5. Drug Stores
14.2.6. Health & Wellness Stores
14.2.7. Other Retailing Format
14.2.8. Online Retailing
14.3. Market Attractiveness Analysis By Sales Channel
15. Global Bovine Colostrum Market Analysis and Forecast, By Region
15.1. Introduction
15.1.1. Basis Point Share (BPS) Analysis By Region
15.1.2. Y-o-Y Growth Projections By Region
15.2. Bovine Colostrum Market Size (US$ Mn) and Volume (MT) & Forecast (2019-2027) Analysis By Region
15.2.1. North America
15.2.2. Latin America
15.2.3. Europe
15.2.4. Middle East and Africa
15.2.5. APEJ
15.2.6. Japan
15.3. Market Attractiveness Analysis By Region
16. North America Bovine Colostrum Market Analysis and Forecast
16.1. Introduction
16.1.1. Basis Point Share (BPS) Analysis By Country
16.1.2. Y-o-Y Growth Projections By Country
16.2. Bovine Colostrum Market Size (Value (US$) and Volume (MT) Analysis (2013-2018) and Forecast (2019-2027)
16.2.1. Market Attractiveness By Country
16.2.1.1. U.S.
16.2.1.2. Canada
16.2.2. By Nature
16.2.3. By Form
16.2.4. By End-use
16.2.5. By Sales Channel
16.3. Market Attractiveness Analysis
16.3.1. By Country
16.3.2. By Nature
16.3.3. By Form
16.3.4. By End-use
16.3.5. By Sales Channel
17. Latin America Bovine Colostrum Market Analysis and Forecast
17.1. Introduction
17.1.1. Basis Point Share (BPS) Analysis By Country
17.1.2. Y-o-Y Growth Projections By Country
17.1.3. Key Regulations
17.2. Bovine Colostrum Market Size (Value (US$) and Volume (MT) Analysis (2013-2018) and Forecast (2019-2027)
17.2.1. By Country
17.2.1.1. Brazil
17.2.1.2. Mexico
17.2.1.3. Argentina
17.2.1.4. Rest of Latin America
17.2.2. By Nature
17.2.3. By Form
17.2.4. By End-use
17.2.5. By Sales Channel
17.3. Market Attractiveness Analysis
17.3.1. By Country
17.3.2. By Nature
17.3.3. By Form
17.3.4. By End-use
17.3.5. By Sales Channel
18. Europe Bovine Colostrum Market Analysis and Forecast
18.1. Introduction
18.1.1. Basis Point Share (BPS) Analysis By Country
18.1.2. Y-o-Y Growth Projections By Country
18.1.3. Key Regulations
18.2. Bovine Colostrum Market Size (Value (US$) and Volume (MT) Analysis (2013-2018) and Forecast (2019-2027)
18.2.1. By Country
18.2.1.1. EU-4 (Germany, France, Italy, Spain)
18.2.1.2. U.K.
18.2.1.3. BENELUX
18.2.1.4. Nordic
18.2.1.5. Eastern Europe
18.2.1.6. Rest of Europe
18.2.2. By Nature
18.2.3. By Form
18.2.4. By End-use
18.2.5. By Sales Channel
18.3. Market Attractiveness Analysis
18.3.1. By Country
18.3.2. By Nature
18.3.3. By Form
18.3.4. By End-use
18.3.5. By Sales Channel
19. Middle East and Africa (MEA) Bovine Colostrum Market Analysis and Forecast
19.1. Introduction
19.1.1. Basis Point Share (BPS) Analysis By Country
19.1.2. Y-o-Y Growth Projections By Country
19.1.3. Key Regulations
19.2. Bovine Colostrum Market Size (Value (US$) and Volume (MT) Analysis (2013-2018) and Forecast (2019-2027)
19.2.1. By Country
19.2.1.1. GCC Countries
19.2.1.2. South Africa
19.2.1.3. Rest of MEA
19.2.2. By Nature
19.2.3. By Form
19.2.4. By Animal Type
19.2.5. By End-use
19.2.6. By Sales Channel
19.3. Market Attractiveness Analysis
19.3.1. By Country
19.3.2. By Nature
19.3.3. By Form
19.3.4. By End-use
19.3.5. By Sales Channel
19.4. Drivers and Restraints: Impact Analysis
19.5. Heat Map Analysis
19.6. Market Trends
20. APEJ Bovine Colostrum Market Analysis and Forecast
20.1. Introduction
20.1.1. Basis Point Share (BPS) Analysis By Country
20.1.2. Y-o-Y Growth Projections By Country
20.1.3. Key Regulations
20.2. Bovine Colostrum Market Size (Value (US$) and Volume (MT) Analysis (2013-2018) and Forecast (2019-2027)
20.2.1. By Country
20.2.1.1. China
20.2.1.2. India
20.2.1.3. ASEAN Countries
20.2.1.4. Australia
20.2.1.5. Rest of APEJ
20.2.2. By Nature
20.2.3. By Form
20.2.4. By End-use
20.2.5. By Sales Channel
20.3. Market Attractiveness Analysis
20.3.1. By Country
20.3.2. By Nature
20.3.3. By Form
20.3.4. By End-use
20.3.5. By Sales Channel
21. Japan Bovine Colostrum Market Analysis and Forecast
21.1. Introduction
21.1.1. Basis Point Share (BPS) Analysis By Country
21.1.2. Y-o-Y Growth Projections By Country
21.1.3. Key Regulations
21.2. Bovine Colostrum Market Size (Value (US$) and Volume (MT) Analysis (2013-2018) and Forecast (2019-2027)
21.2.1. By Nature
21.2.2. By Form
21.2.3. By End-use
21.2.4. By Sales Channel
21.3. Market Attractiveness Analysis
21.3.1. By Nature
21.3.2. By Form
21.3.3. By End-use
21.3.4. By Sales Channel
22. Brand Assessment
22.1. Brand Identity (Brand as Product, Brand as Organization, Brand as Person, Brand as Symbol)
22.2. Target Audience and Positioning (Demographic Segmentation, Geographic Segmentation, Psychographic Segmentation, Situational Segmentation)
22.3. Brand Strategy
23. Competition Assessment
23.1. Global Bovine Colostrum Market Competition - a Dashboard View
23.2. Global Bovine Colostrum Market Structure Analysis
23.3. Global Bovine Colostrum Market Company Share Analysis
23.3.1. For Tier 1 Market Players, 2019
23.3.2. Company Market Share Analysis of Top 5 Players, By Region
23.4. Key Participants Market Presence (Intensity Mapping) by Region
24. Competition Deep-dive
24.1. NOW Health Group, Inc.
24.1.1. Overview
24.1.2. Product Portfolio
24.1.3. Sales Footprint
24.1.4. Channel Footprint
24.1.4.1. Distributors List
24.1.4.2. Sales Channel (Clients)
24.1.5. Strategy Overview
24.1.5.1. Marketing Strategy
24.1.5.2. Culture Strategy
24.1.5.3. Channel Strategy
24.1.6. SWOT Analysis
24.1.7. Financial Analysis
24.1.8. Revenue Share
24.1.9. Key Clients
24.1.10. Analyst Comments
24.2. BIN Science LLC
24.2.1. Overview
24.2.2. Product Portfolio
24.2.3. Sales Footprint
24.2.4. Channel Footprint
24.2.4.1. Distributors List
24.2.4.2. Sales Channel (Clients)
24.2.5. Strategy Overview
24.2.5.1. Marketing Strategy
24.2.5.2. Culture Strategy
24.2.5.3. Channel Strategy
24.2.6. SWOT Analysis
24.2.7. Financial Analysis
24.2.8. Revenue Share
24.2.9. Key Clients
24.2.10. Analyst Comments
24.3. Sovereign Laboratories
24.3.1. Overview
24.3.2. Product Portfolio
24.3.3. Sales Footprint
24.3.4. Channel Footprint
24.3.4.1. Distributors List
24.3.4.2. Sales Channel (Clients)
24.3.5. Strategy Overview
24.3.5.1. Marketing Strategy
24.3.5.2. Culture Strategy
24.3.5.3. Channel Strategy
24.3.6. SWOT Analysis
24.3.7. Financial Analysis
24.3.8. Revenue Share
24.3.9. Key Clients
24.3.10. Analyst Comments
24.4. APS Biogroup
24.4.1. Overview
24.4.2. Product Portfolio
24.4.3. Sales Footprint
24.4.4. Channel Footprint
24.4.4.1. Distributors List
24.4.4.2. Sales Channel (Clients)
24.4.5. Strategy Overview
24.4.5.1. Marketing Strategy
24.4.5.2. Culture Strategy
24.4.5.3. Channel Strategy
24.4.6. SWOT Analysis
24.4.7. Financial Analysis
24.4.8. Revenue Share
24.4.9. Key Clients
24.4.10. Analyst Comments
24.5. Jarrow Formulas, Inc.
24.5.1. Overview
24.5.2. Product Portfolio
24.5.3. Sales Footprint
24.5.4. Channel Footprint
24.5.4.1. Distributors List
24.5.4.2. Sales Channel (Clients)
24.5.5. Strategy Overview
24.5.5.1. Marketing Strategy
24.5.5.2. Culture Strategy
24.5.5.3. Channel Strategy
24.5.6. SWOT Analysis
24.5.7. Financial Analysis
24.5.8. Revenue Share
24.5.9. Key Clients
24.5.10. Analyst Comments
24.6. APS Biogroup
24.6.1. Overview
24.6.2. Product Portfolio
24.6.3. Sales Footprint
24.6.4. Channel Footprint
24.6.4.1. Distributors List
24.6.4.2. Sales Channel (Clients)
24.6.5. Strategy Overview
24.6.5.1. Marketing Strategy
24.6.5.2. Culture Strategy
24.6.5.3. Channel Strategy
24.6.6. SWOT Analysis
24.6.7. Financial Analysis
24.6.8. Revenue Share
24.6.9. Key Clients
24.6.10. Analyst Comments
24.7. Genceutic Naturals
24.7.1. Overview
24.7.2. Product Portfolio
24.7.3. Sales Footprint
24.7.4. Channel Footprint
24.7.4.1. Distributors List
24.7.4.2. Sales Channel (Clients)
24.7.5. Strategy Overview
24.7.5.1. Marketing Strategy
24.7.5.2. Culture Strategy
24.7.5.3. Channel Strategy
24.7.6. SWOT Analysis
24.7.7. Financial Analysis
24.7.8. Revenue Share
24.7.9. Key Clients
24.7.10. Analyst Comments
24.8. Biostrum Nutritech Pvt. Ltd.
24.8.1. Overview
24.8.2. Product Portfolio
24.8.3. Sales Footprint
24.8.4. Channel Footprint
24.8.4.1. Distributors List
24.8.4.2. Sales Channel (Clients)
24.8.5. Strategy Overview
24.8.5.1. Marketing Strategy
24.8.5.2. Culture Strategy
24.8.5.3. Channel Strategy
24.8.6. SWOT Analysis
24.8.7. Financial Analysis
24.8.8. Revenue Share
24.8.9. Key Clients
24.8.10. Analyst Comments
24.9. Vivesa holding s.r.o.
24.9.1. Overview
24.9.2. Product Portfolio
24.9.3. Sales Footprint
24.9.4. Channel Footprint
24.9.4.1. Distributors List
24.9.4.2. Sales Channel (Clients)
24.9.5. Strategy Overview
24.9.5.1. Marketing Strategy
24.9.5.2. Culture Strategy
24.9.5.3. Channel Strategy
24.9.6. SWOT Analysis
24.9.7. Financial Analysis
24.9.8. Revenue Share
24.9.9. Key Clients
24.9.10. Analyst Comments
24.10. Cure Nutraceutical PVT. LTD
24.10.1. Overview
24.10.2. Product Portfolio
24.10.3. Sales Footprint
24.10.4. Channel Footprint
24.10.4.1. Distributors List
24.10.4.2. Sales Channel (Clients)
24.10.5. Strategy Overview
24.10.5.1. Marketing Strategy
24.10.5.2. Culture Strategy
24.10.5.3. Channel Strategy
24.10.6. SWOT Analysis
24.10.7. Financial Analysis
24.10.8. Revenue Share
24.10.9. Key Clients
24.10.10. Analyst Comments
24.11. Biodane Pharma A/S,
24.11.1. Overview
24.11.2. Product Portfolio
24.11.3. Sales Footprint
24.11.4. Channel Footprint
24.11.4.1. Distributors List
24.11.4.2. Sales Channel (Clients)
24.11.5. Strategy Overview
24.11.5.1. Marketing Strategy
24.11.5.2. Culture Strategy
24.11.5.3. Channel Strategy
24.11.6. SWOT Analysis
24.11.7. Financial Analysis
24.11.8. Revenue Share
24.11.9. Key Clients
24.11.10. Analyst Comments
24.12. Agati Healthcare Pvt Ltd
24.12.1. Overview
24.12.2. Product Portfolio
24.12.3. Sales Footprint
24.12.4. Channel Footprint
24.12.4.1. Distributors List
24.12.4.2. Sales Channel (Clients)
24.12.5. Strategy Overview
24.12.5.1. Marketing Strategy
24.12.5.2. Culture Strategy
24.12.5.3. Channel Strategy
24.12.6. SWOT Analysis
24.12.7. Financial Analysis
24.12.8. Revenue Share
24.12.9. Key Clients
24.12.10. Analyst Comments
24.13. PuraLife, LLC.
24.13.1. Overview
24.13.2. Product Portfolio
24.13.3. Sales Footprint
24.13.4. Channel Footprint
24.13.4.1. Distributors List
24.13.4.2. Sales Channel (Clients)
24.13.5. Strategy Overview
24.13.5.1. Marketing Strategy
24.13.5.2. Culture Strategy
24.13.5.3. Channel Strategy
24.13.6. SWOT Analysis
24.13.7. Financial Analysis
24.13.8. Revenue Share
24.13.9. Key Clients
24.13.10. Analyst Comments
24.14. Bionatin Bv
24.14.1. Overview
24.14.2. Product Portfolio
24.14.3. Sales Footprint
24.14.4. Channel Footprint
24.14.4.1. Distributors List
24.14.4.2. Sales Channel (Clients)
24.14.5. Strategy Overview
24.14.5.1. Marketing Strategy
24.14.5.2. Culture Strategy
24.14.5.3. Channel Strategy
24.14.6. SWOT Analysis
24.14.7. Financial Analysis
24.14.8. Revenue Share
24.14.9. Key Clients
24.14.10. Analyst Comments
24.15. Farbest Brands
24.15.1. Overview
24.15.2. Product Portfolio
24.15.3. Sales Footprint
24.15.4. Channel Footprint
24.15.4.1. Distributors List
24.15.4.2. Sales Channel (Clients)
24.15.5. Strategy Overview
24.15.5.1. Marketing Strategy
24.15.5.2. Culture Strategy
24.15.5.3. Channel Strategy
24.15.6. SWOT Analysis
24.15.7. Financial Analysis
24.15.8. Revenue Share
24.15.9. Key Clients
24.15.10. Analyst Comments
24.16. MIP Colostrum NZ
24.16.1. Overview
24.16.2. Product Portfolio
24.16.3. Sales Footprint
24.16.4. Channel Footprint
24.16.4.1. Distributors List
24.16.4.2. Sales Channel (Clients)
24.16.5. Strategy Overview
24.16.5.1. Marketing Strategy
24.16.5.2. Culture Strategy
24.16.5.3. Channel Strategy
24.16.6. SWOT Analysis
24.16.7. Financial Analysis
24.16.8. Revenue Share
24.16.9. Key Clients
24.16.10. Analyst Comments
25. Recommendation- Critical Success Factors
26. Research Methodology
27. Assumptions & Acronyms Used
List of Tables
Table 1: Global Bovine Colostrum Market Historical Value (US$ Mn) Analysis by Nature, 2013-2018
Table 2: Global Bovine Colostrum Market Historical Volume (MT) Analysis by Nature, 2013-2018
Table 3: Global Bovine Colostrum Market forecast Value (US$ Mn) Analysis by Nature, 2019-2027
Table 4: Global Bovine Colostrum Market Forecast Volume (MT) Analysis by Nature, 2019-2027
Table 5: Global Bovine Colostrum Market Historical Value (US$ Mn) Analysis by Form, 2013-2018
Table 6: Global Bovine Colostrum Market Historical Volume (MT) Analysis by Form, 2013-2018
Table 7: Global Bovine Colostrum Market Forecast Value (US$ Mn) Analysis by Form, 2019-2027
Table 8: Global Bovine Colostrum Market Forecast Volume (MT) Analysis by Form, 2019-2027
Table 9: Global Bovine Colostrum Market Historical Value (US$ Mn) Analysis by End-Use, 2013-2018
Table 10: Global Bovine Colostrum Market Historical Volume (MT) Analysis by End-Use, 2013-2018
Table 11: Global Bovine Colostrum Market Forecast Value (US$ Mn) Analysis by End-Use, 2019-2027
Table 12: Global Bovine Colostrum Market Forecast Volume (MT) Analysis by End-Use, 2019-2027
Table 13: Global Bovine Colostrum Market Historical Value (US$ Mn) Analysis by Sales Channel, 2013-2018
Table 14: Global Bovine Colostrum Market Historical Volume (MT) Analysis by Sales Channel, 2013-2018
Table 15: Global Bovine Colostrum Market Forecast Value (US$ Mn) Analysis by Sales Channel, 2019-2027
Table 16: Global Bovine Colostrum Market Forecast Volume (MT) Analysis by Sales Channel, 2019-2027
Table 17: Global Bovine Colostrum Market Historical Value (US$ Mn) Analysis by Region, 2013-2018
Table 18: Global Bovine Colostrum Market Historical Volume (MT) Analysis by Region, 2013-2018
Table 19: Global Bovine ColostrumMarket Forecast Value (US$ Mn) Analysis by Region, 2019-2027
Table 20: Global Bovine Colostrum Market Forecast Volume (MT) Analysis by Region, 2019-2027
Table 21: North America Bovine Colostrum Market Historical Value (US$ Mn) Analysis by Nature, 2013-2018
Table 22: North America Bovine Colostrum Market Historical Volume (MT) Analysis by Nature, 2013-2018
Table 23: North America Bovine Colostrum Market forecast Value (US$ Mn) Analysis by Nature, 2019-2027
Table 24: North America Bovine Colostrum Market Forecast Volume (MT) Analysis by Nature, 2019-2027
Table 25: North America Bovine Colostrum Market Historical Value (US$ Mn) Analysis by Form, 2013-2018
Table 26: North America Bovine Colostrum Market Historical Volume (MT) Analysis by Form, 2013-2018
Table 27: North America Bovine Colostrum Market Forecast Value (US$ Mn) Analysis by Form, 2019-2027
Table 28: North America Bovine Colostrum Market Forecast Volume (MT) Analysis by Form, 2019-2027
Table 29: North America Bovine Colostrum Market Historical Value (US$ Mn) Analysis by End-Use, 2013-2018
Table 30: North America Bovine Colostrum Market Historical Volume (MT) Analysis by End-Use, 2013-2018
Table 31: North America Bovine Colostrum Market Forecast Value (US$ Mn) Analysis by End-Use, 2019-2027
Table 32: North America Bovine Colostrum Market Forecast Volume (MT) Analysis by End-Use, 2019-2027
Table 33: North America Bovine Colostrum Market Historical Value (US$ Mn) Analysis by Sales Channel, 2013-2018
Table 34: North America Bovine Colostrum Market Historical Volume (MT) Analysis by Sales Channel, 2013-2018
Table 35: North America Bovine Colostrum Market Forecast Value (US$ Mn) Analysis by Sales Channel, 2019-2027
Table 36: North America Bovine Colostrum Market Forecast Volume (MT) Analysis by Sales Channel, 2019-2027
Table 37: North America Bovine Colostrum Market Historical Value (US$ Mn) Analysis by Country, 2013-2018
Table 38: North America Bovine Colostrum Market Historical Volume (MT) Analysis by Country, 2013-2018
Table 39: North America Bovine ColostrumMarket Forecast Value (US$ Mn) Analysis by Country, 2019-2027
Table 40: North America Bovine Colostrum Market Forecast Volume (MT) Analysis by Country, 2019-2027
Table 41: Latin America Bovine Colostrum Market Historical Value (US$ Mn) Analysis by Nature, 2013-2018
Table 42: Latin America Bovine Colostrum Market Historical Volume (MT) Analysis by Nature, 2013-2018
Table 43: Latin America Bovine Colostrum Market forecast Value (US$ Mn) Analysis by Nature, 2019-2027
Table 44: Latin America Bovine Colostrum Market Forecast Volume (MT) Analysis by Nature, 2019-2027
Table 45: Latin America Bovine Colostrum Market Historical Value (US$ Mn) Analysis by Form, 2013-2018
Table 46: Latin America Bovine Colostrum Market Historical Volume (MT) Analysis by Form, 2013-2018
Table 47: Latin America Bovine Colostrum Market Forecast Value (US$ Mn) Analysis by Form, 2019-2027
Table 48: Latin America Bovine Colostrum Market Forecast Volume (MT) Analysis by Form, 2019-2027
Table 49: Latin America Bovine Colostrum Market Historical Value (US$ Mn) Analysis by End-Use, 2013-2018
Table 50: Latin America Bovine Colostrum Market Historical Volume (MT) Analysis by End-Use, 2013-2018
Table 51: Latin America Bovine Colostrum Market Forecast Value (US$ Mn) Analysis by End-Use, 2019-2027
Table 52: Latin America Bovine Colostrum Market Forecast Volume (MT) Analysis by End-Use, 2019-2027
Table 53: Latin America Bovine Colostrum Market Historical Value (US$ Mn) Analysis by Sales Channel, 2013-2018
Table 54: Latin America Bovine Colostrum Market Historical Volume (MT) Analysis by Sales Channel, 2013-2018
Table 55: Latin America Bovine Colostrum Market Forecast Value (US$ Mn) Analysis by Sales Channel, 2019-2027
Table 56: Latin America Bovine Colostrum Market Forecast Volume (MT) Analysis by Sales Channel, 2019-2027
Table 57: Latin America Bovine Colostrum Market Historical Value (US$ Mn) Analysis by Country, 2013-2018
Table 58: Latin America Bovine Colostrum Market Historical Volume (MT) Analysis by Country, 2013-2018
Table 59: Latin America Bovine ColostrumMarket Forecast Value (US$ Mn) Analysis by Country, 2019-2027
Table 60: Latin America Bovine Colostrum Market Forecast Volume (MT) Analysis by Country, 2019-2027
Table 61: Europe Bovine Colostrum Market Historical Value (US$ Mn) Analysis by Nature, 2013-2018
Table 62: Europe Bovine Colostrum Market Historical Volume (MT) Analysis by Nature, 2013-2018
Table 63: Europe Bovine Colostrum Market forecast Value (US$ Mn) Analysis by Nature, 2019-2027
Table 64: Europe Bovine Colostrum Market Forecast Volume (MT) Analysis by Nature, 2019-2027
Table 65: Europe Bovine Colostrum Market Historical Value (US$ Mn) Analysis by Form, 2013-2018
Table 66: Europe Bovine Colostrum Market Historical Volume (MT) Analysis by Form, 2013-2018
Table 67: Europe Bovine Colostrum Market Forecast Value (US$ Mn) Analysis by Form, 2019-2027
Table 68: Europe Bovine Colostrum Market Forecast Volume (MT) Analysis by Form, 2019-2027
Table 69: Europe Bovine Colostrum Market Historical Value (US$ Mn) Analysis by End-Use, 2013-2018
Table 70: Europe Bovine Colostrum Market Historical Volume (MT) Analysis by End-Use, 2013-2018
Table 71: Europe Bovine Colostrum Market Forecast Value (US$ Mn) Analysis by End-Use, 2019-2027
Table 72: Europe Bovine Colostrum Market Forecast Volume (MT) Analysis by End-Use, 2019-2027
Table 73: Europe Bovine Colostrum Market Historical Value (US$ Mn) Analysis by Sales Channel, 2013-2018
Table 74: Europe Bovine Colostrum Market Historical Volume (MT) Analysis by Sales Channel, 2013-2018
Table 75: Europe Bovine Colostrum Market Forecast Value (US$ Mn) Analysis by Sales Channel, 2019-2027
Table 76: Europe Bovine Colostrum Market Forecast Volume (MT) Analysis by Sales Channel, 2019-2027
Table 77: Europe Bovine Colostrum Market Historical Value (US$ Mn) Analysis by Country, 2013-2018
Table 78: Europe Bovine Colostrum Market Historical Volume (MT) Analysis by Country, 2013-2018
Table 79: Europe Bovine ColostrumMarket Forecast Value (US$ Mn) Analysis by Country, 2019-2027
Table 80: Europe Bovine Colostrum Market Forecast Volume (MT) Analysis by Country, 2019-2027
Table 81: MEA Bovine Colostrum Market Historical Value (US$ Mn) Analysis by Nature, 2013-2018
Table 82: MEA Bovine Colostrum Market Historical Volume (MT) Analysis by Nature, 2013-2018
Table 83: MEA Bovine Colostrum Market forecast Value (US$ Mn) Analysis by Nature, 2019-2027
Table 84: MEA Bovine Colostrum Market Forecast Volume (MT) Analysis by Nature, 2019-2027
Table 85: MEA Bovine Colostrum Market Historical Value (US$ Mn) Analysis by Form, 2013-2018
Table 86: MEA Bovine Colostrum Market Historical Volume (MT) Analysis by Form, 2013-2018
Table 87: MEA Bovine Colostrum Market Forecast Value (US$ Mn) Analysis by Form, 2019-2027
Table 88: MEA Bovine Colostrum Market Forecast Volume (MT) Analysis by Form, 2019-2027
Table 89: MEA Bovine Colostrum Market Historical Value (US$ Mn) Analysis by End-Use, 2013-2018
Table 90: MEA Bovine Colostrum Market Historical Volume (MT) Analysis by End-Use, 2013-2018
Table 91: MEA Bovine Colostrum Market Forecast Value (US$ Mn) Analysis by End-Use, 2019-2027
Table 92: MEA Bovine Colostrum Market Forecast Volume (MT) Analysis by End-Use, 2019-2027
Table 93: MEA Bovine Colostrum Market Historical Value (US$ Mn) Analysis by Sales Channel, 2013-2018
Table 94: MEA Bovine Colostrum Market Historical Volume (MT) Analysis by Sales Channel, 2013-2018
Table 95: MEA Bovine Colostrum Market Forecast Value (US$ Mn) Analysis by Sales Channel, 2019-2027
Table 96: MEA Bovine Colostrum Market Forecast Volume (MT) Analysis by Sales Channel, 2019-2027
Table 97: MEA Bovine Colostrum Market Historical Value (US$ Mn) Analysis by Country, 2013-2018
Table 98: MEA Bovine Colostrum Market Historical Volume (MT) Analysis by Country, 2013-2018
Table 99: MEA Bovine ColostrumMarket Forecast Value (US$ Mn) Analysis by Country, 2019-2027
Table 100: MEA Bovine Colostrum Market Forecast Volume (MT) Analysis by Country, 2019-2027
Table 101: APEJ Bovine Colostrum Market Historical Value (US$ Mn) Analysis by Nature, 2013-2018
Table 102: APEJ Bovine Colostrum Market Historical Volume (MT) Analysis by Nature, 2013-2018
Table 103: APEJ Bovine Colostrum Market forecast Value (US$ Mn) Analysis by Nature, 2019-2027
Table 104: APEJ Bovine Colostrum Market Forecast Volume (MT) Analysis by Nature, 2019-2027
Table 105: APEJ Bovine Colostrum Market Historical Value (US$ Mn) Analysis by Form, 2013-2018
Table 106: APEJ Bovine Colostrum Market Historical Volume (MT) Analysis by Form, 2013-2018
Table 107: APEJ Bovine Colostrum Market Forecast Value (US$ Mn) Analysis by Form, 2019-2027
Table 108: APEJ Bovine Colostrum Market Forecast Volume (MT) Analysis by Form, 2019-2027
Table 109: APEJ Bovine Colostrum Market Historical Value (US$ Mn) Analysis by End-Use, 2013-2018
Table 110: APEJ Bovine Colostrum Market Historical Volume (MT) Analysis by End-Use, 2013-2018
Table 111: APEJ Bovine Colostrum Market Forecast Value (US$ Mn) Analysis by End-Use, 2019-2027
Table 112: APEJ Bovine Colostrum Market Forecast Volume (MT) Analysis by End-Use, 2019-2027
Table 113: APEJ Bovine Colostrum Market Historical Value (US$ Mn) Analysis by Sales Channel, 2013-2018
Table 114: APEJ Bovine Colostrum Market Historical Volume (MT) Analysis by Sales Channel, 2013-2018
Table 115: APEJ Bovine Colostrum Market Forecast Value (US$ Mn) Analysis by Sales Channel, 2019-2027
Table 116: APEJ Bovine Colostrum Market Forecast Volume (MT) Analysis by Sales Channel, 2019-2027
Table 117: APEJ Bovine Colostrum Market Historical Value (US$ Mn) Analysis by Country, 2013-2018
Table 118: APEJ Bovine Colostrum Market Historical Volume (MT) Analysis by Country, 2013-2018
Table 119: APEJ Bovine ColostrumMarket Forecast Value (US$ Mn) Analysis by Country, 2019-2027
Table 120: APEJ Bovine Colostrum Market Forecast Volume (MT) Analysis by Country, 2019-2027
Table 121: Japan Bovine Colostrum Market Historical Value (US$ Mn) Analysis by Nature, 2013-2018
Table 122: Japan Bovine Colostrum Market Historical Volume (MT) Analysis by Nature, 2013-2018
Table 123: Japan Bovine Colostrum Market forecast Value (US$ Mn) Analysis by Nature, 2019-2027
Table 124: Japan Bovine Colostrum Market Forecast Volume (MT) Analysis by Nature, 2019-2027
Table 125: Japan Bovine Colostrum Market Historical Value (US$ Mn) Analysis by Form, 2013-2018
Table 126: Japan Bovine Colostrum Market Historical Volume (MT) Analysis by Form, 2013-2018
Table 127: Japan Bovine Colostrum Market Forecast Value (US$ Mn) Analysis by Form, 2019-2027
Table 128: Japan Bovine Colostrum Market Forecast Volume (MT) Analysis by Form, 2019-2027
Table 129: Japan Bovine Colostrum Market Historical Value (US$ Mn) Analysis by End-Use, 2013-2018
Table 130: Japan Bovine Colostrum Market Historical Volume (MT) Analysis by End-Use, 2013-2018
Table 131: Japan Bovine Colostrum Market Forecast Value (US$ Mn) Analysis by End-Use, 2019-2027
Table 132: Japan Bovine Colostrum Market Forecast Volume (MT) Analysis by End-Use, 2019-2027
Table 133: Japan Bovine Colostrum Market Historical Value (US$ Mn) Analysis by Sales Channel, 2013-2018
Table 134: Japan Bovine Colostrum Market Historical Volume (MT) Analysis by Sales Channel, 2013-2018
Table 135: Japan Bovine Colostrum Market Forecast Value (US$ Mn) Analysis by Sales Channel, 2019-2027
Table 136: Japan Bovine Colostrum Market Forecast Volume (MT) Analysis by Sales Channel, 2019-2027
Table 137: Japan Bovine Colostrum Market Historical Value (US$ Mn) Analysis by Country, 2013-2018
Table 138: Japan Bovine Colostrum Market Historical Volume (MT) Analysis by Country, 2013-2018
Table 139: Japan Bovine ColostrumMarket Forecast Value (US$ Mn) Analysis by Country, 2019-2027
Table 140: Japan Bovine Colostrum Market Forecast Volume (MT) Analysis by Country, 2019-2027
List of Figures
Figure 1: Global Bovine Colostrum Market Value Y-o-Y Growth and Forecast, 2013-2027
Figure 2: Global Bovine Colostrum Market Incremental $ Opportunity, 2019-2027
Figure 3: Global Bovine Colostrum Market Incremental Volume (MT), 2019-2027
Figure 4: Global Bovine Colostrum Market Value Y-o-Y Growth and Forecast, by Region, 2013-2027
Figure 5: Global Bovine Colostrum Market Incremental $ Opportunity, by Region, 2019-2027
Figure 6: Global Bovine Colostrum Market Attractiveness Index, by Region, 2019-2027
Figure 7: Global Bovine Colostrum Market Value Y-o-Y Growth and Forecast, by Nature, 2013-2027
Figure 8: Global Bovine Colostrum Market Incremental $ Opportunity, by Nature, 2019-2027
Figure 9: Global Bovine Colostrum Market Value Y-o-Y Growth and Forecast, by Nature, 2013-2027
Figure 10: Global Bovine Colostrum Market Value Y-o-Y Growth and Forecast, by Form, 2013-2027
Figure 11: Global Bovine Colostrum Market Incremental $ Opportunity, by Form, 2019-2027
Figure 12: Global Bovine Colostrum Market Value Y-o-Y Growth and Forecast, by Form, 2013-2027
Figure 13: Global Bovine Colostrum Market Value Y-o-Y Growth and Forecast, by End-Use, 2013-2027
Figure 14: Global Bovine Colostrum Market Incremental $ Opportunity, by End-Use, 2019-2027
Figure 15: Global Bovine Colostrum Market Value Y-o-Y Growth and Forecast, by End-Use, 2013-2027
Figure 16: Global Bovine Colostrum Market Value Y-o-Y Growth and Forecast, by Sales Channel, 2013-2027
Figure 17: Global Bovine Colostrum Market Incremental $ Opportunity, by Sales Channel, 2019-2027
Figure 18: Global Bovine Colostrum Market Value Y-o-Y Growth and Forecast, by Sales Channel, 2013-2027
Figure 19: North America Bovine Colostrum Market Value Y-o-Y Growth and Forecast, by Region, 2013-2027
Figure 20: North America Bovine Colostrum Market Incremental $ Opportunity, by Country 2019-2027
Figure 21: North America Bovine Colostrum Market Attractiveness Index, by Country 2019-2027
Figure 22: North America Bovine Colostrum Market Value Y-o-Y Growth and Forecast, by Nature, 2013-2027
Figure 23: North America Bovine Colostrum Market Incremental $ Opportunity, by Nature, 2019-2027
Figure 24: North America Bovine Colostrum Market Value Y-o-Y Growth and Forecast, by Nature, 2013-2027
Figure 25: North America Bovine Colostrum Market Value Y-o-Y Growth and Forecast, by Form, 2013-2027
Figure 26: North America Bovine Colostrum Market Incremental $ Opportunity, by Form , 2019-2027
Figure 27: North America Bovine Colostrum Market Value Y-o-Y Growth and Forecast, by Form , 2013-2027
Figure 28: North America Bovine Colostrum Market Value Y-o-Y Growth and Forecast, by End-Use, 2013-2027
Figure 29: North America Bovine Colostrum Market Incremental $ Opportunity, by End-Use, 2019-2027
Figure 30: North America Bovine Colostrum Market Value Y-o-Y Growth and Forecast, by End-Use, 2013-2027
Figure 31: North America Bovine Colostrum Market Value Y-o-Y Growth and Forecast, by Sales Channel, 2013-2027
Figure 32: North America Bovine Colostrum Market Incremental $ Opportunity, by Sales Channel, 2019-2027
Figure 33: North America Bovine Colostrum Market Value Y-o-Y Growth and Forecast, by Sales Channel, 2013-2027
Figure 34: Latin America Bovine Colostrum Market Value Y-o-Y Growth and Forecast, by Region, 2013-2027
Figure 35: Latin America Bovine Colostrum Market Incremental $ Opportunity, by Country 2019-2027
Figure 36: Latin America Bovine Colostrum Market Attractiveness Index, by Country 2019-2027
Figure 37: Latin America Bovine Colostrum Market Value Y-o-Y Growth and Forecast, by Nature, 2013-2027
Figure 38: Latin America Bovine Colostrum Market Incremental $ Opportunity, by Nature, 2019-2027
Figure 39: Latin America Bovine Colostrum Market Value Y-o-Y Growth and Forecast, by Nature, 2013-2027
Figure 40: Latin America Bovine Colostrum Market Value Y-o-Y Growth and Forecast, by Form, 2013-2027
Figure 41: Latin America Bovine Colostrum Market Incremental $ Opportunity, by Form , 2019-2027
Figure 42: Latin America Bovine Colostrum Market Value Y-o-Y Growth and Forecast, by Form , 2013-2027
Figure 43: Latin America Bovine Colostrum Market Value Y-o-Y Growth and Forecast, by End-Use, 2013-2027
Figure 44: Latin America Bovine Colostrum Market Incremental $ Opportunity, by End-Use, 2019-2027
Figure 45: Latin America Bovine Colostrum Market Value Y-o-Y Growth and Forecast, by End-Use, 2013-2027
Figure 46: Latin America Bovine Colostrum Market Value Y-o-Y Growth and Forecast, by Sales Channel, 2013-2027
Figure 47: Latin America Bovine Colostrum Market Incremental $ Opportunity, by Sales Channel, 2019-2027
Figure 48: Latin America Bovine Colostrum Market Value Y-o-Y Growth and Forecast, by Sales Channel, 2013-2027
Figure 49: Europe Bovine Colostrum Market Value Y-o-Y Growth and Forecast, by Region, 2013-2027
Figure 50: Europe Bovine Colostrum Market Incremental $ Opportunity, by Country 2019-2027
Figure 51: Europe Bovine Colostrum Market Attractiveness Index, by Country 2019-2027
Figure 52: Europe Bovine Colostrum Market Value Y-o-Y Growth and Forecast, by Nature, 2013-2027
Figure 53: Europe Bovine Colostrum Market Incremental $ Opportunity, by Nature, 2019-2027
Figure 54: Europe Bovine Colostrum Market Value Y-o-Y Growth and Forecast, by Nature, 2013-2027
Figure 55: Europe Bovine Colostrum Market Value Y-o-Y Growth and Forecast, by Form, 2013-2027
Figure 56: Europe Bovine Colostrum Market Incremental $ Opportunity, by Form , 2019-2027
Figure 57: Europe Bovine Colostrum Market Value Y-o-Y Growth and Forecast, by Form , 2013-2027
Figure 58: Europe Bovine Colostrum Market Value Y-o-Y Growth and Forecast, by End-Use, 2013-2027
Figure 59: Europe Bovine Colostrum Market Incremental $ Opportunity, by End-Use, 2019-2027
Figure 60: Europe Bovine Colostrum Market Value Y-o-Y Growth and Forecast, by End-Use, 2013-2027
Figure 61: Europe Bovine Colostrum Market Value Y-o-Y Growth and Forecast, by Sales Channel, 2013-2027
Figure 62: Europe Bovine Colostrum Market Incremental $ Opportunity, by Sales Channel, 2019-2027
Figure 63: Europe Bovine Colostrum Market Value Y-o-Y Growth and Forecast, by Sales Channel, 2013-2027
Figure 64: MEA Bovine Colostrum Market Value Y-o-Y Growth and Forecast, by Region, 2013-2027
Figure 65: MEA Bovine Colostrum Market Incremental $ Opportunity, by Country 2019-2027
Figure 66: MEA Bovine Colostrum Market Attractiveness Index, by Country 2019-2027
Figure 67: MEA Bovine Colostrum Market Value Y-o-Y Growth and Forecast, by Nature, 2013-2027
Figure 68: MEA Bovine Colostrum Market Incremental $ Opportunity, by Nature, 2019-2027
Figure 69: MEA Bovine Colostrum Market Value Y-o-Y Growth and Forecast, by Nature, 2013-2027
Figure 70: MEA Bovine Colostrum Market Value Y-o-Y Growth and Forecast, by Form, 2013-2027
Figure 71: MEA Bovine Colostrum Market Incremental $ Opportunity, by Form , 2019-2027
Figure 72: MEA Bovine Colostrum Market Value Y-o-Y Growth and Forecast, by Form , 2013-2027
Figure 73: MEA Bovine Colostrum Market Value Y-o-Y Growth and Forecast, by End-Use, 2013-2027
Figure 74: MEA Bovine Colostrum Market Incremental $ Opportunity, by End-Use, 2019-2027
Figure 75: MEA Bovine Colostrum Market Value Y-o-Y Growth and Forecast, by End-Use, 2013-2027
Figure 76: MEA Bovine Colostrum Market Value Y-o-Y Growth and Forecast, by Sales Channel, 2013-2027
Figure 77: MEA Bovine Colostrum Market Incremental $ Opportunity, by Sales Channel, 2019-2027
Figure 78: MEA Bovine Colostrum Market Value Y-o-Y Growth and Forecast, by Sales Channel, 2013-2027
Figure 79: APEJ Bovine Colostrum Market Value Y-o-Y Growth and Forecast, by Region, 2013-2027
Figure 80: APEJ Bovine Colostrum Market Incremental $ Opportunity, by Country 2019-2027
Figure 81: APEJ Bovine Colostrum Market Attractiveness Index, by Country 2019-2027
Figure 82: APEJ Bovine Colostrum Market Value Y-o-Y Growth and Forecast, by Nature, 2013-2027
Figure 83: APEJ Bovine Colostrum Market Incremental $ Opportunity, by Nature, 2019-2027
Figure 84: APEJ Bovine Colostrum Market Value Y-o-Y Growth and Forecast, by Nature, 2013-2027
Figure 85: APEJ Bovine Colostrum Market Value Y-o-Y Growth and Forecast, by Form, 2013-2027
Figure 86: APEJ Bovine Colostrum Market Incremental $ Opportunity, by Form , 2019-2027
Figure 87: APEJ Bovine Colostrum Market Value Y-o-Y Growth and Forecast, by Form , 2013-2027
Figure 88: APEJ Bovine Colostrum Market Value Y-o-Y Growth and Forecast, by End-Use, 2013-2027
Figure 89: APEJ Bovine Colostrum Market Incremental $ Opportunity, by End-Use, 2019-2027
Figure 90: APEJ Bovine Colostrum Market Value Y-o-Y Growth and Forecast, by End-Use, 2013-2027
Figure 91: APEJ Bovine Colostrum Market Value Y-o-Y Growth and Forecast, by Sales Channel, 2013-2027
Figure 92: APEJ Bovine Colostrum Market Incremental $ Opportunity, by Sales Channel, 2019-2027
Figure 93: APEJ Bovine Colostrum Market Value Y-o-Y Growth and Forecast, by Sales Channel, 2013-2027
Figure 94: Japan Bovine Colostrum Market Value Y-o-Y Growth and Forecast, by Region, 2013-2027
Figure 95: Japan Bovine Colostrum Market Incremental $ Opportunity, by Country 2019-2027
Figure 96: Japan Bovine Colostrum Market Attractiveness Index, by Country 2019-2027
Figure 97: Japan Bovine Colostrum Market Value Y-o-Y Growth and Forecast, by Nature, 2013-2027
Figure 98: Japan Bovine Colostrum Market Incremental $ Opportunity, by Nature, 2019-2027
Figure 99: Japan Bovine Colostrum Market Value Y-o-Y Growth and Forecast, by Nature, 2013-2027
Figure 100: Japan Bovine Colostrum Market Value Y-o-Y Growth and Forecast, by Form, 2013-2027
Figure 101: Japan Bovine Colostrum Market Incremental $ Opportunity, by Form , 2019-2027
Figure 102: Japan Bovine Colostrum Market Value Y-o-Y Growth and Forecast, by Form , 2013-2027
Figure 103: Japan Bovine Colostrum Market Value Y-o-Y Growth and Forecast, by End-Use, 2013-2027
Figure 104: Japan Bovine Colostrum Market Incremental $ Opportunity, by End-Use, 2019-2027
Figure 105: Japan Bovine Colostrum Market Value Y-o-Y Growth and Forecast, by End-Use, 2013-2027
Figure 106: Japan Bovine Colostrum Market Value Y-o-Y Growth and Forecast, by Sales Channel, 2013-2027
Figure 107: Japan Bovine Colostrum Market Incremental $ Opportunity, by Sales Channel, 2019-2027
Figure 108: Japan Bovine Colostrum Market Value Y-o-Y Growth and Forecast, by Sales Channel, 2013-2027
Copyright © Transparency Market Research, Inc. All Rights reserved
Trust Online

Bovine Colostrum Market
