The coronavirus pandemic has created space for business owners and governments to rethink their commercial activities. Since climate change has become evident after the recent Uttarakhand glacier burst, companies in the Asia and Australia power distribution component market and governments in Japan are already witnessing transition to renewable energy. Self-consumption solar power generation facilities are gaining prominence in Japan with considerations made in supply chain reforms and investment in domestic production.
India, on the other hand, is recognizing the importance of a resilient power sector after the onset of the COVID-19 pandemic. New reforms, such as creation of a single national power grid and dynamic growth of the renewable energy sector are contributing to the development of the Asia and Australia power distribution component market.

Electric bus systems have become an important part of the power distribution sector, which helps to prevent events of an open circuit that might be potentially dangerous for individuals in commercial and residential sectors. However, it is very important that skilled technicians manage bus bars, as main and transfer bus arrangements are susceptible to breakdown if a fault occurs in any of the sections on the bus.
The modernization of the electric power system has become the need of the hour in the Asia and Australia power distribution component market. Changes in regulation and operations of electric power utilities are benefitting manufacturers in the Asia and Australia power distribution component market.
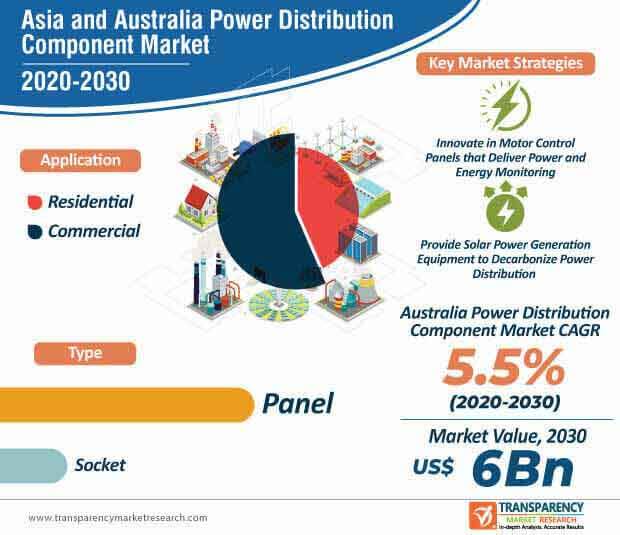
The Asia and Australia power distribution component market is estimated to reach US$ 6 Bn by 2030. This is explained since the development and deployment of clean technologies is becoming increasingly commonplace. Thus, stakeholders are requesting regulators to implement reforms that give utilities sector certain incentives to become fully engaged in innovations of new technologies.
The Asia and Australia power distribution component market is facing challenges with new expectations and requirements to replace aging infrastructure and mitigate the effects of storms and other disruptive events. Thus, improvements in generation capacity factors and average utilization of distribution assets are playing a key role in efficient electricity usage.
Investments in R&D have become customary for most industries, including stakeholders in the Asia power distribution component market. Schneider Electric in India is boosting its marketing capabilities of motor control panels that deliver power and energy monitoring, thermal management, and circuit protection. This indicates why the Asia power distribution component market is projected to advance at a favorable CAGR of ~6% during the forecast period.
Manufacturers are increasing the availability of control panels that offer clarity in the area of sequence control and relays where PLCs (Programmable Logic Controller) are emerging as an alternative to analogue relay systems. Digital control panels are storming the market to increase the reliability of systems.
Automated and centrally controlled lighting control systems are transforming residential and commercial spaces. Linear Matrix— a specialist in the lighting industry is broadening its supply chains of DALI lighting control panels in Sydney, Melbourne, and other cities of Australia. This explains why the Australia power distribution component market is slated to register a CAGR of 5.5% during the assessment period.
Lighting control panels help to manage LED lights and fixtures in commercial and residential sectors. Manufacturers in the Australia power distribution component market are boosting their production capabilities in automated and centrally controlled systems that meet convenience of users. These systems are capable of accommodating the time of day and frequency of use by end users.

Analysts’ Viewpoint
Due to the negative repercussions of the COVID-19 pandemic, there is a need for reforms in the Asia and Australia power distribution component market to emerge resilient during unanticipated future events. Japan is focused on augmenting solar power generation equipment, which helps to decarbonize the power distribution sector. However, there is a need to defend power systems from cyber security and physical attacks by malicious entities. In order to overcome these challenges, manufacturers should increase the availability of digitized control systems that deploy tracking of malicious activities and help mitigate security risks. Companies are tapping into opportunities to improve system efficiencies by investing in R&D activities.
Asia and Australia Power Distribution Component Market: Overview
Rise in Construction & Infrastructure Activities: Key Driver of Asia and Australia Power Distribution Component Market
Rise in Application of Power Distribution Components in Residential, Commercial Segments
Asia and Australia Power Distribution Component Market: Competition Landscape
Asia and Australia Power Distribution Component Market: Strategic Partnerships
1. Executive Summary
1.1. Market Outlook
1.2. Key Facts and Figures
1.3. Key Trends
2. Market Overview
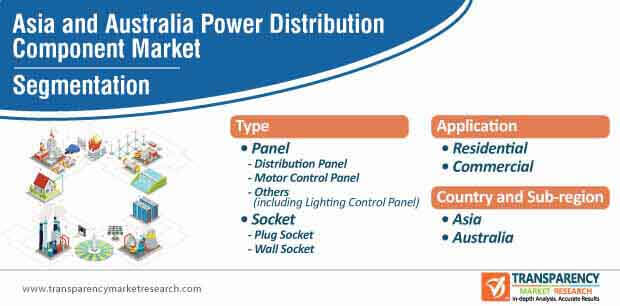
2.1. Market Segmentation
2.2. Market Indicators
3. Market Dynamics
3.1. Drivers and Restraints Snapshot Analysis
3.1.1.1. Drivers
3.1.1.2. Restraints
3.1.1.3. Opportunities
3.2. Porter’s Five Forces Analysis
3.2.1. Threat of Substitutes
3.2.2. Bargaining Power of Buyers
3.2.3. Bargaining Power of Suppliers
3.2.4. Threat of New Entrants
3.2.5. Degree of Competition
3.3. Regulatory Scenario
3.4. Value Chain Analysis
4. COVID-19 Impact Analysis
5. Asia Power Distribution Component Market Value (US$ Mn) Analysis, by Type
5.1. Key Findings and Introduction
5.2. Asia Power Distribution Component Market Value (US$ Mn) Forecast, by Type, 2019–2030
5.2.1. Asia Power Distribution Component Market Value (US$ Mn) Forecast, by Panel, 2019–2030
5.2.1.1. Asia Power Distribution Component Market Value (US$ Mn) Forecast, by Distribution Panel, 2019–2030
5.2.1.2. Asia Power Distribution Component Market Value (US$ Mn) Forecast, by Motor Control Panel, 2019–2030
5.2.1.3. Asia Power Distribution Component Market Value (US$ Mn) Forecast, by Others, 2019–2030
5.2.2. Asia Power Distribution Component Market Value (US$ Mn) Forecast, by Socket, 2019–2030
5.2.2.1. Asia Power Distribution Component Market Value (US$ Mn) Forecast, by Plug Socket, 2019–2030
5.2.2.2. Asia Power Distribution Component Market Value (US$ Mn) Forecast, by Wall Socket, 2019–2030
5.3. Asia Power Distribution Component Market Attractiveness Analysis, by Type
6. Asia Power Distribution Component Market Value (US$ Mn) Analysis, by Application
6.1. Key Findings and Introduction
6.2. Asia Power Distribution Component Market Value (US$ Mn) Forecast, by Application, 2019–2030
6.2.1. Asia Power Distribution Component Market Value (US$ Mn) Forecast, by Residential, 2019–2030
6.2.2. Asia Power Distribution Component Market Value (US$ Mn) Forecast, by Commercial, 2019–2030
6.3. Asia Power Distribution Component Market Attractiveness Analysis, by Application
7. Asia Power Distribution Component Market Analysis, by Country and Sub-region
7.1. Key Findings
7.2. Asia Power Distribution Component Market Value (US$ Mn) Forecast, by Country and Sub-region
7.2.1. China
7.2.2. India
7.2.3. Japan
7.2.4. ASEAN
7.2.5. Rest of Asia
7.3. Asia Power Distribution Component Market Attractiveness Analysis, by Country and Sub-region
7.3.1. China Power Distribution Component Market Value (US$ Mn) Forecast, by Type, 2019–2030
7.3.2. China Power Distribution Component Market Value (US$ Mn) Forecast, by Application, 2019–2030
7.3.3. India Power Distribution Component Market Value (US$ Mn) Forecast, by Type, 2019–2030
7.3.4. India Power Distribution Component Market Value (US$ Mn) Forecast, by Application, 2019–2030
7.3.5. Japan Power Distribution Component Market Value (US$ Mn) Forecast, by Type, 2019–2030
7.3.6. Japan Power Distribution Component Market Value (US$ Mn) Forecast, by Application, 2019–2030
7.3.7. ASEAN Power Distribution Component Market Value (US$ Mn) Forecast, by Type, 2019–2030
7.3.8. ASEAN Power Distribution Component Market Value (US$ Mn) Forecast, by Application, 2019–2030
7.3.9. Rest of Asia Power Distribution Component Market Value (US$ Mn) Forecast, by Type, 2019–2030
7.3.10. Rest of Asia Power Distribution Component Market Value (US$ Mn) Forecast, by Application, 2019–2030
8. Australia Power Distribution Component Market Overview
8.1. Key Findings
8.2. Australia Power Distribution Component Market Value (US$ Mn) Forecast, by Type, 2019–2030
8.3. Australia Power Distribution Component Market Value (US$ Mn) Forecast, by Application, 2019–2030
8.4. Australia Power Distribution Component Market Attractiveness Analysis, by Type
8.5. Australia Power Distribution Component Market Attractiveness Analysis, by Application
9. Competition Landscape
9.1. Competition Matrix
9.2. Asia and Australia Power Distribution Component Market Share Analysis, by Company (2019)
9.3. Market Footprint Analysis
9.4. Company Profiles
9.4.1. ABB
9.4.1.1. Company Details
9.4.1.2. Company Description
9.4.1.3. Business Overview
9.4.1.4. Financial Details
9.4.1.5. Strategic Overview
9.4.2. Siemens
9.4.2.1. Company Details
9.4.2.2. Company Description
9.4.2.3. Business Overview
9.4.2.4. Financial Details
9.4.2.5. Strategic Overview
9.4.3. Eaton.
9.4.3.1. Company Details
9.4.3.2. Company Description
9.4.3.3. Business Overview
9.4.3.4. Financial Details
9.4.3.5. Strategic Overview
9.4.4. Schneider Electric SE.
9.4.4.1. Company Details
9.4.4.2. Company Description
9.4.4.3. Business Overview
9.4.4.4. Financial Details
9.4.4.5. Strategic Overview
9.4.5. Larsen & Toubro Limited
9.4.5.1. Company Details
9.4.5.2. Company Description
9.4.5.3. Business Overview
9.4.5.4. Financial Details
9.4.6. Hyundai Electric & Energy Systems Co., Ltd.
9.4.6.1. Company Details
9.4.6.2. Company Description
9.4.6.3. Business Overview
9.4.7. Fuji Electric Co., Ltd
9.4.7.1. Company Details
9.4.7.2. Company Description
9.4.7.3. Business Overview
9.4.7.4. Financial Details
9.4.8. Crompton Greaves Consumer Electricals Ltd
9.4.8.1. Company Details
9.4.8.2. Company Description
9.4.8.3. Business Overview
9.4.8.4. Financial Details
9.4.9. Mitsubishi Electric Corporation
9.4.9.1. Company Details
9.4.9.2. Company Description
9.4.9.3. Business Overview
9.4.9.4. Financial Details
9.4.9.5. Strategic Overview
9.4.10. GENERAL ELECTRIC
9.4.10.1. Company Details
9.4.10.2. Company Description
9.4.10.3. Business Overview
9.4.10.4. Financial Details
9.4.10.5. Strategic Overview
9.4.11. FURUKAWA CO.,LTD
9.4.11.1. Company Details
9.4.11.2. Company Description
9.4.11.3. Business Overview
9.4.11.4. Financial Details
9.4.12. Panasonic Corporation
9.4.12.1. Company Details
9.4.12.2. Company Description
9.4.12.3. Business Overview
9.4.12.4. Financial Details
9.4.13. Arrow Electronics, Inc.
9.4.13.1. Company Details
9.4.13.2. Company Description
9.4.13.3. Business Overview
9.4.13.4. Financial Details
10. Primary Research – Key Insights
11. Appendix
11.1. Research Methodology and Assumptions
List of Tables:
Table 01: Asia Power Distribution Component Market Value (US$ Mn) Forecast, by Country and Sub-region, 2019–2030
Table 02: Asia Power Distribution Component Market Value (US$ Mn) Forecast, by Type, 2019–2030
Table 03: Asia Power Distribution Component Market Value (US$ Mn) Forecast, by Application, 2019–2030
Table 04: China Power Distribution Component Market Value (US$ Mn) Forecast, by Type, 2019–2030
Table 05: China Power Distribution Component Market Value (US$ Mn) Forecast, by Application, 2019–2030
Table 06: India Power Distribution Component Market Value (US$ Mn) Forecast, by Type, 2019–2030
Table 07: India Power Distribution Component Market Value (US$ Mn) Forecast, by Application, 2019–2030
Table 08: Japan Power Distribution Component Market Value (US$ Mn) Forecast, by Type, 2019–2030
Table 09: Japan Power Distribution Component Market Value (US$ Mn) Forecast, by Application, 2019–2030
Table 10: ASEAN Power Distribution Component Market Value (US$ Mn) Forecast, by Type, 2019–2030
Table 11: ASEAN Power Distribution Component Market Value (US$ Mn) Forecast, by Application, 2019–2030
Table 12: Rest of Asia Power Distribution Component Market Value (US$ Mn) Forecast, by Type, 2019–2030
Table 13: Rest of Asia Power Distribution Component Market Value (US$ Mn) Forecast, by Application, 2019–2030
Table 14: Australia Power Distribution Component Market Value (US$ Mn) Forecast, by Type, 2019–2030
Table 15: Australia Power Distribution Component Market Value (US$ Mn) Forecast, by Application, 2019–2030
List of Figures:
Figure 01: Asia Power Distribution Component Market Value (US$ Mn), 2019–2030
Figure 02: Asia Power Distribution Component Market Value Share Analysis, by Country and Sub-region, 2019, 2025, and 2030
Figure 03: Asia Power Distribution Component Market Attractiveness Analysis, by Country and Sub-region
Figure 04: Asia Power Distribution Component Market Value Share Analysis, by Type, 2019, 2025, and 2030
Figure 05: Asia Power Distribution Component Market Attractiveness Analysis, by Type
Figure 06: Asia Power Distribution Component Market Value Share Analysis, by Application, 2019, 2025, and 2030
Figure 07: Asia Power Distribution Component Market Attractiveness Analysis, by Application,
Figure 08: Australia Power Distribution Component Market Value Share Analysis, by Type, 2019, 2025, and 2030
Figure 09: Australia Power Distribution Component Market Attractiveness Analysis, by Type
Figure 10: Australia Power Distribution Component Market Value Share Analysis, by Application, 2019, 2025, and 2030
Figure 11: Australia Power Distribution Component Market Attractiveness Analysis, by Application