The Malagasy plant extracts are gaining increased popularity during the coronavirus situation. Pharmaceutical companies in the organic herbal extracts market are capitalizing on this opportunity to produce capsules using Malagasy plant extracts that hold promising potentials to treat COVID-19. This trend is prominent in Madagascar and other African countries where there is abundance for the Malagasy plant. Thus, African manufacturers can upgrade their supply and export chains to tap into revenue opportunities during the pandemic. As such, medications with anti-malarial properties are being highly publicized for treatment of coronavirus in patients. This factor is likely to drive the organic herbal extracts market.
The organic herbal extracts market is slated to register a favorable CAGR of 4.8% during the forecast period. Manufacturers are diversifying their production in yeast extracts that act as flavoring agents in beverages and bread. However, it has been found that many individuals experience mild flushing on their skin and headaches after consuming foods and beverages made from yeast extracts. Hence, manufacturers should incorporate clean labels on products to make people aware about the product’s ingredients. They are working with the medical community to establish the judicial use of yeast extracts in food and beverage (F&B) products.
Apart from food and essential oils, manufacturers in the organic herbal extracts market are unlocking revenue opportunities in cosmetics and personal care products. This explains why the organic herbal extracts market is predicted to reach US$ 8.4 Bn by the end of 2030. Manufacturers are increasing their product portfolio in organic and certified flavors in F&B products. In order to expand their business in Europe, companies are adhering to the EU organic regulations to innovate in F&B products.
Botanical extracts are being highly publicized for innovations in the health and nutrition industries. Nexira— a supplier of acacia, natural ingredients, and botanical extracts is expanding its business streams in health, nutrition, and F&B products, owing to growing awareness about organic and herbal ingredients in products. The burgeoning demand for natural and high quality products are acting as growth drivers for the organic herbal extracts market. The clean label movement is fueling market growth, since growing awareness about dietary benefits of organic ingredients is surging in the market landscape.
Analysts’ Viewpoint
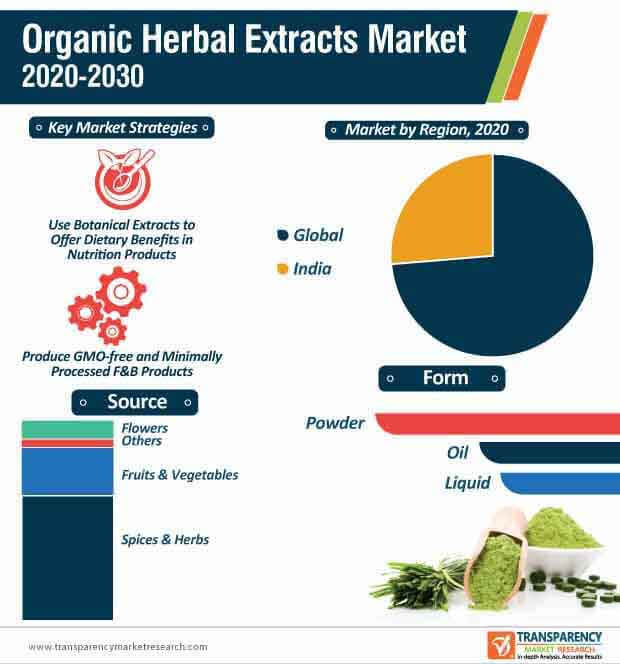
Green tea and spirulina extracts are emerging as potential ingredients for developing COVID-19 medications. Essential oil extracts are offering therapeutic benefits to individuals with insomnia and mental illnesses. However, possible side effects such as burning of eyes, nausea, and shortness of breath are likely to inhibit growth for the organic herbal extracts market. Hence, manufacturers should adopt clean label in products to educate consumers about the product’s ingredients. As such, companies are increasing the availability of safely sourced ingredients due to the consumer demand for natural and premium quality products. They are innovating in GMO-free and minimally processed F&B products to establish stable revenue streams in the market landscape.
Organic Herbal Extracts Market: Overview
Organic Herbal Extracts Market: Market Frontrunners
Organic Herbal Extracts Market: Key Market Trends
Organic Herbal Extracts Market: Strategies
Organic Herbal Extracts Market: Market Players
Organic Herbal Extracts Market is expected to Reach US$ 8.4 Bn By 2030
Organic Herbal Extracts Market is estimated to rise at a CAGR of 4.8% during forecast period
Growing demand of organic herbal extracts in cosmetics & personal care industry is expected to drive the Organic Herbal Extracts Market
North America is more attractive for vendors in the Organic Herbal Extracts Market
Key players of Organic Herbal Extracts Market are Ransom Naturals Ltd., Nature's Way Products, LLC, Synergy Flavors, Döhler, Gaia Herbs, Natrol, LLC, Oregon’s Wild Harvest, Natural Factors Nutritional Products Ltd., Herb Pharm, Arjuna Natural Pvt. Ltd., Nutra Green Biotechnology Co., Ltd., Select Botanical, Blue Sky Botanics, Sabinsa Corporation, Martin Bauer Group, Banyan, Botanicals, Naturalin Bio-Resources Co. Ltd, Sanat Products LTD., Kalsec Inc, Carrubba INC, Prakruti Products, ORGANIC INDU
1. Executive Summary
1.1. Market Outlook
1.2. Demand Side Trends
1.3. Supply Side Trends
1.4. Analysis and Recommendations
2. Market Overview
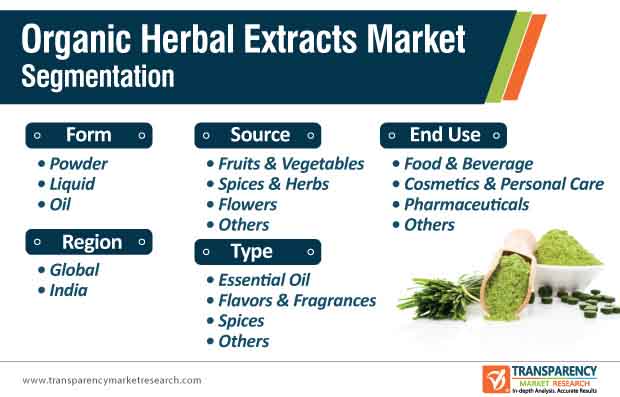
2.1. Market Coverage / Taxonomy
2.2. Market Definition / Scope / Limitations
3. Key Market Trends
3.1. Global Food & Beverage Industry Trends
3.2. Global Food & Beverage Industry Challenges
3.3. Opportunities in the Global Food & Beverage Industry
3.4. Key Market Trends
4. Key Success Factors
4.1. Product Adoption / Usage Analysis
4.2. Product USPs / Features
5. Global Organic Herbal Extracts Market Demand Analysis 2015–2019 and Forecast, 2020–2030
5.1. Historical Market Value (US$ Mn) Analysis, 2015–2019
5.2. Current and Future Market Value (US$ Mn) Projections, 2020–2030
5.3. Current and Future Market Volume (Tons) Projections, 2020–2030
5.4. Y-o-Y Growth Trend Analysis
5.4.1. Y-o-Y Growth Trend Analysis
5.4.2. Absolute $ Opportunity Analysis
6. Global Organic Herbal Extracts Market - Pricing Analysis
6.1. Regional Pricing Analysis By Type
6.2. Global Average Pricing Analysis Benchmark
7. Market Background
7.1. Macro-Economic Factors
7.1.1. Global GDP Growth Outlook
7.1.2. Global Industry Value Added
7.1.3. Global Urbanization Growth Outlook
7.1.4. Global Food Security Index Outlook
7.1.5. Global Rank – Ease of Doing Business
7.1.6. Global Rank – Trading Across Borders
7.2. Global Food & Beverages Industry Outlook
7.3. Global Food & Beverage Industry Key Indicators
7.4. Global Beverage Industry Outlook
7.5. Global Pharmaceutical Industry Outlook
7.6. Global Cosmetics & Personal Care Industry Outlook
7.7. Global Botanical Extract Industry Outlook
7.8. Agriculture – Transforming into High-Tech Agriculture Industry
7.9. Sustainable Agriculture
7.10. Organic Industry Outlook
7.11. Sustainable Development Goals
7.12. The Future of Food
7.13. COVID-19 Impact on Food & Beverage Industry
7.13.1. Impact of COVID-19 on Food and Beverage Industry
7.13.1.1. Beverage Industry
7.13.1.2. Dairy Industry
7.13.1.3. Bakery Industry
7.13.1.4. Confectionery Industry
7.13.2. Impact of COVID-19 on 2020 Food Trends
7.13.3. Supply Chain Impact on Food Ingredients from the Coronavirus Pandemic
7.13.4. Actions for Supply Chain
7.13.5. Requirement of Digital Supply Networks
7.13.6. Guidelines By FDA in Response to COVID-19 Pandemic
7.13.7. Reaction of Association Towards the Pandemic
7.14. Key Regulations/Claims/Certifications
7.15. Value Chain Analysis
7.16. Market Dynamics
7.16.1. Drivers
7.16.2. Restraints
7.16.3. Opportunity Analysis
7.17. Forecast Factors - Relevance & Impact
8. Global Organic Herbal Extracts Market Analysis 2015–2019 and Forecast 2020–2030, by Type
8.1. Introduction / Key Findings
8.2. Historical Market Size (US$ Mn) and Volume Analysis By Type, 2015–2019
8.3. Current and Future Market Size (US$ Mn) and Volume Analysis and Forecast By Type, 2020–2030
8.3.1. Essential Oils
8.3.2. Flavors and Fragrances
8.3.3. Spices
8.3.4. Others
8.4. Market Attractiveness Analysis By Type
9. Global Organic Herbal Extracts Market Analysis 2015–2019 and Forecast 2020–2030, By Form
9.1. Introduction / Key Findings
9.2. Historical Market Size (US$ Mn) and Volume Analysis By Form, 2015–2019
9.3. Current and Future Market Size (US$ Mn) and Volume Analysis and Forecast By Form, 2020–2030
9.3.1. Powder
9.3.2. Liquid
9.3.3. Oil
9.4. Market Attractiveness Analysis By Form
10. Global Organic Herbal Extracts Market Analysis 2015–2019 and Forecast 2020–2030, By Source
10.1. Introduction / Key Findings
10.2. Historical Market Size (US$ Mn) and Volume Analysis By Source, 2015–2019
10.3. Current and Future Market Size (US$ Mn) and Volume Analysis and Forecast By Source, 2020–2030
10.3.1. Fruits & Vegetables
10.3.2. Spices & Herbs
10.3.3. Flowers
10.3.4. Others
10.4. Market Attractiveness Analysis By Source
11. Global Organic Herbal Extracts Market Analysis 2015–2019 and Forecast 2020–2030, By End Use
11.1. Introduction / Key Findings
11.2. Historical Market Size (US$ Mn) and Volume Analysis By End Use, 2015–2019
11.3. Current and Future Market Size (US$ Mn) and Volume Analysis and Forecast By End Use, 2020–2030
11.3.1.1. Food & Beverage Industry
11.3.1.2. Cosmetics & Personal Care
11.3.1.3. Pharmaceutical
11.3.1.4. Others
11.4. Market Attractiveness Analysis By End Use
12. Global Organic Herbal Extracts Market Analysis 2015–2019 and Forecast 2020–2030, by Region
12.1. Introduction
12.2. Historical Market Size (US$ Mn) and Volume Analysis By Region, 2015–2019
12.3. Current Market Size (US$ Mn) and Volume Analysis and Forecast By Region, 2020–2030
12.3.1. North America
12.3.2. Latin America
12.3.3. Europe
12.3.4. East Asia
12.3.5. South Asia
12.3.6. Oceania
12.3.7. Middle East and Africa (MEA)
12.4. Market Attractiveness Analysis By Region
13. India Organic Herbal Extracts Market Analysis 2015–2019 and Forecast 2020–2030
13.1. Introduction
13.2. Historical Market Size (US$ Mn) and Volume Trend Analysis By Market Taxonomy, 2015–2019
13.3. Market Size (US$ Mn) and Volume Forecast By Market Taxonomy, 2020–2030
13.3.1. By Type
13.3.2. By Form
13.3.3. By Source
13.3.4. By End Use
13.4. Market Attractiveness Analysis
13.4.1. By Country
13.4.2. By Type
13.4.3. By Form
13.4.4. By Source
13.4.5. By End Use
13.5. Drivers and Restraints - Impact Analysis
14. Market Structure Analysis
14.1. Market Analysis by Tier of Companies
14.2. Market Concentration
14.3. Market Presence Analysis
15. Competition Analysis
15.1. Competition Dashboard
15.2. Competition Deep Dive
15.2.1. Ransom Naturals Ltd.
15.2.1.1. Overview
15.2.1.2. Product Portfolio/Key Brands
15.2.1.3. Sales Footprint
15.2.1.4. Key Developments/Key Takeaways
15.2.1.5. Strategy Overview
15.2.1.6. Financial Overview
15.2.2. Nature's Way Products, LLC
15.2.2.1. Overview
15.2.2.2. Product Portfolio/Key Brands
15.2.2.3. Sales Footprint
15.2.2.4. Key Developments/Key Takeaways
15.2.2.5. Strategy Overview
15.2.2.6. Financial Overview
15.2.3. Synergy Flavors
15.2.3.1. Overview
15.2.3.2. Product Portfolio/Key Brands
15.2.3.3. Sales Footprint
15.2.3.4. Key Developments/Key Takeaways
15.2.3.5. Strategy Overview
15.2.3.6. Financial Overview
15.2.4. Döhler
15.2.4.1. Overview
15.2.4.2. Product Portfolio/Key Brands
15.2.4.3. Sales Footprint
15.2.4.4. Key Developments/Key Takeaways
15.2.4.5. Strategy Overview
15.2.4.6. Financial Overview
15.2.5. Gaia Herbs
15.2.5.1. Overview
15.2.5.2. Product Portfolio/Key Brands
15.2.5.3. Sales Footprint
15.2.5.4. Key Developments/Key Takeaways
15.2.5.5. Strategy Overview
15.2.5.6. Financial Overview
15.2.6. Natrol, LLC
15.2.6.1. Overview
15.2.6.2. Product Portfolio/Key Brands
15.2.6.3. Sales Footprint
15.2.6.4. Key Developments/Key Takeaways
15.2.6.5. Strategy Overview
15.2.6.6. Financial Overview
15.2.7. Oregon’s Wild Harvest
15.2.7.1. Overview
15.2.7.2. Product Portfolio/Key Brands
15.2.7.3. Sales Footprint
15.2.7.4. Key Developments/Key Takeaways
15.2.7.5. Strategy Overview
15.2.7.6. Financial Overview
15.2.8. Natural Factors Nutritional Products Ltd.
15.2.8.1. Overview
15.2.8.2. Product Portfolio/Key Brands
15.2.8.3. Sales Footprint
15.2.8.4. Key Developments/Key Takeaways
15.2.8.5. Strategy Overview
15.2.8.6. Financial Overview
15.2.9. Herb Pharm
15.2.9.1. Overview
15.2.9.2. Product Portfolio/Key Brands
15.2.9.3. Sales Footprint
15.2.9.4. Key Developments/Key Takeaways
15.2.9.5. Strategy Overview
15.2.9.6. Financial Overview
15.2.10. Arjuna Natural Pvt. Ltd.
15.2.10.1. Overview
15.2.10.2. Product Portfolio/Key Brands
15.2.10.3. Sales Footprint
15.2.10.4. Key Developments/Key Takeaways
15.2.10.5. Strategy Overview
15.2.10.6. Financial Overview
15.2.11. Nutra Green Biotechnology Co., Ltd.
15.2.11.1. Overview
15.2.11.2. Product Portfolio/Key Brands
15.2.11.3. Sales Footprint
15.2.11.4. Key Developments/Key Takeaways
15.2.11.5. Strategy Overview
15.2.11.6. Financial Overview
15.2.12. Select Botanical
15.2.12.1. Overview
15.2.12.2. Product Portfolio/Key Brands
15.2.12.3. Sales Footprint
15.2.12.4. Key Developments/Key Takeaways
15.2.12.5. Strategy Overview
15.2.12.6. Financial Overview
15.2.13. Blue Sky Botanics
15.2.13.1. Overview
15.2.13.2. Product Portfolio/Key Brands
15.2.13.3. Sales Footprint
15.2.13.4. Key Developments/Key Takeaways
15.2.13.5. Strategy Overview
15.2.13.6. Financial Overview
15.2.14. Sabinsa Corporation
15.2.14.1. Overview
15.2.14.2. Product Portfolio/Key Brands
15.2.14.3. Sales Footprint
15.2.14.4. Key Developments/Key Takeaways
15.2.14.5. Strategy Overview
15.2.14.6. Financial Overview
15.2.15. Martin Bauer Group
15.2.15.1. Overview
15.2.15.2. Product Portfolio/Key Brands
15.2.15.3. Sales Footprint
15.2.15.4. Key Developments/Key Takeaways
15.2.15.5. Strategy Overview
15.2.15.6. Financial Overview
15.2.16. Banyan Botanicals
15.2.16.1. Overview
15.2.16.2. Product Portfolio/Key Brands
15.2.16.3. Sales Footprint
15.2.16.4. Key Developments/Key Takeaways
15.2.16.5. Strategy Overview
15.2.16.6. Financial Overview
15.2.17. Naturalin Bio-Resources Co. Ltd.
15.2.17.1. Overview
15.2.17.2. Product Portfolio/Key Brands
15.2.17.3. Sales Footprint
15.2.17.4. Key Developments/Key Takeaways
15.2.17.5. Strategy Overview
15.2.17.6. Financial Overview
15.2.18. Sanat Products LTD.
15.2.18.1. Overview
15.2.18.2. Product Portfolio/Key Brands
15.2.18.3. Sales Footprint
15.2.18.4. Key Developments/Key Takeaways
15.2.18.5. Strategy Overview
15.2.18.6. Financial Overview
15.2.19. Kalsec Inc.
15.2.19.1. Overview
15.2.19.2. Product Portfolio/Key Brands
15.2.19.3. Sales Footprint
15.2.19.4. Key Developments/Key Takeaways
15.2.19.5. Strategy Overview
15.2.19.6. Financial Overview
15.2.20. Carrubba INC
15.2.20.1. Overview
15.2.20.2. Product Portfolio/Key Brands
15.2.20.3. Sales Footprint
15.2.20.4. Key Developments/Key Takeaways
15.2.20.5. Strategy Overview
15.2.20.6. Financial Overview
15.2.21. Prakruti Products
15.2.21.1. Overview
15.2.21.2. Product Portfolio/Key Brands
15.2.21.3. Sales Footprint
15.2.21.4. Key Developments/Key Takeaways
15.2.21.5. Strategy Overview
15.2.21.6. Financial Overview
15.2.22. ORGANIC INDUSTRIES Pvt. Ltd.
15.2.22.1. Overview
15.2.22.2. Product Portfolio/Key Brands
15.2.22.3. Sales Footprint
15.2.22.4. Key Developments/Key Takeaways
15.2.22.5. Strategy Overview
15.2.22.6. Financial Overview
15.2.23. Nej Biotech
15.2.23.1. Overview
15.2.23.2. Product Portfolio/Key Brands
15.2.23.3. Sales Footprint
15.2.23.4. Key Developments/Key Takeaways
15.2.23.5. Strategy Overview
15.2.23.6. Financial Overview
15.2.24. Vital Herbs
15.2.24.1. Overview
15.2.24.2. Product Portfolio/Key Brands
15.2.24.3. Sales Footprint
15.2.24.4. Key Developments/Key Takeaways
15.2.24.5. Strategy Overview
15.2.24.6. Financial Overview
15.2.25. Himalayan Herbaria Inc
15.2.25.1. Overview
15.2.25.2. Product Portfolio/Key Brands
15.2.25.3. Sales Footprint
15.2.25.4. Key Developments/Key Takeaways
15.2.25.5. Strategy Overview
15.2.25.6. Financial Overview
15.2.26. Venkatesh Natural Extract Pvt. Ltd.
15.2.26.1. Overview
15.2.26.2. Product Portfolio/Key Brands
15.2.26.3. Sales Footprint
15.2.26.4. Key Developments/Key Takeaways
15.2.26.5. Strategy Overview
15.2.26.6. Financial Overview
15.2.27. Shree Ambika Naturals Pvt. Ltd.
15.2.27.1. Overview
15.2.27.2. Product Portfolio/Key Brands
15.2.27.3. Sales Footprint
15.2.27.4. Key Developments/Key Takeaways
15.2.27.5. Strategy Overview
15.2.27.6. Financial Overview
15.2.28. Vidya Herbs
15.2.28.1. Overview
15.2.28.2. Product Portfolio/Key Brands
15.2.28.3. Sales Footprint
15.2.28.4. Key Developments/Key Takeaways
15.2.28.5. Strategy Overview
15.2.28.6. Financial Overview
15.2.29. Acara Bioherb
15.2.29.1. Overview
15.2.29.2. Product Portfolio/Key Brands
15.2.29.3. Sales Footprint
15.2.29.4. Key Developments/Key Takeaways
15.2.29.5. Strategy Overview
15.2.29.6. Financial Overview
15.2.30. Herbal Creative
15.2.30.1. Overview
15.2.30.2. Product Portfolio/Key Brands
15.2.30.3. Sales Footprint
15.2.30.4. Key Developments/Key Takeaways
15.2.30.5. Strategy Overview
15.2.30.6. Financial Overview
16. Assumptions and Acronyms Used
17. Research Methodology
List of Table
Table 01: Global Organic Herbal Extracts Market Value (US$ Mn) Analysis and Forecast by Type, 2015-2030
Table 02: Global Organic Herbal Extracts Market Volume (Tons) Analysis and Forecast by Type, 2015-2030
Table 03: Global Organic Herbal Extracts Market Value (US$ Mn) Analysis and Forecast by Form, 2015-2030
Table 04: Global Organic Herbal Extracts Market Volume (Tons) Analysis and Forecast by Form, 2015-2030
Table 05: Global Organic Herbal Extracts Market Value (US$ Mn) Analysis and Forecast By Source, 2015-2030
Table 06: Global Organic Herbal Extracts Market Volume (Tons) Analysis and Forecast By Source, 2015-2030
Table 07: Global Organic Herbal Extracts Market Value (US$ Mn) Analysis and Forecast By End Use, 2015-2030
Table 08: Global Organic Herbal Extracts Market Volume (Tons) Analysis and Forecast By End Use, 2015-2030
Table 09: Global Organic Herbal Extracts Market Value (US$ Mn) Analysis and Forecast by Region, 2015-2030
Table 10: Global Organic Herbal Extracts Market Volume (Tons) Analysis and Forecast by Region, 2015-2030
Table 11: India Organic Herbal Extracts Market Value (US$ Mn) Analysis and Forecast by Type, 2015-2030
Table 12: India Organic Herbal Extracts Market Volume (Tons) Analysis and Forecast by Type, 2015-2030
Table 13: India Organic Herbal Extracts Market Value (US$ Mn) Analysis and Forecast by Form, 2015-2030
Table 14: India Organic Herbal Extracts Market Volume (Tons) Analysis and Forecast by Form, 2015-2030
Table 15: Global Organic Herbal Extracts Market Value (US$ Mn) Analysis and Forecast By Source, 2015-2030
Table 16: Global Organic Herbal Extracts Market Volume (Tons) Analysis and Forecast By Source, 2015-2030
Table 17: India Organic Herbal Extracts Market Value (US$ Mn) Analysis and Forecast by End Use, 2015-2030
Table 18: India Organic Herbal Extracts Market Volume (Tons) Analysis and Forecast by End Use, 2015-2030
List of Figure
Figure 01: Global Organic Herbal Extracts Market Value (US$ Mn) Forecast, 2020–2030
Figure 02: Global Organic Herbal Extracts Market Volume (Tons) Forecast, 2020–2030
Figure 03: Global Organic Herbal Extracts Market Value Share Analysis by Type, 2020 E
Figure 04: Global Organic Herbal Extracts Market Y-o-Y Growth Rate by Type, 2020-2030
Figure 05: Global Organic Herbal Extracts Market Value (US$ Mn) Analysis & Forecast by Type, 2020–2030
Figure 06: Global Organic Herbal Extracts Market Volume (Tons) Analysis & Forecast by Type, 2020–2030
Figure 07: Global Organic Herbal Extracts Market Value Share Analysis by Form, 2020 E
Figure 08: Global Organic Herbal Extracts Market Y-o-Y Growth Rate by Form, 2020-2030
Figure 09: Global Organic Herbal Extracts Market Value (US$ Mn) Analysis & Forecast by Form, 2020–2030
Figure 10: Global Organic Herbal Extracts Market Volume (Tons) Analysis & Forecast by Form, 2020–2030
Figure 11: Global Organic Herbal Extracts Market Value Share Analysis By Source, 2020 E
Figure 12: Global Organic Herbal Extracts Market Y-o-Y Growth Rate By Source, 2020-2030
Figure 13: Global Organic Herbal Extracts Market Value (US$ Mn) Analysis & Forecast By Source, 2020–2030
Figure 14: Global Organic Herbal Extracts Market Volume (Tons) Analysis & Forecast By Source, 2020–2030
Figure 15: Global Organic Herbal Extracts Market Value Share Analysis By End Use, 2020 E
Figure 16: Global Organic Herbal Extracts Market Y-o-Y Growth Rate By End Use, 2020-2030
Figure 17: Global Organic Herbal Extracts Market Value (US$ Mn) Analysis & Forecast By End Use, 2020–2030
Figure 18: Global Organic Herbal Extracts Market Volume (Tons) Analysis & Forecast By End Use, 2020–2030
Figure 19: Global Organic Herbal Extracts Market Value Share Analysis by Region, 2020 E
Figure 20: Global Organic Herbal Extracts Market Y-o-Y Growth Rate by Region, 2020-2030
Figure 21: Global Organic Herbal Extracts Market Value (US$ Mn) Analysis & Forecast by Region, 2020–2030
Figure 22: Global Organic Herbal Extracts Market Volume (Tons) Analysis & Forecast by Region, 2020–2030
Figure 23: Global Organic Herbal Extracts Market Attractiveness Analysis by Region, 2020-2030
Figure 24: Global Organic Herbal Extracts Market Attractiveness Analysis by Type, 2020-2030
Figure 25: Global Organic Herbal Extracts Market Attractiveness Analysis by Form, 2020-2030
Figure 26: Global Organic Herbal Extracts Market Attractiveness Analysis by Source, 2020-2030
Figure 27: Global Organic Herbal Extracts Market Attractiveness Analysis By End Use, 2020-2030
Figure 28: India Organic Herbal Extracts Market Value (US$ Mn) Analysis & Forecast by Type, 2020–2030
Figure 29: India Organic Herbal Extracts Market Volume (Tons) Analysis & Forecast by Type, 2020–2030
Figure 30: India Organic Herbal Extracts Market Value (US$ Mn) Analysis & Forecast by Form, 2020–2030
Figure 31: India Organic Herbal Extracts Market Volume (Tons) Analysis & Forecast by Form, 2020–2030
Figure 32: India Organic Herbal Extracts Market Value (US$ Mn) Analysis & Forecast by Source, 2020–2030
Figure 33: India Organic Herbal Extracts Market Volume (Tons) Analysis & Forecast by Source, 2020–2030
Figure 34: India Organic Herbal Extracts Market Value (US$ Mn) Analysis & Forecast by End Use, 2020–2030
Figure 35: India Organic Herbal Extracts Market Volume (Tons) Analysis & Forecast by End Use, 2020–2030
Figure 36: India Organic Herbal Extracts Market Attractiveness Analysis by Type, 2020-2030
Figure 37: India Organic Herbal Extracts Market Attractiveness Analysis by Form, 2020-2030
Figure 38: India Organic Herbal Extracts Market Attractiveness Analysis by Source, 2020-2030
Figure 39: India Organic Herbal Extracts Market Attractiveness Analysis by End Use, 2020-2030
Copyright © Transparency Market Research, Inc. All Rights reserved
Trust Online

Organic Herbal Extracts Market
