Analysts’ Viewpoint on North America Oil Condition Monitoring Services Market Scenario
Participants in the North America oil condition monitoring services market are taking data-driven decisions before planning to expand their business activities in key revenue-generating industries such as energy and transportation post the pandemic. Eroding natural resources are affecting the growth rate of the North America oil condition monitoring services market. Hence, market players should take advantage of technological improvements in machines that help to use oil and lubricants responsibly. Since organizations have huge investments in assets and other machineries, the need of proper functioning of all assets is fueling the demand for oil condition monitoring services. Moreover, the integration of online and offline services is accelerating business and manufacturing operations.
The widespread application of oil condition monitoring services in automotive, utilities, and marine is creating stable revenue streams for market stakeholders.
Predictive maintenance activities are emerging as a driver for the growth of the North America oil condition monitoring services market. The burgeoning growth of the Industry 4.0 is providing impetus to predictive maintenance activities, which includes oil condition monitoring services. Predictive maintenance evaluates the condition of in-service equipment to estimate the maintenance period and early indicator for the machine downtime. This helps to minimize unplanned downtime in various operations.
After a slowdown due to the coronavirus outbreak, the economy of North America is recovering post the ongoing vaccination measures. The reopening of various end markets such as energy industry, transportation, and construction activities are contributing to the growth of the North America oil condition monitoring services market.
Stakeholders of the North America oil condition monitoring services market are reviving their supply chains to ensure business continuity. Business activities have been affected most where physical presence of human are most necessary. Major demand drivers for the market such as power, energy, and oil & gas is creating income sources for participants in the market landscape. Market stakeholders are witnessing a push and pull effect since in some regions oil prices are declining due to an oversupply of oil reserves. However, on the other hand, oil prices are soaring due to supply disruptions.
Offline lab procedures require routine screening and external lab research, which are potentially time consuming. Hence, market stakeholders are growing interest in online condition monitoring services to overcome the drawbacks of offline methods.
The delay in obtaining oil analysis from labs is hampering business activities in the market. Hence, participants in the market are turning toward online condition monitoring services.
The overuse or inappropriate use of energy and other resources such as oil can elevate carbon footprints & greenhouse gas emissions (GHGs). Global sustainability aspirations are helping to reduce the environmental carbon footprint. The wear and tear due to friction affects the performance of machines. Such findings are fueling the demand for oil products and contributing to the expansion of the North America oil condition monitoring services market.
Companies in the North America oil condition monitoring services market are increasing R&D in oil and lubricants to evaluate their chemical & physical properties based on their tribological application. This analysis helps to save gallons of oil and other natural resources every year, along with a decline in carbon emissions.
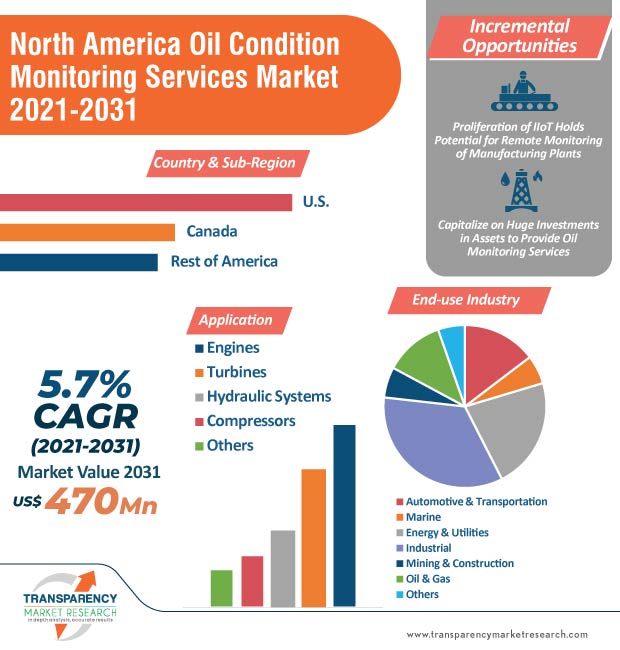
Industry 4.0 is significantly changing the North America oil condition monitoring services market landscape. The collaboration of online and offline services is generating incremental opportunities for market stakeholders. The integration of traditional laboratory analysis merged with data produced from online sensors is transforming business operations in the market. The proliferation of the Industrial Internet of Things (IIoT) network is emerging as a market driver.
Oil analysis in the future might not be limited to assessing the health of the lubricant or a specific component, but may play an integral role in optimizing manufacturing processes and remote monitoring of plants. Such trends are fueling the growth of the North America oil condition monitoring services market.
|
Attribute |
Detail |
|
Market Size Value in 2020 |
US$ 260 Mn |
|
Market Forecast Value in 2031 |
US$ 470 Mn |
|
Growth Rate (CAGR) |
5.7% |
|
Forecast Period |
2021-2031 |
|
Quantitative Units |
US$ Mn for Value |
|
Market Analysis |
It includes segment analysis at North America as well as country level. Furthermore, qualitative analysis includes drivers, restraints, opportunities, key trends, Porters Five Forces analysis, supply chain analysis, parent industry overview, etc. |
|
Competitive Landscape |
|
|
Format |
Electronic (PDF) + Excel |
|
Key Countries Covered |
|
|
Key Segments |
|
|
Key Companies Profiled |
|
|
Customization Scope |
Available upon Request |
|
Pricing |
Available upon Request |
The global Oil Condition Monitoring Services market is projected to reach US$ 1.4 Bn by 2027, at a CAGR of 7%.
Rising Adoption of Predictive Maintenance Among Industries: A Key Driver of Oil Condition Monitoring Services Market
Companies such as Exxon Mobil Corporation, Intertek Group plc, SGS SA, Bureau Veritas, and Veritas Petroleum Services fall under the star category.
North America contributes the largest market share in Oil Condition Monitoring Services market during the forecast period.
Industrial Internet of Things (IIoT) and Industry 4.0 revolution are adding great value to the development of Oil Condition Monitoring Services is expected to shape the market in the coming years
1. Preface
1.1. Market Introduction
1.2. Market and Segments Definition
1.3. Market Taxonomy
2. Assumptions and Research Methodology
2.1. Research Methodology
2.2. Assumption and Acronyms
3. Executive Summary
3.1. North America Oil Condition Monitoring Services Market Analysis and Forecast
3.2. Market Dynamics Snapshot
3.3. Competition Blueprint
4. Market Overview
4.1. Definition’s
4.2. Technology Roadmap Analysis
4.3. Forecast Factors
4.4. Market Dynamics
4.4.1. Supply Side Drivers
4.4.2. Demand Side Drivers
4.4.3. Restraints and Opportunities
4.5. Ecosystem
4.6. COVID-19 Impact Analysis
4.7. Market Opportunity Assessment
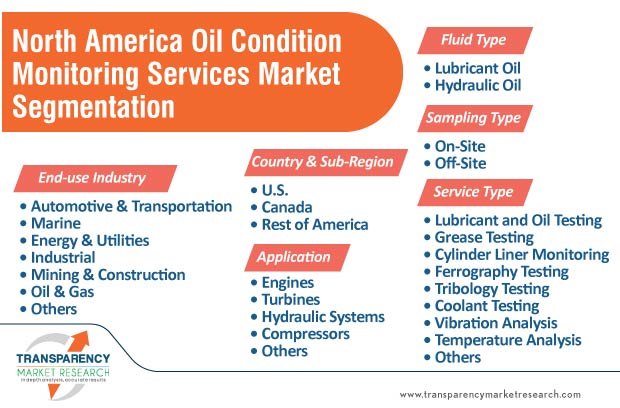
5. North America Oil Condition Monitoring Services, by Service Type
5.1. Oil Conditioning Monitoring Services Market Size (US$ Mn) Analysis & Forecast, by Service Type, 2017‒2031
5.1.1. Lubricant and Oil Testing
5.1.2. Grease Testing
5.1.3. Cylinder Liner Monitoring
5.1.4. Ferrography Testing
5.1.5. Tribology Testing
5.1.6. Coolant Testing
5.1.7. Vibration Data Analysis
5.1.8. Temperature Data Analysis
5.1.9. Others
5.2. North America Oil Conditioning Monitoring Services Market Attractiveness Analysis, by Service Type
6. North America Oil Conditioning Monitoring Services Market Analysis, by Sampling Type
6.1. North America Oil Conditioning Monitoring Services Market Size (US$ Mn) Analysis & Forecast, by Sampling Type, 2017‒2031
6.1.1. On-Site
6.1.2. Off-Site
6.2. North America Oil Conditioning Monitoring Services Market Attractiveness Analysis, by Sampling Type
7. North America Oil Conditioning Monitoring Services Market Analysis, by Fluid Type
7.1. North America Oil Conditioning Monitoring Services Market Size (US$ Mn) Analysis & Forecast, by Fluid Type, 2017‒2031
7.1.1. Lubricant Oil
7.1.2. Hydraulic Oil
7.2. North America Oil Conditioning Monitoring Services Market Attractiveness Analysis, by Fluid Type
8. North America Oil Conditioning Monitoring Services Market Analysis, by Applications
8.1. North America Oil Conditioning Monitoring Services Market Size (US$ Mn) Analysis & Forecast, by Applications, 2017‒2031
8.1.1. Engines
8.1.2. Turbines
8.1.3. Hydraulic Systems
8.1.4. Compressors
8.1.5. Others
8.2. North America Oil Conditioning Monitoring Services Market Attractiveness Analysis, by Applications
9. North America Oil Conditioning Monitoring Services Market Analysis, by End-use Industry
9.1. North America Oil Conditioning Monitoring Services Market Size (US$ Mn) Analysis & Forecast, by End-use Industry, 2017‒2031
9.1.1. Automotive & Transportation
9.1.2. Marine
9.1.3. Energy & Utilities
9.1.4. Industrial
9.1.5. Mining & Construction
9.1.6. Oil & Gas
9.1.7. Others
9.2. North America Oil Conditioning Monitoring Services Market Attractiveness Analysis, by End-use Industry
10. North America Oil Conditioning Monitoring Services Market Analysis and Forecast, by Country and Sub Region
10.1. North America Oil Conditioning Monitoring Services Market Size (US$ Mn) Analysis & Forecast, by Country and Sub-region, 2017‒2031
10.1.1. The U.S
10.1.2. Canada
10.1.3. Rest of North America
10.2. North America Oil Conditioning Monitoring Services Market Attractiveness Analysis, by Country and Sub-region
11. U.S. Oil Conditioning Monitoring Services Market Analysis and Forecast
11.1. U.S. Oil Conditioning Monitoring Services Market Size (US$ Mn) Analysis & Forecast, by Service Type, 2017‒2031
11.1.1. Lubricant and Oil Testing
11.1.2. Grease Testing
11.1.3. Cylinder Liner Monitoring
11.1.4. Ferrography Testing
11.1.5. Tribology Testing
11.1.6. Coolant Testing
11.1.7. Vibration Data Analysis
11.1.8. Temperature Data Analysis
11.1.9. Others
11.2. U.S. Oil Conditioning Monitoring Services Market Size (US$ Mn) Analysis & Forecast, by Sampling Type, 2017‒2031
11.2.1. On-Site
11.2.2. Off-Site
11.3. U.S. Oil Conditioning Monitoring Services Market Size (US$ Mn) Analysis & Forecast, by Fluid Type, 2017‒2031
11.3.1. Lubricant Oil
11.3.2. Hydraulic Oil
11.4. U.S. Oil Conditioning Monitoring Services Market Size (US$ Mn) Analysis & Forecast, by Applications, 2017‒2031
11.4.1. Engines
11.4.2. Turbines
11.4.3. Hydraulic Systems
11.4.4. Compressors
11.4.5. Others
11.5. U.S. Oil Conditioning Monitoring Services Market Size (US$ Mn) Analysis & Forecast, by End-use Industry, 2017‒2031
11.5.1. Automotive & Transportation
11.5.2. Marine
11.5.3. Energy & Utilities
11.5.4. Industrial
11.5.5. Mining & Construction
11.5.6. Oil & Gas
11.5.7. Others
11.6. U.S. Oil Conditioning Monitoring Services Market Attractiveness Analysis
11.6.1. By Service Type
11.6.2. By Sampling Type
11.6.3. By Fluid Type
11.6.4. By Application
11.6.5. By End-use Industry
12. Canada Oil Conditioning Monitoring Services Market Analysis and Forecast
12.1. Canada Oil Conditioning Monitoring Services Market Size (US$ Mn) Analysis & Forecast, by Service Type, 2017‒2031
12.1.1. Lubricant and Oil Testing
12.1.2. Grease Testing
12.1.3. Cylinder Liner Monitoring
12.1.4. Ferrography Testing
12.1.5. Tribology Testing
12.1.6. Coolant Testing
12.1.7. Vibration Data Analysis
12.1.8. Temperature Data Analysis
12.1.9. Others
12.2. Canada Oil Conditioning Monitoring Services Market Size (US$ Mn) Analysis & Forecast, by Sampling Type, 2017‒2031
12.2.1. On-Site
12.2.2. Off-Site
12.3. Canada Oil Conditioning Monitoring Services Market Size (US$ Mn) Analysis & Forecast, by Fluid Type, 2017‒2031
12.3.1. Lubricant Oil
12.3.2. Hydraulic Oil
12.4. Canada Oil Conditioning Monitoring Services Market Size (US$ Mn) Analysis & Forecast, by Applications, 2017‒2031
12.4.1. Engines
12.4.2. Turbines
12.4.3. Hydraulic Systems
12.4.4. Compressors
12.4.5. Others
12.5. Canada Oil Conditioning Monitoring Services Market Size (US$ Mn) Analysis & Forecast, by End-use Industry, 2017‒2031
12.5.1. Automotive & Transportation
12.5.2. Marine
12.5.3. Energy & Utilities
12.5.4. Industrial
12.5.5. Mining & Construction
12.5.6. Oil & Gas
12.5.7. Others
12.6. Canada Oil Conditioning Monitoring Services Market Attractiveness Analysis
12.6.1. By Service Type
12.6.2. By Sampling Type
12.6.3. By Fluid Type
12.6.4. By Application
12.6.5. By End-use Industry
13. Competition Assessment
13.1. North America Oil Conditioning Monitoring Services Market Competition Matrix - a Dashboard View
13.1.1. North America Oil Conditioning Monitoring Services Market Company Share Analysis, by Value (2020)
13.1.2. Technological Differentiator
14. Company Profiles (Manufacturers/Suppliers)
14.1. Baker Hughes Company
14.1.1. Overview
14.1.2. Product Portfolio
14.1.3. Sales Footprint
14.1.4. Strategy and Recent Developments
14.1.5. Key Financial
14.2. Bureau Veritas
14.2.1. Overview
14.2.2. Product Portfolio
14.2.3. Sales Footprint
14.2.4. Strategy and Recent Developments
14.2.5. Key Financial
14.3. Exxon Mobil Corporation
14.3.1. Overview
14.3.2. Product Portfolio
14.3.3. Sales Footprint
14.3.4. Strategy and Recent Developments
14.3.5. Key Financial
14.4. Fluid Life
14.4.1. Overview
14.4.2. Product Portfolio
14.4.3. Sales Footprint
14.4.4. Strategy and Recent Developments
14.4.5. Key Financial
14.5. Insight Services, Inc.
14.5.1. Overview
14.5.2. Product Portfolio
14.5.3. Sales Footprint
14.5.4. Strategy and Recent Developments
14.5.5. Key Financial
14.6. Intertek Group plc
14.6.1. Overview
14.6.2. Product Portfolio
14.6.3. Sales Footprint
14.6.4. Strategy and Recent Developments
14.6.5. Key Financial
14.7. Royal Dutch Shell plc
14.7.1. Overview
14.7.2. Product Portfolio
14.7.3. Sales Footprint
14.7.4. Strategy and Recent Developments
14.7.5. Key Financial
14.8. SGS SA
14.8.1. Overview
14.8.2. Product Portfolio
14.8.3. Sales Footprint
14.8.4. Strategy and Recent Developments
14.8.5. Key Financial
14.9. Veritas petroleum Services
14.9.1. Overview
14.9.2. Product Portfolio
14.9.3. Sales Footprint
14.9.4. Strategy and Recent Developments
14.9.5. Key Financial
14.10. WearCheck International
14.10.1. Overview
14.10.2. Product Portfolio
14.10.3. Sales Footprint
14.10.4. Strategy and Recent Developments
14.10.5. Key Financial
15. Used Oil Analysis Labs in North America
15.1. Blackstone Laboratories
15.1.1. Overview
15.1.2. Service Offerings
15.1.3. Geographic Footprint
15.2. Castrol
15.2.1. Overview
15.2.2. Service Offerings
15.2.3. Geographic Footprint
15.3. Foley, Inc.
15.3.1. Overview
15.3.2. Service Offerings
15.3.3. Geographic Footprint
15.4. Savant, Inc.
15.4.1. Overview
15.4.2. Service Offerings
15.4.3. Geographic Footprint
15.5. Tribocare INC
15.5.1. Overview
15.5.2. Service Offerings
15.5.3. Geographic Footprint
15.6. Trico Corporation
15.6.1. Overview
15.6.2. Service Offerings
15.6.3. Geographic Footprint
15.7. U.S. Venture, Inc.
15.7.1. Overview
15.7.2. Service Offerings
15.7.3. Geographic Footprint
16. Key Takeaways
16.1. Opportunity Assessment
16.1.1. By Service Type
16.1.2. By Sampling Type
16.1.3. By Fluid Type
16.1.4. By Application
16.1.5. By End-use Industry
16.1.6. By Country and Sub-region
List of Tables
Table 01: North America Oil Condition Monitoring Market Value (US$ Mn) Forecast, by Service Type, 2017‒2031
Table 02: North America Oil Condition Monitoring Market Value (US$ Mn) Forecast, by Sampling Type 2017‒2031
Table 03: North America Oil Condition Monitoring Market Value (US$ Mn) Forecast, by Fluid Type, 2017‒2031
Table 04: North America Oil Condition Monitoring Market Value (US$ Mn) Forecast, by Application, 2017‒2031
Table 05: North America Oil Condition Monitoring Market Value (US$ Mn) Forecast, by End-use Industry, 2017‒2031
Table 06: North America Oil Condition Monitoring Market Value (US$ Mn) Forecast, by Country and Sub-Region, 2017‒2031
Table 07: U.S. Oil Condition Monitoring Market Value (US$ Mn) Forecast, by Service Type, 2017‒2031
Table 08: U.S. Oil Condition Monitoring Market Value (US$ Mn) Forecast, by Sampling Type 2017‒2031
Table 09: U.S. Oil Condition Monitoring Market Value (US$ Mn) Forecast, by Fluid Type, 2017‒2031
Table 10: U.S. Oil Condition Monitoring Market Value (US$ Mn) Forecast, by Application, 2017‒2031
Table 11: U.S. Oil Condition Monitoring Market Value (US$ Mn) Forecast, by End-use Industry, 2017‒2031
Table 12: Canada Oil Condition Monitoring Market Value (US$ Mn) Forecast, by Service Type, 2017‒2031
Table 13: Canada Oil Condition Monitoring Market Value (US$ Mn) Forecast, by Sampling Type 2017‒2031
Table 14: Canada Oil Condition Monitoring Market Value (US$ Mn) Forecast, by Fluid Type, 2017‒2031
Table 15: Canada Oil Condition Monitoring Market Value (US$ Mn) Forecast, by Application, 2017‒2031
Table 16: Canada Oil Condition Monitoring Market Value (US$ Mn) Forecast, by End-use Industry, 2017‒2031
List of Figures
Figure 01: North America Oil Condition Monitoring , Value (US$ Mn), 2017‒2031
Figure 02: North America Oil Condition Monitoring Market, Value (US$ Mn), 2017‒2031
Figure 03: North America Oil Condition Monitoring Market Size & Forecast, by Service Type, Revenue (US$ Mn), 2017‒2031
Figure 04: North America Oil Condition Monitoring Market Attractiveness, by Service Type, 2021‒2031
Figure 05: North America Oil Condition Monitoring Market Share Analysis, by Service Type, 2021 & 2031
Figure 06: North America Oil Condition Monitoring Market Size & Forecast, by Sampling Type, Revenue (US$ Mn), 2017‒2031
Figure 07: North America Oil Condition Monitoring Market Attractiveness, by Sampling Type, 2021‒2031
Figure 08: North America Oil Condition Monitoring Market Share Analysis, by Sampling Type, 2021 & 2031
Figure 09: North America Oil Condition Monitoring Market Size & Forecast, by Fluid Type, Revenue (US$ Mn), 2017‒2031
Figure 10: North America Oil Condition Monitoring Market Attractiveness, by Fluid Type, 2021‒2031
Figure 11: North America Oil Condition Monitoring Market Share Analysis, by Fluid Type, 2021 & 2031
Figure 12: North America Oil Condition Monitoring Market Size & Forecast, by Application, Revenue (US$ Mn), 2017‒2031
Figure 13: North America Oil Condition Monitoring Market Attractiveness, by Application, 2021‒2031
Figure 14: North America Oil Condition Monitoring Market Share Analysis, by Application, 2021 & 2031
Figure 15: North America Oil Condition Monitoring Market Size & Forecast, by End-use Industry, Revenue (US$ Mn), 2017‒2031
Figure 16: North America Oil Condition Monitoring Market Attractiveness, by End-use Industry, 2021‒2031
Figure 17: North America Oil Condition Monitoring Market Share Analysis, by End-use Industry, 2021 & 2031
Figure 18: North America Oil Condition Monitoring Market Size & Forecast, by Country and Sub-Region, Revenue (US$ Mn), 2017‒2031
Figure 19: North America Oil Condition Monitoring Market Attractiveness, by Country and Sub-Region, 2021‒2031
Figure 20: North America Oil Condition Monitoring Market Share Analysis, by Country and Sub-Region, 2021 & 2031
Figure 21: U.S. Oil Condition Monitoring, Value (US$ Mn), 2017‒2031
Figure 22: U.S. Oil Condition Monitoring Market, Value (US$ Mn), 2017‒2031
Figure 23: U.S. Oil Condition Monitoring Market Size & Forecast, by Service Type, Revenue (US$ Mn), 2017‒2031
Figure 24: U.S. Oil Condition Monitoring Market Attractiveness, by Service Type, 2021‒2031
Figure 25: U.S. Oil Condition Monitoring Market Share Analysis, by Service Type, 2021 & 2031
Figure 26: U.S. Oil Condition Monitoring Market Size & Forecast, by Sampling Type, Revenue (US$ Mn), 2017‒2031
Figure 27: U.S. Oil Condition Monitoring Market Attractiveness, by Sampling Type, 2021‒2031
Figure 28: U.S. Oil Condition Monitoring Market Share Analysis, by Sampling Type, 2021 & 2031
Figure 29: U.S. Oil Condition Monitoring Market Size & Forecast, by Fluid Type, Revenue (US$ Mn), 2017‒2031
Figure 30: U.S. Oil Condition Monitoring Market Attractiveness, by Fluid Type, 2021‒2031
Figure 31: U.S. Oil Condition Monitoring Market Share Analysis, by Fluid Type, 2021 & 2031
Figure 32: U.S. Oil Condition Monitoring Market Size & Forecast, by Application, Revenue (US$ Mn), 2017‒2031
Figure 33: U.S. Oil Condition Monitoring Market Attractiveness, by Application, 2021‒2031
Figure 34: U.S. Oil Condition Monitoring Market Share Analysis, by Application, 2021 & 2031
Figure 35: U.S. Oil Condition Monitoring Market Size & Forecast, by End-use Industry, Revenue (US$ Mn), 2017‒2031
Figure 36: U.S. Oil Condition Monitoring Market Attractiveness, by End-use Industry, 2021‒2031
Figure 37: U.S. Oil Condition Monitoring Market Share Analysis, by End-use Industry, 2021 & 2031
Figure 38: Canada Oil Condition Monitoring, Value (US$ Mn), 2017‒2031
Figure 39: Canada Oil Condition Monitoring Market, Value (US$ Mn), 2017‒2031
Figure 40: Canada Oil Condition Monitoring Market Size & Forecast, by Service Type, Revenue (US$ Mn), 2017‒2031A
Figure 41: Canada Oil Condition Monitoring Market Attractiveness, by Service Type, 2021‒2031
Figure 42: Canada Oil Condition Monitoring Market Share Analysis, by Service Type, 2021 & 2031
Figure 43: Canada Oil Condition Monitoring Market Size & Forecast, by Sampling Type, Revenue (US$ Mn), 2017‒2031
Figure 44: Canada Oil Condition Monitoring Market Attractiveness, by Sampling Type, 2021‒2031
Figure 45: Canada Oil Condition Monitoring Market Share Analysis, by Sampling Type, 2021 & 2031
Figure 46: Canada Oil Condition Monitoring Market Size & Forecast, by Fluid Type, Revenue (US$ Mn), 2017‒2031
Figure 47: Canada Oil Condition Monitoring Market Attractiveness, by Fluid Type, 2021‒2031
Figure 48: Canada Oil Condition Monitoring Market Share Analysis, by Fluid Type, 2021 & 2031
Figure 49: Canada Oil Condition Monitoring Market Size & Forecast, by Application, Revenue (US$ Mn), 2017‒2031
Figure 50: Canada Oil Condition Monitoring Market Attractiveness, by Application, 2021‒2031
Figure 51: Canada Oil Condition Monitoring Market Share Analysis, by Application, 2021 & 2031
Figure 52: Canada Oil Condition Monitoring Market Size & Forecast, by End-use Industry, Revenue (US$ Mn), 2017‒2031
Figure 53: Canada Oil Condition Monitoring Market Attractiveness, by End-use Industry, 2021‒2031
Figure 54: Canada Oil Condition Monitoring Market Share Analysis, by End-use Industry, 2021 & 2031
Figure 55: North America Oil Condition Monitoring Services Market Share Analysis, by Company
Copyright © Transparency Market Research, Inc. All Rights reserved
Trust Online

North America Oil Condition Monitoring Services Market
