Non-Lethal Weapons Market - Snapshot
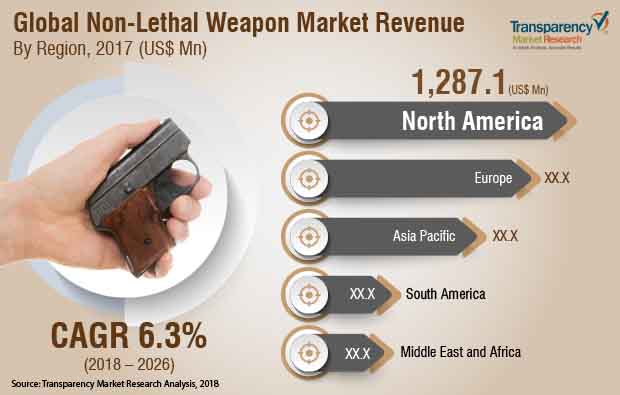
The global non-lethal weapons market is currently driven by growing adoption of advanced technology for the development of non-lethal weapons and demand for crowd control weapons to tackle protests and riots. Directed energy weapons such as Active Denial System (ADS) is a very effective non-lethal crowd control weapon suitable for deployment in unstable mob hit areas. Additionally, stun grenades, flash grenades, tear gases, water cannons, Long Range Acoustic Devices (LRAD) and others are being demanded by major regions. In 2017, the global non-lethal weapons market was valued at US$ 3,847.7 Mn and is anticipated to reach US$ 6,591.8 Mn by 2026, expanding at a CAGR of 6.3% during the forecast period from 2018 to 2026.
There has been a significant increase in protests and political instability over the last decade. Various countries across the globe have seen some major uprisings and social instability. In order to control crowds, governments are employing non-lethal weapons, which do not cause any threat to human life while controlling turbulence and law breaking. Demand for non-lethal weapons has increased to cope up with these challenges, and it is expected to boost this market over the forecast period.
The market for non-lethal weapons is expected to grow during the forecast period with the advancement in technology and increasing number of manufacturers of non-lethal weapons. With the development of alternative types of weapons, technology has played a crucial role in the growth of the non-lethal weapons market. Advances in various scientific fields, such as chemicals, electronics, electromagnetic, computers, and acoustics are producing new opportunities for weapons development. These technological developments provide accuracy in serving various tactical and strategic military tasks without increasing their destructive power. Technologically enhanced weapons help the military and law enforcement agencies to perform their operations effectively and reduce collateral damage without compromising on safety. Newer technologies include high-power microwave weapons capable of disabling unprotected electronic systems, advanced portable lasers for use against sensors and personnel, as well as chemical and biological agents capable of lowering the performance of equipment and/or attackers. Product innovation has also improved due to the various government policies and contracts related to the procurement of advanced weapons for various military and law enforcement requirements. The market for non-lethal weapons is expected to surge due to these factors.
However, legal restrictions on the possession of less lethal and self-defense weapons by civilians is likely to be the limiting factor for the growth of the non-lethal weapons market. The use of less lethal and self-defense weapons are intended to cause temporary injury and no fatal damage. However, the improper use of civilian less lethal and self-defense weapons on human beings can cause major injuries. These factors are expected to hamper the growth of the global non-lethal weapons market over the forecast period 2018-2026.
With the objective of expanding the market and meeting the demand, a number of players are increasing their offerings through strategic mergers & acquisitions and partnerships. Some of the prominent players identified in the non-lethal weapons market includes - BAE Systems Plc., Combined Systems, Inc., General Dynamics Corporation, Lamperd Less Lethal, Inc., LRAD Corporation., PepperBall Technologies, Inc., Safariland, LLC, Stringer Solutions, TASER International, Inc., The Boeing Company, The Raytheon Company, and Yellow Jacket Case.
Non-Lethal Weapons Market to Gain Momentum Owing to Rising Need for Crowd controlling at public assemblies
The increasing adoption of latest technology for manufacturing non-lethal weapons is expected to promote the growth of the global non-lethal weapons market in the coming years. In addition to this, the rising demand to control crowd in cases of protests, riots, and other gatherings by the governments of various nations are also adding boost to the overall growth of the market for non-lethal weapons.
There has been a critical expansion in fights and political unsteadiness in the recent past. Different nations across the globe are witnessing some significant uprisings and social chaos. To control swarms, governments are utilizing non-lethal weapons, which don't make any danger human existence while controlling choppiness and law breaking. Interest for non-lethal weapons has expanded to adapt up to these difficulties, and it is projected to aid in expansion of the market in the coming years.
With the improvement of elective kinds of weapons, innovation has assumed a significant part in the development of the non-lethal weapons market. Advances in different logical fields, like synthetic compounds, gadgets, electromagnetic, PCs, and acoustics are creating new freedoms for weapons improvement. These mechanical advancements give exactness in serving different strategic and vital military assignments without expanding their ruinous force. Mechanically upgraded weapons help the military and law requirement offices to play out their tasks successfully and diminish inadvertent blow-back without settling on wellbeing.
Fresher advances incorporate high-power microwave weapons fit for impairing unprotected electronic frameworks, progressed convenient lasers for use against sensors and staff, just as synthetic and organic specialists equipped for bringing down the presentation of gear or potentially assailants. Item development has additionally improved because of the different government arrangements and agreements identified with the acquisition of cutting edge weapons for different military and law authorization prerequisites. The market for non-lethal weapons is relied upon to flood because of these variables.
1. Preface
1.1. Market Definition and Scope
1.2. Market Segmentation
1.3. Key Research Objectives
1.4. Research Highlights
2. Assumptions and Research Methodology
3. Executive Summary: Global Non-Lethal Weapons Market
4. Market Overview
4.1. Introduction
4.2. Market Dynamics
4.2.1. Drivers
4.2.2. Restraints
4.2.3. Opportunities
4.3. Key Trends Analysis
4.4. Key Market Indicators
4.5. Global Non-Lethal Weapons Market Analysis and Forecast, 2016 - 2026
4.5.1. Market Revenue Projections (US$ Mn)
4.5.2. Price Trend Analysis
4.6. Porter’s Five Forces Analysis
4.7. Global Non-Lethal Value Chain Analysis
4.8. Market Outlook
5. Global Non-Lethal Weapons Market Analysis and Forecast, By Product
5.1. Overview & Definitions
5.2. Key Trends
5.3. Market Size (US$ Mn) Forecast, By Product, 2016 - 2026
5.3.1. Directed Energy Weapons
5.3.2. Conducted Energy Weapons
5.3.2.1. Stun Guns
5.3.2.2. Others
5.3.3. Gases and Sprays
5.3.4. Water Weapons
5.3.5. Others
5.4. Product Comparison Matrix
5.5. Market Attractiveness By Product
6. Global Non-Lethal Weapons Market Analysis and Forecast, By Technology
6.1. Overview & Definition
6.2. Key Trends
6.3. Market Size (US$ Mn) Forecast, By Technology, 2016 - 2026
6.3.1. Mechanical and Kinetic Non-Lethal Weapons
6.3.1.1. Blunt Impact Devices
6.3.1.2. Entanglements
6.3.1.3. Barriers
6.3.2. Chemical Non-Lethal Weapons
6.3.2.1. Malodorants
6.3.2.2. Foams
6.3.3. Acoustic Non-Lethal Weapons
6.3.3.1. Audible Weapons
6.3.3.2. Ultrasound Weapons
6.3.3.3. Infrasound Weapons
6.3.4. Electromagnetic Non-Lethal Weapons
6.3.4.1. Radio Frequency and Microwave Frequency
6.3.4.2. Infrared and Ultraviolet
6.3.4.3. Electroshock
6.3.4.4. Visible Light
6.3.5. Other Technologies
6.4. Technology Comparison Matrix
6.5. Market Attractiveness By Technology
7. Global Non-Lethal Weapons Market Analysis and Forecast, By Application
7.1. Overview & Definition
7.2. Key Trends
7.3. Market Size (US$ Mn) Forecast, By Application, 2016 - 2026
7.3.1. Military
7.3.2. Law Enforcement Agencies
7.3.3. Civilian
7.4. Application Comparison Matrix
7.5. Market Attractiveness By Application
8. Global Non-Lethal Weapons Market Analysis and Forecast, by Region
8.1. Key Findings
8.2. Market Size (US$ Mn) Forecast, by Region, 2016 - 2026
8.2.1. North America
8.2.2. Europe
8.2.3. Asia Pacific
8.2.4. Middle East and Africa
8.2.5. South America
8.3. Market Attractiveness by Region
9. North America Global Non-Lethal Weapons Market Analysis and Forecast
9.1. Key Findings
9.2. Key Trends
9.3. Market Size (US$ Mn) Forecast, By Product, 2016 - 2026
9.3.1. Directed Energy Weapons
9.3.2. Conducted Energy Weapons
9.3.2.1. Stun Guns
9.3.2.2. Others
9.3.3. Gases and Sprays
9.3.4. Water Weapons
9.3.5. Others
9.4. Market Size (US$ Mn) Forecast, By Technology, 2016 - 2026
9.4.1. Mechanical and Kinetic Non-Lethal Weapons
9.4.1.1. Blunt Impact Devices
9.4.1.2. Entanglements
9.4.1.3. Barriers
9.4.2. Chemical Non-Lethal Weapons
9.4.2.1. Malodorants
9.4.2.2. Foams
9.4.3. Acoustic Non-Lethal Weapons
9.4.3.1. Audible Weapons
9.4.3.2. Ultrasound Weapons
9.4.3.3. Infrasound Weapons
9.4.4. Electromagnetic Non-Lethal Weapons
9.4.4.1. Radio Frequency and Microwave Frequency
9.4.4.2. Infrared and Ultraviolet
9.4.4.3. Electroshock
9.4.4.4. Visible Light
9.4.5. Other Technologies
9.5. Market Size (US$ Mn) Forecast, By Application, 2016 - 2026
9.5.1. Military
9.5.2. Law Enforcement Agencies
9.5.3. Civilian
9.6. Market Size (US$ Mn) Forecast, By Country, 2016 - 2026
9.6.1. The U.S.
9.6.2. Canada
9.6.3. Rest of North America
9.7. Market Attractiveness Analysis
9.7.1. By Product
9.7.2. By Technology
9.7.3. By Application
9.7.4. By Country
10. Europe Global Non-Lethal Weapons Market Analysis and Forecast
10.1.Key Findings
10.2.Key Trends
10.3.Market Size (US$ Mn) Forecast, By Product, 2016 - 2026
10.3.1. Directed Energy Weapons
10.3.2. Conducted Energy Weapons
10.3.2.1. Stun Guns
10.3.2.2. Others
10.3.3. Gases and Sprays
10.3.4. Water Weapons
10.3.5. Others
10.4.Market Size (US$ Mn) Forecast, By Technology, 2016 - 2026
10.4.1. Mechanical and Kinetic Non-Lethal Weapons
10.4.1.1. Blunt Impact Devices
10.4.1.2. Entanglements
10.4.1.3. Barriers
10.4.2. Chemical Non-Lethal Weapons
10.4.2.1. Malodorants
10.4.2.2. Foams
10.4.3. Acoustic Non-Lethal Weapons
10.4.3.1. Audible Weapons
10.4.3.2. Ultrasound Weapons
10.4.3.3. Infrasound Weapons
10.4.4. Electromagnetic Non-Lethal Weapons
10.4.4.1. Radio Frequency and Microwave Frequency
10.4.4.2. Infrared and Ultraviolet
10.4.4.3. Electroshock
10.4.4.4. Visible Light
10.4.5. Other Technologies
10.5.Market Size (US$ Mn) Forecast, By Application, 2016 - 2026
10.5.1. Military
10.5.2. Law Enforcement Agencies
10.5.3. Civilian
10.6.Market Size (US$ Mn) Forecast, By Country, 2016 - 2026
10.6.1. Germany
10.6.2. France
10.6.3. UK
10.6.4. Rest of Europe
10.7.Market Attractiveness Analysis
10.7.1. By Product
10.7.2. By Technology
10.7.3. By Application
10.7.4. By Country
11. Asia Pacific Global Non-Lethal Weapons Market Analysis and Forecast
11.1.Key Findings
11.2.Key Trends
11.3.Market Size (US$ Mn) Forecast, By Product, 2016 - 2026
11.3.1. Directed Energy Weapons
11.3.2. Conducted Energy Weapons
11.3.2.1. Stun Guns
11.3.2.2. Others
11.3.3. Gases and Sprays
11.3.4. Water Weapons
11.3.5. Others
11.4.Market Size (US$ Mn) Forecast, By Technology, 2016 - 2026
11.4.1. Mechanical and Kinetic Non-Lethal Weapons
11.4.1.1. Blunt Impact Devices
11.4.1.2. Entanglements
11.4.1.3. Barriers
11.4.2. Chemical Non-Lethal Weapons
11.4.2.1. Malodorants
11.4.2.2. Foams
11.4.3. Acoustic Non-Lethal Weapons
11.4.3.1. Audible Weapons
11.4.3.2. Ultrasound Weapons
11.4.3.3. Infrasound Weapons
11.4.4. Electromagnetic Non-Lethal Weapons
11.4.4.1. Radio Frequency and Microwave Frequency
11.4.4.2. Infrared and Ultraviolet
11.4.4.3. Electroshock
11.4.4.4. Visible Light
11.4.5. Other Technologies
11.5.Market Size (US$ Mn) Forecast, By Application, 2016 - 2026
11.5.1. Military
11.5.2. Law Enforcement Agencies
11.5.3. Civilian
11.6.Market Size (US$ Mn) Forecast, By Country, 2016 - 2026
11.6.1. China
11.6.2. Japan
11.6.3. India
11.6.4. Australia
11.6.5. Rest of Asia Pacific
11.7.Market Attractiveness Analysis
11.7.1. By Product
11.7.2. By Technology
11.7.3. By Application
11.7.4. By Country
12. Middle East & Africa (MEA) Global Non-Lethal Weapons Market Analysis and Forecast
12.1.Key Findings
12.2.Key Trends
12.3.Market Size (US$ Mn) Forecast, By Product, 2016 - 2026
12.3.1. Directed Energy Weapons
12.3.2. Conducted Energy Weapons
12.3.2.1. Stun Guns
12.3.2.2. Others
12.3.3. Gases and Sprays
12.3.4. Water Weapons
12.3.5. Others
12.4. Market Size (US$ Mn) Forecast, By Technology, 2016 - 2026
12.4.1. Mechanical and Kinetic Non-Lethal Weapons
12.4.1.1. Blunt Impact Devices
12.4.1.2. Entanglements
12.4.1.3. Barriers
12.4.2. Chemical Non-Lethal Weapons
12.4.2.1. Malodorants
12.4.2.2. Foams
12.4.3. Acoustic Non-Lethal Weapons
12.4.3.1. Audible Weapons
12.4.3.2. Ultrasound Weapons
12.4.3.3. Infrasound Weapons
12.4.4. Electromagnetic Non-Lethal Weapons
12.4.4.1. Radio Frequency and Microwave Frequency
12.4.4.2. Infrared and Ultraviolet
12.4.4.3. Electroshock
12.4.4.4. Visible Light
12.4.5. Other Technologies
12.5. Market Size (US$ Mn) Forecast, By Application, 2016 - 2026
12.5.1. Military
12.5.2. Law Enforcement Agencies
12.5.3. Civilian
12.6. Market Size (US$ Mn) Forecast, By Country, 2016 - 2026
12.6.1. GCC
12.6.2. South Africa
12.6.3. Rest of MEA
12.7. Market Attractiveness Analysis
12.7.1. By Product
12.7.2. By Technology
12.7.3. By Application
12.7.4. By Country
13. South America Global Non-Lethal Weapons Market Analysis and Forecast
13.1. Key Findings
13.2. Key Trends
13.3. Market Size (US$ Mn) Forecast, By Product, 2016 - 2026
13.3.1. Directed Energy Weapons
13.3.2. Conducted Energy Weapons
13.3.2.1. Stun Guns
13.3.2.2. Others
13.3.3. Gases and Sprays
13.3.4. Water Weapons
13.3.5. Others
13.4. Market Size (US$ Mn) Forecast, By Technology, 2016 - 2026
13.4.1. Mechanical and Kinetic Non-Lethal Weapons
13.4.1.1. Blunt Impact Devices
13.4.1.2. Entanglements
13.4.1.3. Barriers
13.4.2. Chemical Non-Lethal Weapons
13.4.2.1. Malodorants
13.4.2.2. Foams
13.4.3. Acoustic Non-Lethal Weapons
13.4.3.1. Audible Weapons
13.4.3.2. Ultrasound Weapons
13.4.3.3. Infrasound Weapons
13.4.4. Electromagnetic Non-Lethal Weapons
13.4.4.1. Radio Frequency and Microwave Frequency
13.4.4.2. Infrared and Ultraviolet
13.4.4.3. Electroshock
13.4.4.4. Visible Light
13.4.5. Other Technologies
13.5. Market Size (US$ Mn) Forecast, By Application, 2016 - 2026
13.5.1. Military
13.5.2. Law Enforcement Agencies
13.5.3. Civilian
13.6. Market Size (US$ Mn) Forecast, By Country, 2016 - 2026
13.6.1. Brazil
13.6.2. Rest of South America
13.7.Market Attractiveness Analysis
13.7.1. By Product
13.7.2. By Technology
13.7.3. By Application
13.7.4. By Country
14. Competition Landscape
14.1. Market Player – Competition Matrix
14.2. Market Share Analysis By Company (2017)
14.3. Company Profiles (Details – Overview, Financials, SWOT Analysis, Recent Development, Strategy)
14.3.1. BAE Systems Plc.
14.3.2. Combined Systems, Inc.
14.3.3. General Dynamics Corporation
14.3.4. Lamperd Less Lethal, Inc.
14.3.5. LRAD Corporation
14.3.6. PepperBall Technologies, Inc.
14.3.7. Safariland, LLC
14.3.8. Stringer Solutions
14.3.9. TASER International, Inc.
14.3.10. The Boeing Company
14.3.11. The Raytheon Company
14.3.12. Yellow Jacket Case
15. Key Takeaways
List of Table
Table 1: Global Non-Lethal Weapons Market Size (US$ Mn) Forecast, by Product, 2016–2026
Table 2: Global Non-Lethal Weapons Market Size (US$ Mn) Forecast, by Technology, 2016–2026
Table 3: Global Non-Lethal Weapons Market Size (US$ Mn) Forecast, by Mechanical and Kinetic Non-Lethal Weapons, 2016–2026
Table 4: Global Non-Lethal Weapons Market Size (US$ Mn) Forecast, by Chemical Non-Lethal Weapons, 2016–2026
Table 5: Global Non-Lethal Weapons Market Size (US$ Mn) Forecast, by Acoustic Non-Lethal Weapons, 2016–2026
Table 6: Global Non-Lethal Weapons Market Size (US$ Mn) Forecast, by Electromagnetic Non-Lethal Weapons, 2016–2026
Table 7: Global Non-Lethal Weapons Market Size (US$ Mn) Forecast, by Application, 2016–2026
Table 8: Global Non-Lethal Weapons Market Revenue Forecast, by Region, 2016 – 2026 (US$ Mn)
Table 9: North America Non-Lethal Weapons Market Size (US$ Mn) Forecast, by Product, 2016–2026
Table 10: North America Non-Lethal Weapons Market Size (US$ Mn) Forecast, by Technology, 2016–2026
Table 11: North America Non-Lethal Weapons Market Size (US$ Mn) Forecast, by Mechanical and Kinetic Non-Lethal Weapons, 2016–2026
Table 12: North America Non-Lethal Weapons Market Size (US$ Mn) Forecast, by Chemical Non-Lethal Weapons, 2016–2026
Table 13: North America Non-Lethal Weapons Market Size (US$ Mn) Forecast, by Acoustic Non-Lethal Weapons, 2016–2026
Table 14: North America Non-Lethal Weapons Market Size (US$ Mn) Forecast, by Electromagnetic Non-Lethal Weapons, 2016–2026
Table 15: North America Non-Lethal Weapons Market Size (US$ Mn) Forecast, by Application, 2016–2026
Table 16: North America Non-Lethal Weapons Market Size (US$ Mn) Forecast, by Country 2016–2026
Table 17: The U.S. Non-Lethal Weapons Market Size (US$ Mn) Forecast, by Product, 2016–2026
Table 18: The U.S. Non-Lethal Weapons Market Size (US$ Mn) Forecast, by Technology, 2016–2026
Table 19: The U.S. Non-Lethal Weapons Market Size (US$ Mn) Forecast, by Mechanical and Kinetic Non-Lethal Weapons, 2016–2026
Table 20: The U.S. Non-Lethal Weapons Market Size (US$ Mn) Forecast, by Chemical Non-Lethal Weapons, 2016–2026
Table 21: The U.S. Non-Lethal Weapons Market Size (US$ Mn) Forecast, by Acoustic Non-Lethal Weapons, 2016–2026
Table 22: The U.S. Non-Lethal Weapons Market Size (US$ Mn) Forecast, by Electromagnetic Non-Lethal Weapons, 2016–2026
Table 23: The U.S. Non-Lethal Weapons Market Size (US$ Mn) Forecast, by Application, 2016–2026
Table 24: Canada Non-Lethal Weapons Market Size (US$ Mn) Forecast, by Product, 2016–2026
Table 25: Canada Non-Lethal Weapons Market Size (US$ Mn) Forecast, by Technology, 2016–2026
Table 26: Canada Non-Lethal Weapons Market Size (US$ Mn) Forecast, by Mechanical and Kinetic Non-Lethal Weapons, 2016–2026
Table 27: Canada Non-Lethal Weapons Market Size (US$ Mn) Forecast, by Chemical Non-Lethal Weapons, 2016–2026
Table 28: Canada Non-Lethal Weapons Market Size (US$ Mn) Forecast, by Acoustic Non-Lethal Weapons, 2016–2026
Table 29: Canada Non-Lethal Weapons Market Size (US$ Mn) Forecast, by Electromagnetic Non-Lethal Weapons, 2016–2026
Table 30: Canada Non-Lethal Weapons Market Size (US$ Mn) Forecast, by Application, 2016–2026
Table 31: Rest of North America Non-Lethal Weapons Market Size (US$ Mn) Forecast, by Product, 2016–2026
Table 32: Rest of North America Non-Lethal Weapons Market Size (US$ Mn) Forecast, by Technology, 2016–2026
Table 33: Rest of North America Non-Lethal Weapons Market Size (US$ Mn) Forecast, by Mechanical and Kinetic Non-Lethal Weapons, 2016–2026
Table 34: Rest of North America Non-Lethal Weapons Market Size (US$ Mn) Forecast, by Chemical Non-Lethal Weapons, 2016–2026
Table 35: Rest of North America Non-Lethal Weapons Market Size (US$ Mn) Forecast, by Acoustic Non-Lethal Weapons, 2016–2026
Table 36: Rest of North America Non-Lethal Weapons Market Size (US$ Mn) Forecast, by Electromagnetic Non-Lethal Weapons, 2016–2026
Table 37: Rest of North America Non-Lethal Weapons Market Size (US$ Mn) Forecast, by Application, 2016–2026
Table 38: Europe Non-Lethal Weapons Market Size (US$ Mn) Forecast, by Product, 2016–2026
Table 39: Europe Non-Lethal Weapons Market Size (US$ Mn) Forecast, by Technology, 2016–2026
Table 40: Europe Non-Lethal Weapons Market Size (US$ Mn) Forecast, by Mechanical and Kinetic Non-Lethal Weapons, 2016–2026
Table 41: Europe Non-Lethal Weapons Market Size (US$ Mn) Forecast, by Chemical Non-Lethal Weapons, 2016–2026
Table 42: Europe Non-Lethal Weapons Market Size (US$ Mn) Forecast, by Acoustic Non-Lethal Weapons, 2016–2026
Table 43: Europe Non-Lethal Weapons Market Size (US$ Mn) Forecast, by Electromagnetic Non-Lethal Weapons, 2016–2026
Table 44: Europe Non-Lethal Weapons Market Size (US$ Mn) Forecast, by Application, 2016–2026
Table 45: APAC Non-Lethal Weapons Market Size (US$ Mn) Forecast, by Product, 2016–2026
Table 46: APAC Non-Lethal Weapons Market Size (US$ Mn) Forecast, by Technology, 2016–2026
Table 47: APAC Non-Lethal Weapons Market Size (US$ Mn) Forecast, by Mechanical and Kinetic Non-Lethal Weapons, 2016–2026
Table 48: APAC Non-Lethal Weapons Market Size (US$ Mn) Forecast, by Chemical Non-Lethal Weapons, 2016–2026
Table 49: APAC Non-Lethal Weapons Market Size (US$ Mn) Forecast, by Acoustic Non-Lethal Weapons, 2016–2026
Table 50: APAC Non-Lethal Weapons Market Size (US$ Mn) Forecast, by Electromagnetic Non-Lethal Weapons, 2016–2026
Table 51: APAC Non-Lethal Weapons Market Size (US$ Mn) Forecast, by Application, 2016–2026
Table 52: MEA Non-Lethal Weapons Market Size (US$ Mn) Forecast, by Product, 2016–2026
Table 53: MEA Non-Lethal Weapons Market Size (US$ Mn) Forecast, by Technology, 2016–2026
Table 54: MEA Non-Lethal Weapons Market Size (US$ Mn) Forecast, by Mechanical and Kinetic Non-Lethal Weapons, 2016–2026
Table 55: MEA Non-Lethal Weapons Market Size (US$ Mn) Forecast, by Chemical Non-Lethal Weapons, 2016–2026
Table 56: MEA Non-Lethal Weapons Market Size (US$ Mn) Forecast, by Acoustic Non-Lethal Weapons, 2016–2026
Table 57: MEA Non-Lethal Weapons Market Size (US$ Mn) Forecast, by Electromagnetic Non-Lethal Weapons, 2016–2026
Table 58: MEA Non-Lethal Weapons Market Size (US$ Mn) Forecast, by Application, 2016–2026
Table 59: South America Non-Lethal Weapons Market Size (US$ Mn) Forecast, by Product, 2016–2026
Table 60: South America Non-Lethal Weapons Market Size (US$ Mn) Forecast, by Technology, 2016–2026
Table 61: South America Non-Lethal Weapons Market Size (US$ Mn) Forecast, by Mechanical and Kinetic Non-Lethal Weapons, 2016–2026
Table 62: South America Non-Lethal Weapons Market Size (US$ Mn) Forecast, by Chemical Non-Lethal Weapons, 2016–2026
Table 63: South America Non-Lethal Weapons Market Size (US$ Mn) Forecast, by Acoustic Non-Lethal Weapons, 2016–2026
Table 64: South America Non-Lethal Weapons Market Size (US$ Mn) Forecast, by Electromagnetic Non-Lethal Weapons, 2016–2026
Table 65: South America Non-Lethal Weapons Market Size (US$ Mn) Forecast, by Application, 2016–2026
Table 66: Global Non-Lethal Weapons Market Share Analysis by Company (2017)
List of Figures
Figure 1: Global Non-Lethal Weapons Market Size, Indicative (US$ Mn)
Figure 2: Global Non-Lethal Weapons Major Segments, Indicative (US$ Mn)
Figure 3: Global Non-Lethal Weapons Market Size, Indicative (US$ Mn), CAGR %
Figure 4: Global Non-Lethal Weapons Market, Share by Region, 2026
Figure 5: Global Non-Lethal Weapons Market – Insights
Figure 6: Executive Summary (Drivers, Restraints, & Key Trends)
Figure 7: Global Non-Lethal Weapons Market Revenue Forecast, 2016 – 2026 (US$ Mn)
Figure 8: Global Non-Lethal Weapons Market Y-O-Y growth
Figure 9: Non-Lethal Weapons Market Value Share by Product (2017)
Figure 10: Non-Lethal Weapons Market Value Share by Application (2017)
Figure 11: Non-Lethal Weapons Market Value Share by Technology (2017)
Figure 12: Non-Lethal Weapons Market Value Share by Region (2017)
Figure 13: Global Non-Lethal Weapons Market Share Analysis, by Product, 2018 and 2026
Figure 14: Global Non-Lethal Weapons Market, by Product, Directed Energy Weapons
Figure 15: Global Non-Lethal Weapons Market, by Product, Conducted Energy Weapons
Figure 16: Global Non-Lethal Weapons Market, by Product, Gases and Sprays
Figure 17: Global Non-Lethal Weapons Market, by Product, Water Weapons
Figure 18: Global Non-Lethal Weapons Market, by Product, Others
Figure 19: Global Non-Lethal Weapons Market Comparison Matrix, by Product
Figure 20: Global Non-Lethal Weapons Market Attractiveness Analysis, by Product
Figure 21: Global Non-Lethal Weapons Market Share Analysis, by Technology, 2018 and 2026
Figure 22: Global Non-Lethal Weapons Market, by Technology, Mechanical and Kinetic Non-Lethal Weapons
Figure 23: Global Non-Lethal Weapons Market, by Technology, Chemical Non-Lethal Weapons
Figure 24: Global Non-Lethal Weapons Market, by Product, Acoustic Non-Lethal Weapons
Figure 25: Global Non-Lethal Weapons Market, by Product, Electromagnetic Non-Lethal Weapons
Figure 26: Global Non-Lethal Weapons Market, by Product, Others
Figure 27: Global Non-Lethal Weapons Market Comparison Matrix, by Technology
Figure 28: Global Non-Lethal Weapons Market Attractiveness Analysis, by Technology
Figure 29: Global Non-Lethal Weapons Market Share Analysis, by Application, 2018 and 2026
Figure 30: Global Non-Lethal Weapons Market, Application, Military
Figure 31: Global Non-Lethal Weapons Market, by Application, Law Enforcement Agencies
Figure 32: Global Non-Lethal Weapons Market, Application, Civilian
Figure 33: Global Non-Lethal Weapons Market Comparison Matrix, by Application
Figure 34: Global Non-Lethal Weapons Market Attractiveness Analysis, by End Use
Figure 35: Global Non-Lethal Weapons Market, by Region, The North America
Figure 36: Global Non-Lethal Weapons Market, by Region, Europe
Figure 37: Global Non-Lethal Weapons Market, by Region, APAC
Figure 38: Global Non-Lethal Weapons Market, by Region, MEA
Figure 39: Global Non-Lethal Weapons Market, by Region, South America
Figure 40: Global Non-Lethal Weapons Market Attractiveness Analysis, by Region
Figure 41: North America Non-Lethal Weapons Market Revenue Forecast, 2016–2026 (US$ Mn)
Figure 42: North America Non-Lethal Weapons Market Value Share by Product (2017)
Figure 43: North America Non-Lethal Weapons Market Value Share by Technology (2017)
Figure 44: North America Non-Lethal Weapons Market Value Share by Application (2017)
Figure 45: North America Non-Lethal Weapons Market Value Share by Country (2017)
Figure 46: North America Non-Lethal Weapons Market Size (US$ Mn) Forecast, 2016–2026
Figure 47: North America Non-Lethal Weapons Market Size, Y-o-Y (In %) Growth Projections, 2016–2026
Figure 48: North America Non-Lethal Weapons Market Value Share Analysis, by Product, 2018 and 2026
Figure 49: North America Non-Lethal Weapons Market Value Share Analysis, by Technology, 2018 and 2026
Figure 50: North America Non-Lethal Weapons Market Value Share Analysis, by Application, 2018 and 2026
Figure 51: North America Non-Lethal Weapons Market Value Share Analysis by Country, 2018 and 2026
Figure 52: North America Non-Lethal Weapons Market Attractiveness Analysis, by Product
Figure 53: North America Non-Lethal Weapons Market Attractiveness Analysis, by Technology
Figure 54: North America Non-Lethal Weapons Market Attractiveness Analysis, by Application
Figure 55: North America Non-Lethal Weapons Market Attractiveness Analysis, by Country
Figure 56: The U.S. Non-Lethal Weapons Market Size (US$ Mn) Forecast, 2016–2026
Figure 57: The U.S. Non-Lethal Weapons Market Size, Y-o-Y (In %) Growth Projections, 2016–2026
Figure 58: The U.S. Non-Lethal Weapons Market Value Share Analysis, by Product, 2018 and 2026
Figure 59: The U.S. Non-Lethal Weapons Market Value Share Analysis, by Technology, 2018 and 2026
Figure 60: The U.S. Non-Lethal Weapons Market Value Share Analysis, by Application, 2018 and 2026
Figure 61: The U.S. Non-Lethal Weapons Market Attractiveness Analysis, by Product
Figure 62: The U.S. Non-Lethal Weapons Market Attractiveness Analysis, by Technology
Figure 63: The U.S. Non-Lethal Weapons Market Attractiveness Analysis, by Application
Figure 64: Canada Non-Lethal Weapons Market Size (US$ Mn) Forecast, 2016–2026
Figure 65: Canada Non-Lethal Weapons Market Size, Y-o-Y (In %) Growth Projections, 2016–2026
Figure 66: Canada Non-Lethal Weapons Market Value Share Analysis, by Product, 2018 and 2026
Figure 67: Canada Non-Lethal Weapons Market Value Share Analysis, by Technology, 2018 and 2026
Figure 68: Canada Non-Lethal Weapons Market Value Share Analysis, by Application, 2018 and 2026
Figure 69: Canada Non-Lethal Weapons Market Attractiveness Analysis, by Product
Figure 70: Canada Non-Lethal Weapons Market Attractiveness Analysis, by Technology
Figure 71: Canada Non-Lethal Weapons Market Attractiveness Analysis, by Application
Figure 72: Rest of North America Non-Lethal Weapons Market Size (US$ Mn) Forecast, 2016–2026
Figure 73: Rest of North America Non-Lethal Weapons Market Size, Y-o-Y (In %) Growth Projections, 2016–2026
Figure 74: Rest of North America Non-Lethal Weapons Market Value Share Analysis, by Product, 2018 and 2026
Figure 75: Rest of North America Non-Lethal Weapons Market Value Share Analysis, by Technology, 2018 and 2026
Figure 76: Rest of North America Non-Lethal Weapons Market Value Share Analysis, by Application, 2018 and 2026
Figure 77: Rest of North America Non-Lethal Weapons Market Attractiveness Analysis, by Product
Figure 78: Rest of North America Non-Lethal Weapons Market Attractiveness Analysis, by Technology
Figure 79: Rest of North America Non-Lethal Weapons Market Attractiveness Analysis, by Application
Figure 80: Europe Non-Lethal Weapons Market Revenue Forecast, 2016–2026 (US$ Mn)
Figure 81: Europe Non-Lethal Weapons Market Value Share by Product (2017)
Figure 82: Europe Non-Lethal Weapons Market Value Share by Technology (2017)
Figure 83: Europe Non-Lethal Weapons Market Value Share by Application (2017)
Figure 84: Europe Non-Lethal Weapons Market Value Share by Country (2017)
Figure 85: Europe Non-Lethal Weapons Market Size (US$ Mn) Forecast, 2016–2026
Figure 86: Europe Non-Lethal Weapons Market Size, Y-o-Y (In %) Growth Projections, 2016–2026
Figure 87: Europe Non-Lethal Weapons Market Value Share Analysis, by Product, 2018 and 2026
Figure 88: Europe Non-Lethal Weapons Market Value Share Analysis, by Technology, 2018 and 2026
Figure 89: Europe Non-Lethal Weapons Market Value Share Analysis, by Application, 2018 and 2026
Figure 90: APAC Non-Lethal Weapons Market Revenue Forecast, 2016–2026 (US$ Mn)
Figure 91: APAC Non-Lethal Weapons Market Value Share by Product (2017)
Figure 92: APAC Non-Lethal Weapons Market Value Share by Technology (2017)
Figure 93: APAC Non-Lethal Weapons Market Value Share by Application (2017)
Figure 94: APAC Non-Lethal Weapons Market Value Share by Country (2017)
Figure 95: APAC Non-Lethal Weapons Market Size (US$ Mn) Forecast, 2016–2026
Figure 96: APAC Non-Lethal Weapons Market Size, Y-o-Y (In %) Growth Projections, 2016–2026
Figure 97: APAC Non-Lethal Weapons Market Value Share Analysis, by Product, 2018 and 2026
Figure 98: APAC Non-Lethal Weapons Market Value Share Analysis, by Technology, 2018 and 2026
Figure 99: APAC Non-Lethal Weapons Market Value Share Analysis, by Application, 2018 and 2026
Figure 100: MEA Non-Lethal Weapons Market Revenue Forecast, 2016–2026 (US$ Mn)
Figure 101: MEA Non-Lethal Weapons Market Value Share by Product (2017)
Figure 102: MEA Non-Lethal Weapons Market Value Share by Technology (2017)
Figure 103: MEA Non-Lethal Weapons Market Value Share by Application (2017)
Figure 104: MEA Non-Lethal Weapons Market Value Share by Country (2017)
Figure 105: MEA Non-Lethal Weapons Market Size (US$ Mn) Forecast, 2016–2026
Figure 106: MEA Non-Lethal Weapons Market Size, Y-o-Y (In %) Growth Projections, 2016–2026
Figure 107: MEA Non-Lethal Weapons Market Value Share Analysis, by Product, 2018 and 2026
Figure 108: MEA Non-Lethal Weapons Market Value Share Analysis, by Technology, 2018 and 2026
Figure 109: MEA Non-Lethal Weapons Market Value Share Analysis, by Application, 2018 and 2026
Figure 110: South America Non-Lethal Weapons Market Revenue Forecast, 2016–2026 (US$ Mn)
Figure 111: South America Non-Lethal Weapons Market Value Share by Product (2017)
Figure 112: South America Non-Lethal Weapons Market Value Share by Technology (2017)
Figure 113: South America Non-Lethal Weapons Market Value Share by Application (2017)
Figure 114: South America Non-Lethal Weapons Market Value Share by Country (2017)
Figure 115: South America Non-Lethal Weapons Market Size (US$ Mn) Forecast, 2016–2026
Figure 116: South America Non-Lethal Weapons Market Size, Y-o-Y (In %) Growth Projections, 2016–2026
Figure 117: South America Non-Lethal Weapons Market Value Share Analysis, by Product, 2018 and 2026
Figure 118: South America Non-Lethal Weapons Market Value Share Analysis, by Technology, 2018 and 2026
Figure 119: South America Non-Lethal Weapons Market Value Share Analysis, by Application, 2018 and 2026
Copyright © Transparency Market Research, Inc. All Rights reserved
Trust Online

Non-Lethal Weapons Market
