An electric switchgear is a centralized collection of circuit breakers, switches, and fuses that protect, control and, isolate electrical equipment. A switchgear in the range between 3KV and 40KV is categorized as a medium-voltage switchgear.
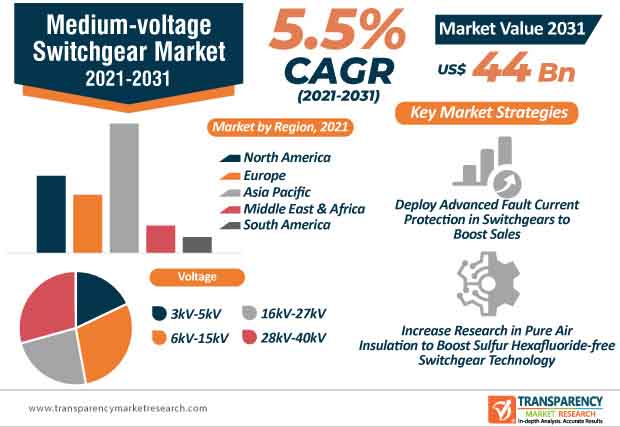
A TMR study projects the global medium-voltage switchgear market to grow at a compound annual growth rate (CAGR) of 5.5% during the forecast period between 2021 and 2031 and it is anticipated to reach a valuation of US $ 44 Bn, by 2031.
A rise in demand for medium-voltage switchgears for commercial construction projects which needs effective electricity transmission has emerged as the main driving factor for the medium-voltage switchgear market.
The construction industry in various developing countries such as India, Indonesia, and Brazil is witnessing substantial growth because of massiveexpenditures for infrastructural and residential development.
These facilities will require medium-voltage switchgear products in varying quantities, which could fuel the growth of the medium-voltage switchgear market. Factors such as energy savings, faster delivery times with digital systems, and reduced weight are emerging as revenue-generating opportunities for the market.
The global medium-voltage switchgear market has been studied based on type, voltage, insulation, end-user and region.
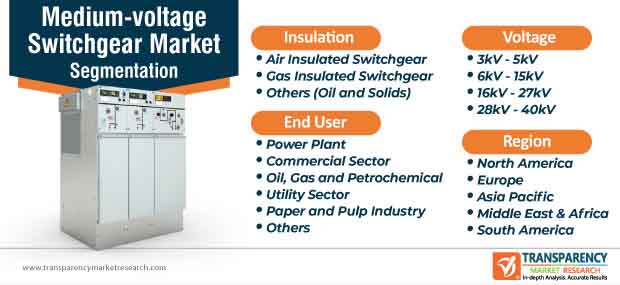
Based on type, there are two types of medium-voltage switchgears: Indoor and Outdoor. The indoor medium-voltage switchgear is more safe and reliable than the outdoor medium-voltage switchgear. An indoor switchgear also tends to consume lesser space as compared to outdoor switchgear. But the installation costs for the indoor switchgear is high, which could impact its demand in future.
On the other hand, outdoor switchgear needs less infrastructural capacity for installation and the primary erection work is lower, as compared to indoor switchgear. But the maintenance costs for outdoor switchgear is higher than indoor switchgear.
Based on voltage, there are four different ranges: 3KV-6KV, 6KV-15KV, 16KV-27KV, and 27KV-40KV.
Based on insulation, there are two types of switchgear- air-insulated switchgear and gas-insulated switchgear.
Based on endusers, the medium-voltage switchgear market is divided into the utility sector, paper and pulp sector, commercial sector, power plant sector, and oil, gas and petrochemical sectors. The extensive use of medium-voltage switchgears in these industries is expected to fuel the growth of medium-voltage switchgear market in future.
Based on region, the global medium-voltage switchgear market is divided into North America, Asia Pacific, Europe, South America, and Middle East and Africa. The most demand for medium-voltage switchgears have been witnessed in Europe, North America, and Asia Pacific.
Some of the important players in the medium-voltage switchgear market include Schneider Electric SE, Siemens AG, General Electric, BHEL, and Eaton Corporation PLC.
Market players such as Schnider Electric are focusing on designing medium-voltage switchgears, which are cost-effective and technologically advanced.
Medium-voltage switchgear market players are also becoming aware of climate change and its effects. As a result, they are looking at digital switchgears as well as pure air technology. A benefit of digital switchgear is they help to decrease ownership costs.
Pure air technology is expected to become prominent in several electric utilities and commercial and industrial applications as well, in future.
Analysts also believe that companies must look to raise their research in pure air technology, which could help develop switchgears, which are free of sulfur hexafluoride.
Medium-voltage switchgear market players are raising their availability of pre-assembled systems which is a faster and more secure mode to access power with restricted investments.
The customization of medium-voltage switchgear is proving useful for stakeholders to enhance the revenue streams.
Companies in the medium-voltage switchgear market in various parts of the world are experiencing different types of challenges because of the COVID-19 pandemic.
Manufacturers in the medium-voltage switchgear market are relying on 24/7 technical support as well as digital resiliency to offer quality customer solutions.
Medium-voltage Switchgear Market to expand at a CAGR of 5.5% during the forecast period 2031
Asia Pacific holds highest share during 2021-2031
Key players operating in the global medium-voltage switchgear market are Siemens AG, General Electric, Schneider Electric SE, Eaton Corporation Plc., Bharat Heavy Electricals Limited, Mitsubishi Electric Corporation, ABB Ltd., Powell Industries, Elatec Power Distribution GmbH, and Chint Group.
Medium-voltage Switchgear Market is expected to rise to US$ 44 Bn by 2031
The Medium-voltage Switchgear Market is studied from 2021-2031
1. Global Medium-voltage Switchgear Market - Executive Summary
1.1. Global Medium-voltage Switchgear Market Country Analysis
1.2. Competition Blueprint
1.3. Technology Time Line Mapping
1.4. TMR Analysis and Recommendations
2. Market Overview
2.1. Market Introduction
2.2. Market Definition
2.3. Market Taxonomy
3. Market Dynamics
3.1. Macroeconomic Factors
3.2. Drivers
3.2.1. Economic Drivers
3.2.2. Supply Side Drivers
3.2.3. Demand Side Drivers
3.3. Market Restraints
3.4. Market Trends
3.5. Trend Analysis- Impact on Time Line (2021-2031)
4. Associated Industry and Key Indicator Assessment
4.1. Value Chain Analysis
4.2. Technology Roadmap Analysis
4.3. Porter Five Forces Analysis
5. Global Medium-voltage Switchgear Market Analysis and Forecast
5.1. Market Size Analysis (2017-2019) and Forecast (2021-2031)
5.1.1. Market Value (US$ Mn) and Volume (Million Units) and Y-o-Y Growth
5.2. Global Medium-voltage Switchgear Market Scenario Forecast (Optimistic, Likely, and Conservative Market Conditions)
5.2.1. Forecast Factors and Relevance of Impact
5.2.2. Regional Medium-voltage Switchgear Market Business Performance Summary
6. Global Medium-voltage Switchgear Market Analysis By Voltage
6.1. Introduction
6.1.1. Y-o-Y Growth Comparison By Voltage
6.2. Medium-voltage Switchgear Market Size (US$ Mn) and Volume (Million Units) Analysis & Forecast, By Voltage, 2017-2031
6.2.1. 3kV - 5kV
6.2.2. 6kV - 15kV
6.2.3. 16kV - 27kV
6.2.4. 28kV - 40kV
6.3. Market Attractiveness Analysis By Voltage
7. Global Medium-voltage Switchgear Market Analysis By Insulation
7.1. Introduction
7.1.1. Y-o-Y Growth Comparison By Insulation
7.2. Medium-voltage Switchgear Market Size (US$ Mn) and Volume (Million Units) Analysis & Forecast, By Insulation, 2017-2031
7.2.1. Air Insulated Switchgear
7.2.2. Gas Insulated Switchgear
7.2.3. Others (Oil and Solids)
7.3. Market Attractiveness Analysis By Insulation
8. Global Medium-voltage Switchgear Market Analysis By End-user
8.1. Introduction
8.1.1. Y-o-Y Growth Comparison By End-user
8.2. Medium-voltage Switchgear Market Size (US$ Mn) Analysis & Forecast, By End-user, 2017-2031
8.2.1. Power Plant
8.2.2. Commercial Sector
8.2.3. Oil, Gas and Petrochemical
8.2.4. Utility Sector
8.2.5. Paper and Pulp Industry
8.2.6. Others
8.3. Market Attractiveness Analysis By End-user
9. Global Medium-voltage Switchgear Market Analysis and Forecast, By Region
9.1. Introduction
9.1.1. Basis Point Share (BPS) Analysis By Region
9.2. Medium-voltage Switchgear Market Size (US$ Mn) and Volume (Million Units) Analysis & Forecast, By Region, 2017-2031
9.2.1. North America
9.2.2. Europe
9.2.3. Asia Pacific
9.2.4. Middle East & Africa
9.2.5. South America
9.3. Market Attractiveness Analysis By Region
10. North America Medium-voltage Switchgear Market Analysis and Forecast
10.1. Introduction
10.2. Drivers and Restraints: Impact Analysis
10.3. Medium-voltage Switchgear Market Size (US$ Mn) and Volume (Million Units) Analysis & Forecast, By Voltage, 2017-2031
10.3.1. 3kV - 5kV
10.3.2. 6kV - 15kV
10.3.3. 16kV - 27kV
10.3.4. 28kV - 40kV
10.4. Medium-voltage Switchgear Market Size (US$ Mn) and Volume (Million Units) Analysis & Forecast, By Insulation, 2017-2031
10.4.1. Air Insulated Switchgear
10.4.2. Gas Insulated Switchgear
10.4.3. Others (Oil and Solids)
10.5. Medium-voltage Switchgear Market Size (US$ Mn) Analysis & Forecast, By End-user, 2017-2031
10.5.1. Power Plant
10.5.2. Commercial Sector
10.5.3. Oil, Gas and Petrochemical
10.5.4. Utility Sector
10.5.5. Paper and Pulp Industry
10.5.6. Others
10.6. Medium-voltage Switchgear Market Size (US$ Mn) and Volume (Million Units) Analysis & Forecast, By Country, 2017-2031
10.6.1. U.S.
10.6.2. Canada
10.6.3. Rest of North America
10.7. Market Attractiveness Analysis
10.7.1. Voltage
10.7.2. Insulation
10.7.3. End-user
10.7.4. Country
11. Europe Medium-voltage Switchgear Market Analysis and Forecast
11.1. Introduction
11.2. Drivers and Restraints: Impact Analysis
11.3. Medium-voltage Switchgear Market Size (US$ Mn) and Volume (Million Units) Analysis & Forecast, By Voltage, 2017-2031
11.3.1. 3kV - 5kV
11.3.2. 6kV - 15kV
11.3.3. 16kV - 27kV
11.3.4. 28kV - 40kV
11.4. Medium-voltage Switchgear Market Size (US$ Mn) and Volume (Million Units) Analysis & Forecast, By Insulation, 2017-2031
11.4.1. Air Insulated Switchgear
11.4.2. Gas Insulated Switchgear
11.4.3. Others (Oil and Solids)
11.5. Medium-voltage Switchgear Market Size (US$ Mn) Analysis & Forecast, By End-user, 2017-2031
11.5.1. Power Plant
11.5.2. Commercial Sector
11.5.3. Oil, Gas and Petrochemical
11.5.4. Utility Sector
11.5.5. Paper and Pulp Industry
11.5.6. Others
11.6. Medium-voltage Switchgear Market Size (US$ Mn) and Volume (Million Units) Analysis & Forecast, By Country & Sub-region, 2017-2031
11.6.1. U.K.
11.6.2. Germany
11.6.3. France
11.6.4. Italy
11.6.5. Russia
11.6.6. Rest of Europe
11.7. Market Attractiveness Analysis
11.7.1. Voltage
11.7.2. Insulation
11.7.3. End-user
11.7.4. Country
12. Asia Pacific Medium-voltage Switchgear Market Analysis and Forecast
12.1. Introduction
12.2. Drivers and Restraints: Impact Analysis
12.3. Medium-voltage Switchgear Market Size (US$ Mn) and Volume (Million Units) Analysis & Forecast, By Voltage, 2017-2031
12.3.1. 3kV - 5kV
12.3.2. 6kV - 15kV
12.3.3. 16kV - 27kV
12.3.4. 28kV - 40kV
12.4. Medium-voltage Switchgear Market Size (US$ Mn) and Volume (Million Units) Analysis & Forecast, By Insulation, 2017-2031
12.4.1. Air Insulated Switchgear
12.4.2. Gas Insulated Switchgear
12.4.3. Others (Oil and Solids)
12.5. Medium-voltage Switchgear Market Size (US$ Mn) Analysis & Forecast, By End-user, 2017-2031
12.5.1. Power Plant
12.5.2. Commercial Sector
12.5.3. Oil, Gas and Petrochemical
12.5.4. Utility Sector
12.5.5. Paper and Pulp Industry
12.5.6. Others
12.6. Medium-voltage Switchgear Market Size (US$ Mn) and Volume (Million Units) Analysis & Forecast, By Country & Sub-region, 2017-2031
12.6.1. China
12.6.2. India
12.6.3. Japan
12.6.4. Rest of Asia Pacific
12.7. Market Attractiveness Analysis
12.7.1. Voltage
12.7.2. Insulation
12.7.3. End-user
12.7.4. Country
13. Middle East & Africa (MEA) Medium-voltage Switchgear Market Analysis and Forecast
13.1. Introduction
13.2. Drivers and Restraints: Impact Analysis
13.3. Medium-voltage Switchgear Market Size (US$ Mn) and Volume (Million Units) Analysis & Forecast, By Voltage, 2017-2031
13.3.1. 3kV - 5kV
13.3.2. 6kV - 15kV
13.3.3. 16kV - 27kV
13.3.4. 28kV - 40kV
13.4. Medium-voltage Switchgear Market Size (US$ Mn) and Volume (Million Units) Analysis & Forecast, By Insulation, 2017-2031
13.4.1. Air Insulated Switchgear
13.4.2. Gas Insulated Switchgear
13.4.3. Others (Oil and Solids)
13.5. Medium-voltage Switchgear Market Size (US$ Mn) Analysis & Forecast, By End-user, 2017-2031
13.5.1. Power Plant
13.5.2. Commercial Sector
13.5.3. Oil, Gas and Petrochemical
13.5.4. Utility Sector
13.5.5. Paper and Pulp Industry
13.5.6. Others
13.6. Medium-voltage Switchgear Market Size (US$ Mn) and Volume (Million Units) Analysis & Forecast, By Country & Sub-region, 2017-2031
13.6.1. GCC
13.6.2. South Africa
13.6.3. Rest of Middle East & Africa
13.7. Market Attractiveness Analysis
13.7.1. Voltage
13.7.2. Insulation
13.7.3. End-user
13.7.4. Country
14. South America Medium-voltage Switchgear Market Analysis and Forecast
14.1. Introduction
14.2. Drivers and Restraints: Impact Analysis
14.3. Medium-voltage Switchgear Market Size (US$ Mn) and Volume (Million Units) Analysis & Forecast, By Voltage, 2017-2031
14.3.1. 3kV - 5kV
14.3.2. 6kV - 15kV
14.3.3. 16kV - 27kV
14.3.4. 28kV - 40kV
14.4. Medium-voltage Switchgear Market Size (US$ Mn) and Volume (Million Units) Analysis & Forecast, By Insulation, 2017-2031
14.4.1. Air Insulated Switchgear
14.4.2. Gas Insulated Switchgear
14.4.3. Others (Oil and Solids)
14.5. Medium-voltage Switchgear Market Size (US$ Mn) Analysis & Forecast, By End-user, 2017-2031
14.5.1. Power Plant
14.5.2. Commercial Sector
14.5.3. Oil, Gas and Petrochemical
14.5.4. Utility Sector
14.5.5. Paper and Pulp Industry
14.5.6. Others
14.6. Medium-voltage Switchgear Market Size (US$ Mn) and Volume (Million Units) Analysis & Forecast, By Country & Sub-region, 2017-2031
14.6.1. Brazil
14.6.2. Rest of South America
14.7. Market Attractiveness Analysis
14.7.1. Voltage
14.7.2. Insulation
14.7.3. End-user
14.7.4. Country
15. Competition Assessment
15.1. Global Medium-voltage Switchgear Market Structure Analysis
15.2. Global Medium-voltage Switchgear Market Company Share Analysis, by Value (2020)
16. Competition Deep-dive (Manufacturers/Suppliers)
16.1. Siemens AG
16.1.1. Overview
16.1.2. Product Portfolio
16.1.3. Sales Footprint
16.1.4. Channel Footprint
16.1.4.1. Distributors List
16.1.5. Strategy Overview
16.1.5.1. Marketing Strategy
16.1.5.2. Culture Strategy
16.1.5.3. Channel Strategy
16.1.6. SWOT Analysis
16.1.7. Financial Analysis
16.1.8. Revenue Share
16.1.8.1. By Region
16.1.9. Key Clients
16.1.10. Analyst Comments
16.2. General Electric
16.2.1. Overview
16.2.2. Product Portfolio
16.2.3. Sales Footprint
16.2.4. Channel Footprint
16.2.4.1. Distributors List
16.2.5. Strategy Overview
16.2.5.1. Marketing Strategy
16.2.5.2. Culture Strategy
16.2.5.3. Channel Strategy
16.2.6. SWOT Analysis
16.2.7. Financial Analysis
16.2.8. Revenue Share
16.2.8.1. By Region
16.2.9. Key Clients
16.2.10. Analyst Comments
16.3. Schneider Electric SE
16.3.1. Overview
16.3.2. Product Portfolio
16.3.3. Sales Footprint
16.3.4. Channel Footprint
16.3.4.1. Distributors List
16.3.5. Strategy Overview
16.3.5.1. Marketing Strategy
16.3.5.2. Culture Strategy
16.3.5.3. Channel Strategy
16.3.6. SWOT Analysis
16.3.7. Financial Analysis
16.3.8. Revenue Share
16.3.8.1. By Region
16.3.9. Key Clients
16.3.10. Analyst Comments
16.4. Eaton Corporation Plc.
16.4.1. Overview
16.4.2. Product Portfolio
16.4.3. Sales Footprint
16.4.4. Channel Footprint
16.4.4.1. Distributors List
16.4.5. Strategy Overview
16.4.5.1. Marketing Strategy
16.4.5.2. Culture Strategy
16.4.5.3. Channel Strategy
16.4.6. SWOT Analysis
16.4.7. Financial Analysis
16.4.8. Revenue Share
16.4.8.1. By Region
16.4.9. Key Clients
16.4.10. Analyst Comments
16.5. Bharat Heavy Electricals Limited
16.5.1. Overview
16.5.2. Product Portfolio
16.5.3. Sales Footprint
16.5.4. Channel Footprint
16.5.4.1. Distributors List
16.5.5. Strategy Overview
16.5.5.1. Marketing Strategy
16.5.5.2. Culture Strategy
16.5.5.3. Channel Strategy
16.5.6. SWOT Analysis
16.5.7. Financial Analysis
16.5.8. Revenue Share
16.5.8.1. By Region
16.5.9. Key Clients
16.5.10. Analyst Comments
16.6. Mitsubishi Electric Corporation
16.6.1. Overview
16.6.2. Product Portfolio
16.6.3. Sales Footprint
16.6.4. Channel Footprint
16.6.4.1. Distributors List
16.6.5. Strategy Overview
16.6.5.1. Marketing Strategy
16.6.5.2. Culture Strategy
16.6.5.3. Channel Strategy
16.6.6. SWOT Analysis
16.6.7. Financial Analysis
16.6.8. Revenue Share
16.6.8.1. By Region
16.6.9. Key Clients
16.6.10. Analyst Comments
16.7. ABB Ltd.
16.7.1. Overview
16.7.2. Product Portfolio
16.7.3. Sales Footprint
16.7.4. Channel Footprint
16.7.4.1. Distributors List
16.7.5. Strategy Overview
16.7.5.1. Marketing Strategy
16.7.5.2. Culture Strategy
16.7.5.3. Channel Strategy
16.7.6. SWOT Analysis
16.7.7. Financial Analysis
16.7.8. Revenue Share
16.7.8.1. By Region
16.7.9. Key Clients
16.7.10. Analyst Comments
16.8. Powell Industries
16.8.1. Overview
16.8.2. Product Portfolio
16.8.3. Sales Footprint
16.8.4. Channel Footprint
16.8.4.1. Distributors List
16.8.5. Strategy Overview
16.8.5.1. Marketing Strategy
16.8.5.2. Culture Strategy
16.8.5.3. Channel Strategy
16.8.6. SWOT Analysis
16.8.7. Financial Analysis
16.8.8. Revenue Share
16.8.8.1. By Region
16.8.9. Key Clients
16.8.10. Analyst Comments
16.9. Elatec Power Distribution GmbH
16.9.1. Overview
16.9.2. Product Portfolio
16.9.3. Sales Footprint
16.9.4. Channel Footprint
16.9.4.1. Distributors List
16.9.5. Strategy Overview
16.9.5.1. Marketing Strategy
16.9.5.2. Culture Strategy
16.9.5.3. Channel Strategy
16.9.6. SWOT Analysis
16.9.7. Financial Analysis
16.9.8. Revenue Share
16.9.8.1. By Region
16.9.9. Key Clients
16.9.10. Analyst Comments
16.10. Chint Group
16.10.1. Overview
16.10.2. Product Portfolio
16.10.3. Sales Footprint
16.10.4. Channel Footprint
16.10.4.1. Distributors List
16.10.5. Strategy Overview
16.10.5.1. Marketing Strategy
16.10.5.2. Culture Strategy
16.10.5.3. Channel Strategy
16.10.6. SWOT Analysis
16.10.7. Financial Analysis
16.10.8. Revenue Share
16.10.8.1. By Region
16.10.9. Key Clients
16.10.10. Analyst Comments
16.11. Others (On additional request)
17. Recommendation- Critical Success Factors
18. Research Methodology
19. Assumptions & Acronyms Used
List of Tables
Table 01: Global Medium Voltage Switchgear Market Revenue (US$ Mn), By Voltage, 2017–2031
Table 02: Global Medium Voltage Switchgear Market Volume (Thousand Units), By Voltage, 2017–2031
Table 03: Global Medium Voltage Switchgear Market Revenue (US$ Mn), By Insulation , 2017–2031
Table 04: Global Medium Voltage Switchgear Market Volume (Thousand Units), By Insulation, 2017–2031
Table 05: Global Medium Voltage Switchgear Market Revenue (US$ Mn), By End-user, 2017–2031
Table 06: Global Medium Voltage Switchgear Market Volume (Thousand Units), By End-user, 2017–2031
Table 07: Global Medium Voltage Switchgear Market Revenue (US$ Mn), by Region, 2017–2031
Table 08: Global Medium Voltage Switchgear Market Volume (Thousand Units), by Region, 2017–2031
Table 09: North America Medium Voltage Switchgear Market Revenue (US$ Mn), By Voltage, 2017–2031
Table 10: North America Medium Voltage Switchgear Market Volume (Thousand Units), By Voltage , 2017–2031
Table 11: North America Medium Voltage Switchgear Market Revenue (US$ Mn), By Insulation, 2017–2031
Table 12: North America Medium Voltage Switchgear Market Volume (Thousand Units), By Insulation, 2017–2031
Table 13: North America Medium Voltage Switchgear Market Revenue (US$ Mn), By End-user, 2017–2031
Table 14: North America Medium Voltage Switchgear Market Volume (Thousand Units), by End-user, 2017–2031
Table 15: North America Medium Voltage Switchgear Market Revenue (US$ Mn), by Country, 2017–2031
Table 16: North America Medium Voltage Switchgear Market Volume (Thousand Units), by Country, 2017–2031
Table 17: Europe Medium Voltage Switchgear Market Revenue (US$ Mn), By Voltage, 2017–2031
Table 18: Europe Medium Voltage Switchgear Market Volume (Thousand Units), By Voltage, 2017–2031
Table 19: Europe Medium Voltage Switchgear Market Revenue (US$ Mn), By Insulation, 2017–2031
Table 20: Europe Medium Voltage Switchgear Market Volume (Thousand Units), By Insulation, 2017–2031
Table 21: Europe Medium Voltage Switchgear Market Revenue (US$ Mn), By End-user, 2017–2031
Table 22: Europe Medium Voltage Switchgear Market Volume (Thousand Units), by End-user, 2017–2031
Table 23: Europe Medium Voltage Switchgear Market Revenue (US$ Mn), by Country, 2017–2031
Table 24: Europe Medium Voltage Switchgear Market Volume (Thousand Units), by Country, 2017–2031
Table 25: Asia Pacific Medium Voltage Switchgear Market Revenue (US$ Mn), By Voltage, 2017–2031
Table 26: Asia Pacific Medium Voltage Switchgear Market Volume (Thousand Units), By Voltage, 2017–2031
Table 27: Asia Pacific Medium Voltage Switchgear Market Revenue (US$ Mn), By Insulation, 2017–2031
Table 28: Asia Pacific Medium Voltage Switchgear Market Volume (Thousand Units), By Insulation, 2017–2031
Table 29: Asia Pacific Medium Voltage Switchgear Market Revenue (US$ Mn), By End-user, 2017–2031
Table 30: Asia Pacific Medium Voltage Switchgear Market Volume (Thousand Units), by End-user, 2017–2031
Table 31: Asia Pacific Medium Voltage Switchgear Market Revenue (US$ Mn), by Country, 2017–2031
Table 32: Asia Pacific Medium Voltage Switchgear Market Volume (Thousand Units), by Country, 2017–2031
Table 33: Middle East & Africa Medium Voltage Switchgear Market Revenue (US$ Mn), By Voltage, 2017–2031
Table 34: Middle East & Africa Medium Voltage Switchgear Market Volume (Thousand Units), By Voltage, 2017–2031
Table 35: Middle East & Africa Medium Voltage Switchgear Market Revenue (US$ Mn), By Insulation, 2017–2031
Table 36: Middle East & Africa Medium Voltage Switchgear Market Volume (Thousand Units), By Insulation, 2017–2031
Table 37: Middle East & Africa Medium Voltage Switchgear Market Revenue (US$ Mn), By End-user, 2017–2031
Table 38: Middle East & Africa Medium Voltage Switchgear Market Volume (Thousand Units), by End-user, 2017–2031
Table 39: Middle East & Africa Medium Voltage Switchgear Market Revenue (US$ Mn), by Country, 2017–2031
Table 40: Middle East & Africa Medium Voltage Switchgear Market Volume (Thousand Units), by Country, 2017–2031
Table 41: South America Medium Voltage Switchgear Market Revenue (US$ Mn), By Voltage, 2017–2031
Table 42: South America Medium Voltage Switchgear Market Volume (Thousand Units), By Voltage, 2017–2031
Table 43: South America Medium Voltage Switchgear Market Revenue (US$ Mn), By Insulation, 2017–2031
Table 44: South America Medium Voltage Switchgear Market Volume (Thousand Units), By Insulation, 2017–2031
Table 45: South America Medium Voltage Switchgear Market Revenue (US$ Mn), By End-user, 2017–2031
Table 46: South America Medium Voltage Switchgear Market Volume (Thousand Units), by End-user, 2017–2031
Table 47: South America Medium Voltage Switchgear Market Revenue (US$ Mn), by Country, 2017–2031
Table 48: Asia Pacific Medium Voltage Switchgear Market Volume (Thousand Units), by Country, 2017–2031
List of Figures
Figure 1: Global Medium Voltage Switchgear Market Revenue (US$ Mn) Forecast, 2021–2031
Figure 2: Value Chain Analysis
Figure 3: Global Medium Voltage Switchgear Market Size Analysis (2017-2020) and Forecast (2021-2031)
Figure 4: Global Medium Voltage Switchgear Market, by 3kV - 5kV
Figure 5: Global Medium Voltage Switchgear Market, by 6kV - 15kV
Figure 6: Global Medium Voltage Switchgear Market, by 16kV - 27kV
Figure 7: Global Medium Voltage Switchgear Market, by 28kV - 40kV
Figure 8: Global Medium Voltage Switchgear Market Attractiveness Analysis, By Voltage
Figure 9: Global Medium Voltage Switchgear Market, by Air Insulated Switchgear
Figure 10: Global Medium Voltage Switchgear Market, by Gas Insulated Switchgear
Figure 11: Global Medium Voltage Switchgear Market, by Others (Oil and Solids)
Figure 12: Global Medium Voltage Switchgear Market Attractiveness Analysis, By Insulation
Figure 13: Global Medium Voltage Switchgear Market Attractiveness Analysis, By Insulation
Figure 14: Global Medium Voltage Switchgear Market, by Power Plant
Figure 15: Global Medium Voltage Switchgear Market, by Commercial Sector
Figure 16: Global Medium Voltage Switchgear Market, by Oil, Gas and Petrochemical
Figure 17: Global Medium Voltage Switchgear Market, by Utility Sectors
Figure 18: Global Medium Voltage Switchgear Market, by Paper and Pulp Industry
Figure 19: Global Medium Voltage Switchgear Market, by Others
Figure 20: Global Medium Voltage Switchgear Market Attractiveness Analysis, By End-user
Figure 21: Global Medium Voltage Switchgear Market Value Share Analysis, by Region (2021E)
Figure 22: Global Medium Voltage Switchgear Market Value Share Analysis, by Region (2031F)
Figure 23: Global Medium Voltage Switchgear Market Volume Share Analysis, by Region (2021E)
Figure 24: Global Medium Voltage Switchgear Market Volume Share Analysis, by Region (2031F)
Figure 25: Global Medium Voltage Switchgear Market Attractiveness Analysis, by Region
Figure 26: North America Medium Voltage Switchgear Market Revenue (US$ Mn) Forecast, 2017–2031
Figure 27: North America Medium Voltage Switchgear Market Y-o-Y Growth Projection, 2021–2031
Figure 28: North America Medium Voltage Switchgear Market Volume (Thousand Units) Forecast, 2017–2031
Figure 29: North America Medium Voltage Switchgear Market Y-o-Y Growth Projection, 2021–2031
Figure 30: North America Medium Voltage Switchgear Market Value Share Analysis, By Voltage (2021)
Figure 31: North America Medium Voltage Switchgear Market Value Share Analysis, By Voltage (2031)
Figure 32: North America Medium Voltage Switchgear Market Value Share Analysis, By Insulation (2021)
Figure 33: North America Medium Voltage Switchgear Market Value Share Analysis, By Insulation (2031)
Figure 34: North America Medium Voltage Switchgear Market Value Share Analysis, By End-user (2021)
Figure 35: North America Medium Voltage Switchgear Market Value Share Analysis, By End-user (2031)
Figure 36: North America Medium Voltage Switchgear Market Value Share Analysis, by Country (2021)
Figure 37: North America Medium Voltage Switchgear Market Value Share Analysis, by Country (2031)
Figure 38: North America Medium Voltage Switchgear Market Attractiveness Analysis, By Voltage
Figure 39: North America Medium Voltage Switchgear Market Attractiveness Analysis, By Insulation
Figure 40: North America Medium Voltage Switchgear Market Attractiveness Analysis, By End-user
Figure 41: North America Medium Voltage Switchgear Market Attractiveness Analysis, By Country
Figure 43: Europe Medium Voltage Switchgear Market Y-o-Y Growth Projection, 2021–2031
Figure 45: Europe Medium Voltage Switchgear Market Y-o-Y Growth Projection, 2021–2031
Figure 42: Europe Medium Voltage Switchgear Market Revenue (US$ Mn) Forecast, 2017–2031
Figure 44: Europe Medium Voltage Switchgear Market Volume (Thousand Units) Forecast, 2017–2031
Figure 46: Europe Medium Voltage Switchgear Market Value Share Analysis, By Voltage (2021)
Figure 47: Europe Medium Voltage Switchgear Market Value Share Analysis, By Voltage (2031)
Figure 48: Europe Medium Voltage Switchgear Market Value Share Analysis, By Insulation (2021)
Figure 49: Europe Medium Voltage Switchgear Market Value Share Analysis, By Insulation (2031)
Figure 50: Europe Medium Voltage Switchgear Market Value Share Analysis, By End-user (2021)
Figure 51: Europe Medium Voltage Switchgear Market Value Share Analysis, By End-user (2031)
Figure 52: Europe Medium Voltage Switchgear Market Value Share Analysis, by Country (2021)
Figure 53: Europe Medium Voltage Switchgear Market Value Share Analysis, by Country (2031)
Figure 54: Europe Medium Voltage Switchgear Market Attractiveness Analysis, By Voltage
Figure 55: Europe Medium Voltage Switchgear Market Attractiveness Analysis, By Insulation
Figure 56: Europe Medium Voltage Switchgear Market Attractiveness Analysis, By End-user
Figure 57: Europe Medium Voltage Switchgear Market Attractiveness Analysis, By Country
Figure 58: Asia Pacific Medium Voltage Switchgear Market Revenue (US$ Mn) Forecast, 2017–2031
Figure 59: Asia Pacific Medium Voltage Switchgear Market Y-o-Y Growth Projection, 2021–2031
Figure 60: Asia Pacific Medium Voltage Switchgear Market Volume (Thousand Units) Forecast, 2017–2031
Figure 61: Asia Pacific Medium Voltage Switchgear Market Y-o-Y Growth Projection, 2021–2031
Figure 62: Asia Pacific Medium Voltage Switchgear Market Value Share Analysis, By Voltage (2021)
Figure 63: Asia Pacific Medium Voltage Switchgear Market Value Share Analysis, By Voltage (2031)
Figure 64: Asia Pacific Medium Voltage Switchgear Market Value Share Analysis, By Insulation (2021)
Figure 65: Asia Pacific Medium Voltage Switchgear Market Value Share Analysis, By Insulation (2031)
Figure 66: Asia Pacific Medium Voltage Switchgear Market Value Share Analysis, By End-user (2021)
Figure 67: Asia Pacific Medium Voltage Switchgear Market Value Share Analysis, By End-user (2031)
Figure 68: Asia Pacific Medium Voltage Switchgear Market Value Share Analysis, by Country (2021)
Figure 69: Asia Pacific Medium Voltage Switchgear Market Value Share Analysis, by Country (2031)
Figure 70: Asia Pacific Medium Voltage Switchgear Market Attractiveness Analysis, By Voltage
Figure 71: Asia Pacific Medium Voltage Switchgear Market Attractiveness Analysis, By Insulation
Figure 72: Asia Pacific Medium Voltage Switchgear Market Attractiveness Analysis, By End-user
Figure 73: Asia Pacific Medium Voltage Switchgear Market Attractiveness Analysis, By Country
Figure 74: Middle East & Africa Medium Voltage Switchgear Market Revenue (US$ Mn) Forecast, 2017–2031
Figure 75: Middle East & Africa Medium Voltage Switchgear Market Y-o-Y Growth Projection, 2021–2031
Figure 76: Middle East & Africa Medium Voltage Switchgear Market Volume (Thousand Units) Forecast, 2017–2031
Figure 77: Middle East & Africa Medium Voltage Switchgear Market Y-o-Y Growth Projection, 2021–2031
Figure 78: Middle East & Africa Medium Voltage Switchgear Market Value Share Analysis, By Voltage (2021)
Figure 79: Middle East & Africa Medium Voltage Switchgear Market Value Share Analysis, By Voltage (2031)
Figure 80: Middle East & Africa Medium Voltage Switchgear Market Value Share Analysis, By Insulation (2021)
Figure 81: Middle East & Africa Medium Voltage Switchgear Market Value Share Analysis, By Insulation (2031)
Figure 82: Middle East & Africa Medium Voltage Switchgear Market Value Share Analysis, By End-user (2021)
Figure 83: Middle East & Africa Medium Voltage Switchgear Market Value Share Analysis, By End-user (2031)
Figure 84: Middle East & Africa Medium Voltage Switchgear Market Value Share Analysis, by Country (2021)
Figure 85: Middle East & Africa Medium Voltage Switchgear Market Value Share Analysis, by Country (2031)
Figure 86: Middle East & Africa Medium Voltage Switchgear Market Attractiveness Analysis, By Voltage
Figure 87: Middle East & Africa Medium Voltage Switchgear Market Attractiveness Analysis, By Insulation
Figure 88: Middle East & Africa Medium Voltage Switchgear Market Attractiveness Analysis, By End-user
Figure 89: Middle East & Africa Medium Voltage Switchgear Market Attractiveness Analysis, By Country
Figure 90: South America Medium Voltage Switchgear Market Revenue (US$ Mn) Forecast, 2017–2031
Figure 91: South America Medium Voltage Switchgear Market Y-o-Y Growth Projection, 2021–2031
Figure 92: South America Medium Voltage Switchgear Market Volume (Thousand Units) Forecast, 2017–2031
Figure 93: South America Medium Voltage Switchgear Market Y-o-Y Growth Projection, 2021–2031
Figure 94: South America Medium Voltage Switchgear Market Value Share Analysis, By Voltage (2021)
Figure 95: South America Medium Voltage Switchgear Market Value Share Analysis, By Voltage (2031)
Figure 96: South America Medium Voltage Switchgear Market Value Share Analysis, By Insulation (2021)
Figure 97: South America Medium Voltage Switchgear Market Value Share Analysis, By Insulation (2031)
Figure 98: South America Medium Voltage Switchgear Market Value Share Analysis, By End-user (2021)
Figure 99: South America Medium Voltage Switchgear Market Value Share Analysis, By End-user (2031)
Figure 100: South America Medium Voltage Switchgear Market Value Share Analysis, by Country (2021)
Figure 101: South America Medium Voltage Switchgear Market Value Share Analysis, by Country (2031)
Figure 102: South America Medium Voltage Switchgear Market Attractiveness Analysis, By Voltage
Figure 103: South America Medium Voltage Switchgear Market Attractiveness Analysis, By Insulation
Figure 104: South America Medium Voltage Switchgear Market Attractiveness Analysis, By End-user
Figure 105: South America Medium Voltage Switchgear Market Attractiveness Analysis, By Country
Copyright © Transparency Market Research, Inc. All Rights reserved
Trust Online

Medium-voltage Switchgear Market
