Master Recharge API Market - Snapshot
The retail payments industry is witnessing significant technological advancements across the world. Retail industry has seen introduction of upgraded recharge and billing technologies, due to developments across the telecom industry, and proliferation of online banking or online payment technologies, with master recharge API being one of these technologies. With focus on convenient, easy go online recharge, and utility billing payment, the master recharge technology has been introduced to the end-use market. The market for master recharge API is forecast to reach US$ 16,159.3 Mn by 2026 from US$ 10,279.4 Mn in 2017, recording a CAGR of 5.2%.
The master recharge API market has witnessed significantly increased demand due to growing number of smartphone users and increasing adoption of online payments across the world. Master recharge API for prepaid mobile recharge leads the recharge API service segment, followed by DTH recharge service. Master recharge API usage for utility billing application is in an embryonic stage; hence the utility billing service segment was observed to contribute less in 2016. However, the segment is anticipated to experience remarkable growth by 2026.
Though online payments and smartphones are highly popular, enjoying strong acceptance among industries and consumers, master recharge API is anticipated to see slower adoption. A study of recent solution launches and developments of key industry participants active in the market reveals that master recharge API services which includes prepaid mobile and DTH would continue to dominate the market throughout the forecast period. Further, utility services such as electricity, and gas bill payment are expected to witness remarkable growth in the near future, across markets globally. These attributes would show further improvement in recharge API acceptance in end-use markets. Moreover, dip in solution or service charges and introduction of low ticket easy recharge options by telecom/digital service providers is expected to drive rise in volume of transactions. This in turn is expected to favorably impact the recharge API market both for master vendors and channel partners. Factors such as improvement in consumer spending on internet services and telecom prepaid services is observed as crucial parameters influencing the market growth. The master recharge API market however still faces challenges such as security concerns and issues associated with e-payments, which has negatively affected further large scale proliferation of technology. Any further development, exploration of internet applications and growing presence of retailers, distributors, white labels companies, and API integrators are expected to open new set of unmapped opportunities, thereby supporting the growth of the master recharge API market.
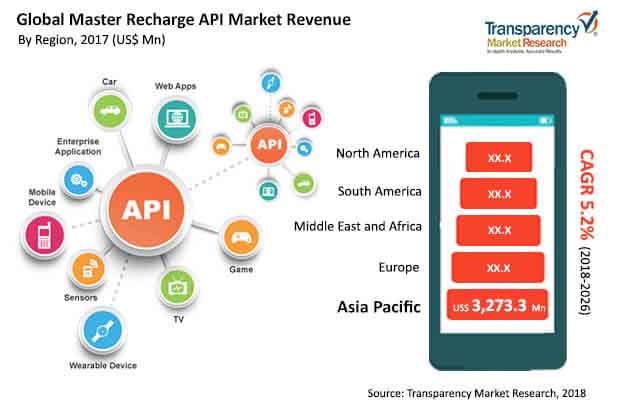
The global master recharge API market is expected to witness steady growth during 2018 – 2026. Substantial number of existing mobile subscribers across the Asia Pacific region is anticipated to generate maximum revenue for the master recharge API market over the forecast period. Europe is anticipated to follow a similar trend during 2018 – 2026. Middle East & Africa is forecasted to witness highest CAGR growth after APAC.
Attracted by this steadily expanding market and underlying embryonic demand, many players are driven to invest in the market for master recharge API solution and services. Right from platform/software developers to integrators and professional service providers across industries are strengthening their position in the master recharge API market. CyberPlat is creating a competitive atmosphere for master recharge API markets. However, with competition from established players such as Jolo, Euronet Worldwide, Inc., and Crowdfinch which already have technology expertise and a strong network in the market, new entrants may find it challenging to establish themselves without a unique value proposition. Some of the prominent players identified in the master recharge API market and profiled in the study include - Axis Softech Private Limited, Recharge Handa (Handa Enterprises), Indian Web Technologies (P) Ltd. (IWT), Pixyrs Softech, Pointersoft Technologies Pvt. Ltd., MyRecharge, Xtracare IT Solution, LBS Software, and Cyrus Technoedge Solutions Pvt. Ltd.
Emergence of Online Payment Solutions Bolsters Growing Master Recharge API Market
Rising urbanization and increasing proliferation of smart communications technologies are two of the vital trends motivating the global master recharge API market. Smart telecommunications devices such as smart phones, tablets, and laptops enable customers to engage and connect to potentially unlimited avenues. People can connect with their friends, professionals, and enjoy information intake, entertainment, and news through internet. Majority of global population uses smart phones and relies on internet services provided by mobile network operators to stay connected with the world. Increasing amount of data consumption propels the demand for faster and convenient data recharge facilities. Increasing amount of created and consumed data and rising usage of over the top platforms for media and entertainment purposes is anticipated to act favorably for booming global master recharge API market.
Emergence and rising adoption of online payment solutions is a pivotal trend for global master recharge API market. Online payment platforms bypass the need for filling out card details or online banking details every time one has to send or receive money. Ease of access makes people more likely to benefit from these services. Increasing proliferation of smart phones and emergence of reliable online payment gateways is triggering growth in global master recharge API market. Other factors triggering growth in global master recharge API market include increasing adoption of multi-SIM card connections for single person use and rising presence of established mobile data service providers in developing economies around the world.
Many countries in Asia pacific are slowly adopting online payment methods such as Apple pay, Amazon pay, Google pay, Paytm, etc. This trend is expected to foster the rapidly growing master recharge API market in Asia Pacific in coming years. Other factors motivating growth of the market in the Asia Pacific region include the adoption of government initiatives in several countries that emphasize on enabling digital payments. Governments have also supported expansion of mobile network service peripheries by internet and mobile network service providers to ensure stable network connectivity in remote parts of the countries.
The Master Recharge API market growth will increase by US$ 16,159.3 million during 2018 to 2026.
The Master Recharge API market is expected to grow at a CAGR of 5.2% during 2018 to 2026.
TMR has segmented the Master Recharge API market is broadly segmented by services into prepaid mobile recharge, postpaid mobile recharge, data card, DTH, electricity, insurance, and others (Gas and other utility services).
Ezetop, Cyberplat, Euronet Worldwid, Jolo, Crowdfinch, Axis Softech Private Limited, Recharge Handa (Handa Enterprises), Indian Web Technologies (P) Ltd. (IWT), Pixyrs Softech, Pointersoft Technologies Pvt. Ltd., MyRecharge, Xtracare IT Solution, LBS Software, and Cyrus Technoedge Solutions Pvt. Ltd. among others are a few of the key vendors in the Master Recharge API market.
Asia Pacific (APAC) held the largest revenue share of the master recharge API market and is anticipated to grow at a CAGR of 6.4% during the forecast period.
1. Preface
1.1. Market Scope
1.2. Market Segmentation
1.3. Key Research Objectives
2. Assumptions and Research Methodology
2.1. Market Taxonomy - Segment Definitions
2.2. Research Methodology
2.2.1. List of Primary and Secondary Sources
2.3. Key Assumptions for Data Modelling
3. Executive Summary : Global Master Recharge API Market
4. Market Overview
4.1. Introduction
4.2. Global Market – Macro Economic Factors Overview
4.2.1. Key Regional Socio-political-technological Developments and Their Impact Considerations
4.3. Porter’s Five Forces Analysis - Global Master Recharge API Market
4.4. PESTEL Analysis - Global Master Recharge API Market
4.5. Technology/Product Roadmap
4.6. Ecosystem Analysis - Global Master Recharge API Market
4.7. Market Dynamics
4.7.1. Drivers
4.7.1.1. Supply Side
4.7.1.2. Demand Side
4.7.2. Restraints
4.7.3. Opportunities
4.7.4. Impact Analysis of Drivers & Restraints
4.8. Regulations and Policies – By Region
4.9. Comparative analysis of products/services offered by major players by:
4.9.1. Geographic Reach
4.9.2. Types of Services
4.9.3. Pricing Model Analysis
4.10. Global Master Recharge API Market Analysis and Forecast, 2016 - 2026
4.10.1. Market Revenue Analysis (US$ Mn)
4.10.1.1. Historic growth trends, 2012-2017
4.10.1.2. Forecast trends, 2017-2026
4.11. Market Outlook
4.12. Competitive Scenario and Trends
4.12.1. Master Recharge API Market Concentration Rate
4.12.1.1. List of New Entrants
4.12.1.2. Mergers & Acquisitions, Expansions
5. Global Master Recharge API Market Analysis and Forecast, By Service
5.1. Overview and Definitions
5.2. Master Recharge API Market Size (US$ Mn) Forecast, By Service, 2016 - 2026
5.2.1. Prepaid Mobile Recharge
5.2.2. Postpaid Mobile Recharge
5.2.3. Data Card
5.2.4. DTH
5.2.5. Electricity
5.2.6. Insurance
5.2.7. Others (Gas, Other Utilities, etc.)
5.3. Market Attractiveness By Service
6. Global Master Recharge API Market Analysis and Forecast, by Region
6.1. Key Findings
6.2. Master Recharge API Market Size (US$ Mn) Forecast, by Region, 2016 - 2026
6.2.1. North America
6.2.2. Europe
6.2.3. Asia Pacific
6.2.4. Middle East and Africa
6.2.5. South America
6.3. Market Attractiveness by Region
7. North America Master Recharge API Market Analysis and Forecast
7.1. Key Findings
7.2. Market Dynamics
7.2.1. Drivers
7.2.1.1. Supply Side
7.2.1.2. Demand Side
7.2.2. Restraints
7.2.3. Opportunities
7.2.4. Impact Analysis of Drivers & Restraints
7.3. Master Recharge API Market Size (US$ Mn) Forecast, By Service, 2016 - 2026
7.3.1. Prepaid Mobile Recharge
7.3.2. Postpaid Mobile Recharge
7.3.3. Data Card
7.3.4. DTH
7.3.5. Electricity
7.3.6. Insurance
7.3.7. Integrated (All-in-One service API)
7.3.8. Others
7.4. Master Recharge API Market Size (US$ Mn) Forecast, By Country, 2016 - 2026
7.4.1. The U.S.
7.4.2. Canada
7.4.3. Rest of North America
7.5. Market Attractiveness Analysis
7.5.1. By Service
7.5.2. By Country
8. Europe Master Recharge API Market Analysis and Forecast
8.1. Key Findings
8.2. Market Dynamics
8.2.1. Drivers
8.2.1.1. Supply Side
8.2.1.2. Demand Side
8.2.2. Restraints
8.2.3. Opportunities
8.2.4. Impact Analysis of Drivers & Restraints
8.3. Master Recharge API Market Size (US$ Mn) Forecast, By Service, 2016 - 2026
8.3.1. Prepaid Mobile Recharge
8.3.2. Postpaid Mobile Recharge
8.3.3. Data Card
8.3.4. DTH
8.3.5. Electricity
8.3.6. Insurance
8.3.7. Integrated (All-in-One service API)
8.3.8. Others
8.4. Master Recharge API Market Size (US$ Mn) Forecast, By Country, 2016 - 2026
8.4.1. Germany
8.4.2. France
8.4.3. UK
8.4.4. Rest of Europe
8.5. Market Attractiveness Analysis
8.5.1. By Service
8.5.2. By Country
9. Asia Pacific Master Recharge API Market Analysis and Forecast
9.1. Key Findings
9.2. Market Dynamics
9.2.1. Drivers
9.2.1.1. Supply Side
9.2.1.2. Demand Side
9.2.2. Restraints
9.2.3. Opportunities
9.2.4. Impact Analysis of Drivers & Restraints
9.3. Master Recharge API Market Size (US$ Mn) Forecast, By Service, 2016 - 2026
9.3.1. Prepaid Mobile Recharge
9.3.2. Postpaid Mobile Recharge
9.3.3. Data Card
9.3.4. DTH
9.3.5. Electricity
9.3.6. Insurance
9.3.7. Integrated (All-in-One service API)
9.3.8. Others
9.4. Master Recharge API Market Size (US$ Mn) Forecast, By Country, 2016 - 2026
9.4.1. China
9.4.2. Japan
9.4.3. India
9.4.4. Australia
9.4.5. Rest of Asia Pacific
9.5. Market Attractiveness Analysis
9.5.1. By Service
9.5.2. By Country
10. Middle East and Africa (MEA) Master Recharge API Market Analysis and Forecast
10.1. Key Findings
10.2. Market Dynamics
10.2.1. Drivers
10.2.1.1. Supply Side
10.2.1.2. Demand Side
10.2.2. Restraints
10.2.3. Opportunities
10.2.4. Impact Analysis of Drivers & Restraints
10.3. Master Recharge API Market Size (US$ Mn) Forecast, By Service, 2016 - 2026
10.3.1. Prepaid Mobile Recharge
10.3.2. Postpaid Mobile Recharge
10.3.3. Data Card
10.3.4. DTH
10.3.5. Electricity
10.3.6. Insurance
10.3.7. Integrated (All-in-One service API)
10.3.8. Others
10.4. Master Recharge API Market Size (US$ Mn) Forecast, By Country, 2016 - 2026
10.4.1. GCC
10.4.2. South Africa
10.4.3. Rest of MEA
10.5. Market Attractiveness Analysis
10.5.1. By Service
10.5.2. By Country
11. South America Master Recharge API Market Analysis and Forecast
11.1. Key Findings
11.2. Market Dynamics
11.2.1. Drivers
11.2.1.1. Supply Side
11.2.1.2. Demand Side
11.2.2. Restraints
11.2.3. Opportunities
11.2.4. Impact Analysis of Drivers & Restraints
11.3. Master Recharge API Market Size (US$ Mn) Forecast, By Service, 2016 - 2026
11.3.1. Prepaid Mobile Recharge
11.3.2. Postpaid Mobile Recharge
11.3.3. Data Card
11.3.4. DTH
11.3.5. Electricity
11.3.6. Insurance
11.3.7. Integrated (All-in-One service API)
11.3.8. Others
11.4. Master Recharge API Market Size (US$ Mn) Forecast, By Country, 2016 - 2026
11.4.1. Brazil
11.4.2. Rest of South America
11.5. Market Attractiveness Analysis
11.5.1. By Service
11.5.2. By Country
12. Competition Landscape
12.1. Market Player – Competition Matrix
12.2. Market Revenue Share Analysis (%), By Company (2017)
12.3. Regional Presence (Intensity Map)
13. Company Profiles (Details – Basic Overview, Sales Area/Geographical Presence, Key Competitors, Revenue, Strategy)
13.1. Axis Softech Private Limited
13.1.1. Basic Overview
13.1.2. Sales Area/Geographical Presence
13.1.3. Key Competitors
13.1.4. Revenue
13.1.5. Strategy
13.2. CyberPlat
13.2.1. Basic Overview
13.2.2. Sales Area/Geographical Presence
13.2.3. Key Competitors
13.2.4. Revenue
13.2.5. Strategy
13.3. Cyrus Technoedge Solutions Pvt. Ltd.
13.3.1. Basic Overview
13.3.2. Sales Area/Geographical Presence
13.3.3. Key Competitors
13.3.4. Revenue
13.3.5. Strategy
13.4. Euronet
13.4.1. Basic Overview
13.4.2. Sales Area/Geographical Presence
13.4.3. Key Competitors
13.4.4. Revenue
13.4.5. Strategy
13.5. Ezetop
13.5.1. Basic Overview
13.5.2. Sales Area/Geographical Presence
13.5.3. Key Competitors
13.5.4. Revenue
13.5.5. Strategy
13.6. Handa Enterprises (Recharge Handa)
13.6.1. Basic Overview
13.6.2. Sales Area/Geographical Presence
13.6.3. Key Competitors
13.6.4. Revenue
13.6.5. Strategy
13.7. Indian Web Technologies (P) Ltd. (Mymonkey)
13.7.1. Basic Overview
13.7.2. Sales Area/Geographical Presence
13.7.3. Key Competitors
13.7.4. Revenue
13.7.5. Strategy
13.8. LBS Software
13.8.1. Basic Overview
13.8.2. Sales Area/Geographical Presence
13.8.3. Key Competitors
13.8.4. Revenue
13.8.5. Strategy
13.9. Pixyrs
13.9.1. Basic Overview
13.9.2. Sales Area/Geographical Presence
13.9.3. Key Competitors
13.9.4. Revenue
13.9.5. Strategy
13.10. Pointer Soft Technologies Pvt. Ltd.
13.10.1. Basic Overview
13.10.2. Sales Area/Geographical Presence
13.10.3. Key Competitors
13.10.4. Revenue
13.10.5. Strategy
13.11. Recharge My
13.11.1. Basic Overview
13.11.2. Sales Area/Geographical Presence
13.11.3. Key Competitors
13.11.4. Revenue
13.11.5. Strategy
13.12. Xtracare IT Solution
13.12.1. Basic Overview
13.12.2. Sales Area/Geographical Presence
13.12.3. Key Competitors
13.12.4. Revenue
13.12.5. Strategy
14. Key Takeaways
List of Tables
Table 1: Acronyms Used
Table 2: Research Scope
Table 3: Geographical Presence Analysis
Table 4: New Entrants: Master Recharge API Market
Table 5: Industry Developments: Mergers & Acquisitions, Expansions
Table 6: Global Master Recharge API Market Revenue Analysis, By Service
Table 7: Global Master Recharge API Market Revenue (US$ Mn) Forecast and CAGR, By Service, 2016 – 2026
Table 8: Global Master Recharge API Market Revenue Analysis, By Region
Table 9: Global Master Recharge API Market Revenue (US$ Mn) Forecast and CAGR, By Region, 2016 – 2026
Table 10: NA Master Recharge API Market Key Findings Analysis
Table 11: NA Master Recharge API Market Revenue (US$ Mn) Forecast and CAGR, By Service, 2016 – 2026
Table 12: NA Master Recharge API Market Revenue (US$ Mn) Forecast and CAGR, By Country, 2016 – 2026
Table 13: Europe Master Recharge API Market Key Findings Analysis
Table 14: Europe Master Recharge API Market Revenue (US$ Mn) Forecast and CAGR, By Service, 2016 – 2026
Table 15: Europe Master Recharge API Market Revenue (US$ Mn) Forecast and CAGR, By Country, 2016 – 2026
Table 16: Asia Pacific Master Recharge API Market Key Findings Analysis
Table 17: Asia Pacific Master Recharge API Market Revenue (US$ Mn) Forecast and CAGR, By Service, 2016 – 2026
Table 18: Asia Pacific Master Recharge API Market Revenue (US$ Mn) Forecast and CAGR, By Country, 2016 – 2026
Table 19: Middle East & Africa Master Recharge API Market Key Findings Analysis
Table 20: Middle East & Africa Master Recharge API Market Revenue (US$ Mn) Forecast and CAGR, By Service, 2016 - 2026
Table 21: Middle East & Africa Master Recharge API Market Revenue (US$ Mn) Forecast and CAGR, By Country, 2016 - 2026
Table 22: South America Master Recharge API Market Key Findings Analysis
Table 23: South America (SA) Master Recharge API Market Revenue (US$ Mn) Forecast and CAGR, By Service, 2016 – 2026
Table 24: South America (SA) Master Recharge API Market Revenue (US$ Mn) Forecast and CAGR, By Country, 2016 – 2026
Table 25: Competition Matrix, Master Recharge API Market
Table 26: Axis Softech Private Limited Business Segments
Table 27: Recharge Handa (Handa Enterprises) Business Segments
Table 28: Ezetop Business Segments
Table 29: Indian Web Technologies (P) Ltd. (IWT) Business Segments
Table 30: Pixyrs Softech Business Segments
Table 31: Pointersoft Technologies Pvt. Ltd. Business Segments
Table 32: MyRecharge Business Segments
Table 33: Xtracare IT Solution Business Segments
Table 34: LBS Software Business Segments
Table 35: CyberPlat Business Segments
Table 36: Euronet Worldwide, Inc. Business Segments
Table 37: Cyrus Technoedge Solutions Pvt. Ltd. Business Segments
List of Figures
Figure 1: Research Flow
Figure 2: Research Methodology
Figure 3: Research Methodology: Analysis(1/4)
Figure 4: Research Methodology: Growth Estimates (2/4)
Figure 5: Research Methodology: Market Size & Forecast (3/4)
Figure 6: Research Methodology: Data Validation (4/4)
Figure 7: Master Recharge API Market Overview
Figure 8: Global Master Recharge API Market CAGR by Service, (2018 – 2026)
Figure 9: Global Master Recharge API Market CAGR of Major Countries (2018 - 2026)
Figure 10: Global Master Recharge API Market Revenue (US$ Mn), of Major Countries (2017)
Figure 11: Gross Domestic Product (GDP) per Capita; Analysis (1/2) (US$ Tn), By Major Countrie
Figure 12: Gross Domestic Product (GDP) Analysis (2/2) (US$ Tn), By Major Countries, 2012-2016
Figure 13: Porter’s Five Forces Analysis
Figure 14: PESTLE Analysis(1/3)
Figure 15: PESTLE Analysis(2/3)
Figure 16: PESTLE Analysis(3/3)
Figure 17: Technology/Product Roadmap
Figure 18: Ecosystem Analysis
Figure 19: Drivers, Restraints and Opportunity Snapshot
Figure 20: Market Drivers Analysis
Figure 21: Market Restraint Analysis
Figure 22: Market Opportunity Analysis
Figure 23: Impact Analysis of Drivers & Restraints
Figure 24: Competition Dashboard: By Master Recharge API Services (1/2)
Figure 25: Competition Dashboard: By Master Recharge API Services (2/2)
Figure 26: Pricing Model Analysis (1/2)
Figure 27: Pricing Model Analysis (2/2)
Figure 28: Historic Growth Trends For Global Master Recharge API Market, 2012-2017 (US$ Mn)
Figure 29: Overall Growth Trends and Y – o – Y Growth, For Global Master Recharge API Market
Figure 30: Forecast Trends For Global Master Recharge API Market, 2018-2026 (US$ Mn)
Figure 31: Global Master Recharge API Market Value Share Analysis and Forecast, By Service, (2017)
Figure 32: Global Master Recharge API Market Attractiveness Analysis, By Service (2017)
Figure 33: Key Findings Master Recharge API Market, By Region(2017)
Figure 34: Global Master Recharge API Market Value Share Analysis, By Region, 2018 and 2026
Figure 35: Global Master Recharge API Market Attractiveness Analysis, By Region (2017)
Figure 36: NA Market Dynamics Impact Analysis
Figure 37: NA Master Recharge API Market Attractiveness Analysis, By Service (2017)
Figure 38: NA Master Recharge API Market Attractiveness Analysis, By Country (2017)
Figure 39: EU Market Dynamics Impact Analysis
Figure 40: Europe Master Recharge API Market Attractiveness Analysis, By Service (2017)
Figure 41: Europe Master Recharge API Market Attractiveness Analysis, By Country (2017)
Figure 42: APAC Market Dynamics Impact Analysis
Figure 43: Asia Pacific Master Recharge API Market Attractiveness Analysis, By Service (2017)
Figure 44: Asia Pacific Master Recharge API Market Attractiveness Analysis, By Country (2017)
Figure 45: MEA Market Dynamics Impact Analysis
Figure 46: Middle East & Africa Master Recharge API Market Attractiveness Analysis, By Service (2017)
Figure 47: Middle East & Africa Master Recharge API Market Attractiveness Analysis, By Country (2017)
Figure 48: SA Market Dynamics Impact Analysis
Figure 49: South America (SA) Master Recharge API Market Attractiveness Analysis, By Service (2017)
Figure 50: South America (SA) Master Recharge API Market Attractiveness Analysis, By Country (2017)
Figure 51: Market Share Analysis – 2017
Figure 52: Axis Softech Private Limited Geographical Presence
Figure 53: Recharge Handa (Handa Enterprises) Geographical Presence
Figure 54: Ezetop Geographical Presence
Figure 55: Indian Web Technologies (P) Ltd. (IWT) Geographical Presence
Figure 56: Pixyrs Softech Geographical Presence
Figure 57: Pointersoft Technologies Pvt. Ltd. Geographical Presence
Figure 58: MyRecharge Geographical Presence
Figure 59: Xtracare IT Solution Geographical Presence
Figure 60: LBS Software Geographical Presence
Figure 61: CyberPlat Geographical Presence
Figure 62: Euronet Worldwide, Inc. Geographical Presence
Figure 63: Cyrus Technoedge Solutions Pvt. Ltd. Geographical Presence
Copyright © Transparency Market Research, Inc. All Rights reserved
Trust Online

Master Recharge API Market Insights, 2018 - 2026
