Marine alternators are used in modern marine transportation (cargo ships and vessels) and marine tourism (boats, ferries, cruise etc.) to change the mechanical energy into electrical energy. Marine alternators are used to charge the batteries and to power the electrical system when the engine is running. Marine motors are used to change the electrical energy to mechanical energy for over the deck and under the deck application. Alternators use a rotating magnetic field with a stationary armature to reduce the cost, making it simple for operations.
Changing lifestyle of people has created demand for marine tourism and more applications of marine motors and alternators. South Asian countries are gaining popularity in terms of water sports and they are comparatively less costly than water sports in the U.S. and Europe. Trade between countries has increased, creating demand for vessel and cargo ships. High growth in trade will boost the marine alternator and motor market. Many countries are developing the infrastructure for marine vehicles to increase marine trade and leisure activities. Countries such as India have developed inland water transportation which will help in the growth of marine trade activities in the country.
The global marine alternator and motor market has been segmented on the basis of product, capacity, distribution channel, and geography. Based on product, the market has been segmented into in-marine alternator and marine motor. As compared to alternator, the motor segment is expected to hold major share in the overall marine alternator and motor market. In alternators, diesel generators account for the major share and it will continue to hold a dominant position, whereas in the motor segment, pumps dominate the market due to extensive application over the deck and under the deck. On the basis of capacity, the market has been classified into alternator capacity and motor capacity. In alternator capacity, up to 410 kVA dominated the market due to wide acceptance of small capacity alternator and its wide application in small boats, yachts, and ferries. In motor capacity, below 11 KW dominated the market; however, 11-110 KW will expand at the highest growth among all capacities of motor. Based on distribution channel, distributors dominated the market compared to direct sales. Distributors have a wide presence as compared to manufacturers and it is easy for end-users to approach distributors.
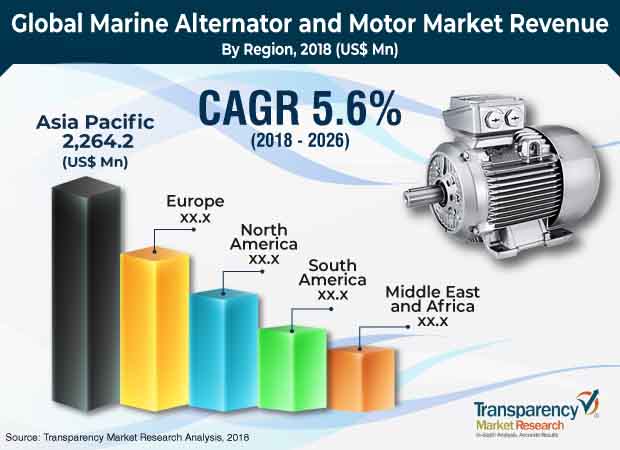
Asia Pacific is likely to be the most attractive region during the forecast period due to the increasing marine tourism and water sports. Manufacturers are keen on entering the Asia Pacific region in order to grab significant market share during the forecast period. Also, Asia Pacific dominated the overall marine alternator and motor market due to the export from Asian countries to the Middle East and North America region. As compared to other regions, Middle East & Africa and South America are expected to have a slower growth rate in the market during the forecast period.
The marine alternator and motor market is fragmented due to the presence of several players. Competition is expected to intensify in the coming years, due to the entry of several local players. Key companies profiled in the research report include ABB Ltd. Danfoss A/S, FelmS.r.l, Hoyer Motors, Lynch Motor, Nidec Corporation, Siemens AG, VEM Group, WEG Industries, American Power Systems, BBB Industries, Caterpillar Inc., Cummins Inc., Mecc Alte, Mitsubishi Corporation, Nidec Corporation, Prestolite Electric Llc, Soga SPA and others.
1. Preface
1.1. Market Scope
1.2. Market Segmentation
1.3. Key Research Objectives
2. Assumptions and Research Methodology
2.1. Market Taxonomy - Segment Definitions
2.2. Research Methodology
2.2.1. List of Primary and Secondary Sources
2.3. Key Assumptions for Data Modeling
3. Executive Summary : Global Marine Alternators and Motors Market
4. Market Overview
4.1. Introduction
4.1.1. Marine Alternators and Motors Market Definition
4.2. Global Market – Macro Economic Factors Overview
4.2.1. Key Regional Socio-Political-Technological Developments and Their Impact Considerations
4.3. Ecosystem Analysis
4.4. Market Dynamics
4.4.1. Drivers
4.4.2. Restraints
4.4.3. Opportunities
4.4.4. Impact Analysis of Drivers & Restraints
4.5. Key Trends Analysis
4.6. Global Marine Alternators and Motors Market Installed Base Analysis
4.6.1. Marine Alternators and Motors Installed Base (‘000 Units)
4.6.1.1. Installed Base, 2017
4.6.1.2. New Shipment Forecast Trends, 2018-2026
4.7. Market Outlook
5. Global Marine Alternators and Motors Market Analysis and Forecast, by Product
5.1. Overview & Definitions
5.2. Marine Alternators and Motors Market Size (US$ Mn and ‘000 Units) Forecast by Product, 2016 – 2026
5.2.1. Alternator
5.2.1.1. Shaft Generator
5.2.1.2. Diesel Generator
5.2.1.3. Emergency Generator
5.2.2. Motor
5.2.2.1. Pumps
5.2.2.2. Deck Cranes
5.2.2.3. Thrusters
5.2.2.4. Winched
5.2.2.5. Compressors
5.2.2.6. Others
5.3. Market Attractiveness by Product
6. Global Marine Alternators and Motors Market Analysis and Forecast, by Capacity
6.1. Overview & Definitions
6.2. Marine Alternators and Motors Market Size (US$ Mn and ‘000 Units) Forecast by Capacity, 2016 – 2026
6.2.1. Alternator
6.2.1.1. Up to 410 kVA
6.2.1.2. 411 to 1000 kVA
6.2.1.3. 1001 to 3900 kVA
6.2.1.4. More than 3900 kVA
6.2.2. Motor
6.2.2.1. Below 11 KW
6.2.2.2. 11 KW to 110 KW
6.2.2.3. 110 KW to 600 KW
6.2.2.4. 600 KW to 1500 KW
6.2.2.5. Above 1500 KW
6.3. Market Attractiveness by Capacity
7. Global Marine Alternators and Motors Market Analysis and Forecast, by Distribution Channel
7.1. Marine Alternators and Motors Market Size (US$ Mn and ‘000 Units) Forecast by Distribution Channel, 2016 – 2026
7.1.1. Direct Sales
7.1.2. Distributors
7.2. Market Attractiveness by Distribution Channel
8. Global Marine Alternators and Motors Market Analysis and Forecast, by Region
8.1. Key Findings
8.2. Marine Alternators and Motors Market Size (US$ Mn&‘000 Units) Forecast by Region, 2016 – 2026
8.2.1. North America
8.2.2. Europe
8.2.3. Asia Pacific
8.2.4. Middle East & Africa
8.2.5. South America
8.3. Market Attractiveness by Region
9. North America Marine Alternators and Motors Market Analysis and Forecast
9.1. Key Findings
9.2. Market Dynamics
9.2.1. Drivers
9.2.2. Restraints
9.2.3. Opportunities
9.2.4. Impact Analysis of Drivers & Restraints
9.3. Marine Alternators and Motors Market Size (US$ Mn and ‘000 Units) Forecast by Product, 2016 – 2026
9.3.1. Alternator
9.3.1.1. Shaft Generator
9.3.1.2. Diesel Generator
9.3.1.3. Emergency Generator
9.3.2. Motor
9.3.2.1. Pumps
9.3.2.2. Deck Cranes
9.3.2.3. Thrusters
9.3.2.4. Winched
9.3.2.5. Compressors
9.3.2.6. Others
9.4. Marine Alternators and Motors Market Size (US$ Mn and ‘000 Units) Forecast by Capacity, 2016 – 2026
9.4.1. Alternator
9.4.1.1. Up to 410 kVA
9.4.1.2. 411 to 1000 kVA
9.4.1.3. 1001 to 3900 kVA
9.4.1.4. More than 3900 kVA
9.4.2. Motor
9.4.2.1. Below 11 KW
9.4.2.2. 11 KW to 110 KW
9.4.2.3. 110 KW to 600 KW
9.4.2.4. 600 KW to 1500 KW
9.4.2.5. Above 1500 KW
9.5. Marine Alternators and Motors Market Size (US$ Mn and ‘000 Units) Forecast by Distribution Channel, 2016 – 2026
9.5.1. Direct Sales
9.5.2. Distributors
9.6. Marine Alternators and Motors Market Size (US$ Mn and ‘000 Units) Forecast by Country& Sub-region 2016 – 2026
9.6.1. The U.S.
9.6.2. Canada
9.6.3. Rest of North America
9.7. Market Attractiveness Analysis
9.7.1. By Product
9.7.2. By Capacity
9.7.3. By Country
10. Europe Marine Alternators and Motors Market Analysis and Forecast
10.1. Key Findings
10.2. Market Dynamics
10.2.1. Drivers
10.2.2. Restraints
10.2.3. Opportunities
10.2.4. Impact Analysis of Drivers & Restraints
10.3. Marine Alternators and Motors Market Size (US$ Mn and ‘000 Units) Forecast by Product, 2016 – 2026
10.3.1. Alternator
10.3.1.1. Shaft Generator
10.3.1.2. Diesel Generator
10.3.1.3. Emergency Generator
10.3.2. Motor
10.3.2.1. Pumps
10.3.2.2. Deck Cranes
10.3.2.3. Thrusters
10.3.2.4. Winched
10.3.2.5. Compressors
10.3.2.6. Others
10.4. Marine Alternators and Motors Market Size (US$ Mn and ‘000 Units) Forecast by Capacity, 2016 – 2026
10.4.1. Alternator
10.4.1.1. Up to 410 kVA
10.4.1.2. 411 to 1000 kVA
10.4.1.3. 1001 to 3900 kVA
10.4.1.4. More than 3900 kVA
10.4.2. Motor
10.4.2.1. Below 11 KW
10.4.2.2. 11 KW to 110 KW
10.4.2.3. 110 KW to 600 KW
10.4.2.4. 600 KW to 1500 KW
10.4.2.5. Above 1500 KW
10.5. Marine Alternators and Motors Market Size (US$ Mn and ‘000 Units) Forecast by Distribution Channel, 2016 – 2026
10.5.1. Direct Sales
10.5.2. Distributors
10.6. Marine Alternators and Motors Market Size (US$ Mn and ‘000 Units) Forecast by Country & Sub-region, 2016 – 2026
10.6.1. Germany
10.6.2. France
10.6.3. The U.K.
10.6.4. Italy
10.6.5. Spain
10.6.6. Portugal
10.6.7. Scandinavia
10.6.8. Balkans
10.6.9. Rest of Europe
10.7. Market Attractiveness Analysis
10.7.1. By Product
10.7.2. By Capacity
10.7.3. By Country
11. Germany Marine Alternators and Motors Market Analysis and Forecast
11.1. Key Findings
11.2. Marine Alternators and Motors Market Size (US$ Mn and ‘000 Units) Forecast by Product, 2016 – 2026
11.2.1. Alternator
11.2.1.1. Shaft Generator
11.2.1.2. Diesel Generator
11.2.1.3. Emergency Generator
11.2.2. Motor
11.2.2.1. Pumps
11.2.2.2. Deck Cranes
11.2.2.3. Thrusters
11.2.2.4. Winched
11.2.2.5. Compressors
11.2.2.6. Others
11.3. Marine Alternators and Motors Market Size (US$ Mn and ‘000 Units) Forecast by Capacity, 2016 – 2026
11.3.1. Alternator
11.3.1.1. Up to 410 kVA
11.3.1.2. 411 to 1000 kVA
11.3.1.3. 1001 to 3900 kVA
11.3.1.4. More than 3900 kVA
11.3.2. Motor
11.3.2.1. Below 11 KW
11.3.2.2. 11 KW to 110 KW
11.3.2.3. 110 KW to 600 KW
11.3.2.4. 600 KW to 1500 KW
11.3.2.5. Above 1500 KW
11.4. Marine Alternators and Motors Market Size (US$ Mn and ‘000 Units) Forecast by Distribution Channel, 2016 – 2026
11.4.1. Direct Sales
11.4.2. Distributors
12. The U.K. Marine Alternators and Motors Market Analysis and Forecast
12.1. Key Findings
12.2. Marine Alternators and Motors Market Size (US$ Mn and ‘000 Units) Forecast by Product, 2016 – 2026
12.2.1. Alternator
12.2.1.1. Shaft Generator
12.2.1.2. Diesel Generator
12.2.1.3. Emergency Generator
12.2.2. Motor
12.2.2.1. Pumps
12.2.2.2. Deck Cranes
12.2.2.3. Thrusters
12.2.2.4. Winched
12.2.2.5. Compressors
12.2.2.6. Others
12.3. Marine Alternators and Motors Market Size (US$ Mn and ‘000 Units) Forecast by Capacity, 2016 – 2026
12.3.1. Alternator
12.3.1.1. Up to 410 kVA
12.3.1.2. 411 to 1000 kVA
12.3.1.3. 1001 to 3900 kVA
12.3.1.4. More than 3900 kVA
12.3.2. Motor
12.3.2.1. Below 11 KW
12.3.2.2. 11 KW to 110 KW
12.3.2.3. 110 KW to 600 KW
12.3.2.4. 600 KW to 1500 KW
12.3.2.5. Above 1500 KW
12.4. Marine Alternators and Motors Market Size (US$ Mn and ‘000 Units) Forecast by Distribution Channel,2016 – 2026
12.4.1. Direct Sales
12.4.2. Distributors
13. Italy Marine Alternators and Motors Market Analysis and Forecast
13.1. Key Findings
13.2. Marine Alternators and Motors Market Size (US$ Mn and ‘000 Units) Forecast by Product, 2016 – 2026
13.2.1. Alternator
13.2.1.1. Shaft Generator
13.2.1.2. Diesel Generator
13.2.1.3. Emergency Generator
13.2.2. Motor
13.2.2.1. Pumps
13.2.2.2. Deck Cranes
13.2.2.3. Thrusters
13.2.2.4. Winched
13.2.2.5. Compressors
13.2.2.6. Others
13.3. Marine Alternators and Motors Market Size (US$ Mn and ‘000 Units) Forecast by Capacity, 2016 – 2026
13.3.1. Alternator
13.3.1.1. Up to 410 kVA
13.3.1.2. 411 to 1000 kVA
13.3.1.3. 1001 to 3900 kVA
13.3.1.4. More than 3900 kVA
13.3.2. Motor
13.3.2.1. Below 11 KW
13.3.2.2. 11 KW to 110 KW
13.3.2.3. 110 KW to 600 KW
13.3.2.4. 600 KW to 1500 KW
13.3.2.5. Above 1500 KW
13.4. Marine Alternators and Motors Market Size (US$ Mn and ‘000 Units) Forecast by Distribution Channel, 2016 – 2026
13.4.1. Direct Sales
13.4.2. Distributors
14. Spain Marine Alternators and Motors Market Analysis and Forecast
14.1. Key Findings
14.2. Marine Alternators and Motors Market Size (US$ Mn and ‘000 Units) Forecast by Product, 2016 – 2026
14.2.1. Alternator
14.2.1.1. Shaft Generator
14.2.1.2. Diesel Generator
14.2.1.3. Emergency Generator
14.2.2. Motor
14.2.2.1. Pumps
14.2.2.2. Deck Cranes
14.2.2.3. Thrusters
14.2.2.4. Winched
14.2.2.5. Compressors
14.2.2.6. Others
14.3. Marine Alternators and Motors Market Size (US$ Mn and ‘000 Units) Forecast by Capacity, 2016 – 2026
14.3.1. Alternator
14.3.1.1. Up to 410 kVA
14.3.1.2. 411 to 1000 kVA
14.3.1.3. 1001 to 3900 kVA
14.3.1.4. More than 3900 kVA
14.3.2. Motor
14.3.2.1. Below 11 KW
14.3.2.2. 11 KW to 110 KW
14.3.2.3. 110 KW to 600 KW
14.3.2.4. 600 KW to 1500 KW
14.3.2.5. Above 1500 KW
14.4. Marine Alternators and Motors Market Size (US$ Mn and ‘000 Units) Forecast by Distribution Channel, 2016 – 2026
14.4.1. Direct Sales
14.4.2. Distributors
15. Portugal Marine Alternators and Motors Market Analysis and Forecast
15.1. Key Findings
15.2. Marine Alternators and Motors Market Size (US$ Mn and ‘000 Units) Forecast by Product, 2016 – 2026
15.2.1. Alternator
15.2.1.1. Shaft Generator
15.2.1.2. Diesel Generator
15.2.1.3. Emergency Generator
15.2.2. Motor
15.2.2.1. Pumps
15.2.2.2. Deck Cranes
15.2.2.3. Thrusters
15.2.2.4. Winched
15.2.2.5. Compressors
15.2.2.6. Others
15.3. Marine Alternators and Motors Market Size (US$ Mn and ‘000 Units) Forecast by Capacity, 2016 – 2026
15.3.1. Alternator
15.3.1.1. Up to 410 kVA
15.3.1.2. 411 to 1000 kVA
15.3.1.3. 1001 to 3900 kVA
15.3.1.4. More than 3900 kVA
15.3.2. Motor
15.3.2.1. Below 11 KW
15.3.2.2. 11 KW to 110 KW
15.3.2.3. 110 KW to 600 KW
15.3.2.4. 600 KW to 1500 KW
15.3.2.5. Above 1500 KW
15.4. Marine Alternators and Motors Market Size (US$ Mn and ‘000 Units) Forecast by Distribution Channel, 2016 – 2026
15.4.1. Direct Sales
15.4.2. Distributors
16. Scandinavia Marine Alternators and Motors Market Analysis and Forecast
16.1. Key Findings
16.2. Marine Alternators and Motors Market Size (US$ Mn and ‘000 Units) Forecast by Product, 2016 – 2026
16.2.1. Alternator
16.2.1.1. Shaft Generator
16.2.1.2. Diesel Generator
16.2.1.3. Emergency Generator
16.2.2. Motor
16.2.2.1. Pumps
16.2.2.2. Deck Cranes
16.2.2.3. Thrusters
16.2.2.4. Winched
16.2.2.5. Compressors
16.2.2.6. Others
16.3. Marine Alternators and Motors Market Size (US$ Mn and ‘000 Units) Forecast by Capacity, 2016 – 2026
16.3.1. Alternator
16.3.1.1. Up to 410 kVA
16.3.1.2. 411 to 1000 kVA
16.3.1.3. 1001 to 3900 kVA
16.3.1.4. More than 3900 kVA
16.3.2. Motor
16.3.2.1. Below 11 KW
16.3.2.2. 11 KW to 110 KW
16.3.2.3. 110 KW to 600 KW
16.3.2.4. 600 KW to 1500 KW
16.3.2.5. Above 1500 KW
16.4. Marine Alternators and Motors Market Size (US$ Mn and ‘000 Units) Forecast by Distribution Channel,2016 – 2026
16.4.1. Direct Sales
16.4.2. Distributors
17. Balkans Marine Alternators and Motors Market Analysis and Forecast
17.1. Key Findings
17.2. Marine Alternators and Motors Market Size (US$ Mn and ‘000 Units) Forecast by Product, 2016 – 2026
17.2.1. Alternator
17.2.1.1. Shaft Generator
17.2.1.2. Diesel Generator
17.2.1.3. Emergency Generator
17.2.2. Motor
17.2.2.1. Pumps
17.2.2.2. Deck Cranes
17.2.2.3. Thrusters
17.2.2.4. Winched
17.2.2.5. Compressors
17.2.2.6. Others
17.3. Marine Alternators and Motors Market Size (US$ Mn and ‘000 Units) Forecast by Capacity, 2016 – 2026
17.3.1. Alternator
17.3.1.1. Up to 410 kVA
17.3.1.2. 411 to 1000 kVA
17.3.1.3. 1001 to 3900 kVA
17.3.1.4. More than 3900 kVA
17.3.2. Motor
17.3.2.1. Below 11 KW
17.3.2.2. 11 KW to 110 KW
17.3.2.3. 110 KW to 600 KW
17.3.2.4. 600 KW to 1500 KW
17.3.2.5. Above 1500 KW
17.4. Marine Alternators and Motors Market Size (US$ Mn and ‘000 Units) Forecast by Distribution Channel, 2016 – 2026
17.4.1. Direct Sales
17.4.2. Distributors
18. Asia Pacific Marine Alternators and Motors Market Analysis and Forecast
18.1. Key Findings
18.2. Market Dynamics
18.2.1. Drivers
18.2.2. Restraints
18.2.3. Opportunities
18.2.4. Impact Analysis of Drivers & Restraints
18.3. Marine Alternators and Motors Market Size (US$ Mn and ‘000 Units) Forecast by Product, 2016 – 2026
18.3.1. Alternator
18.3.1.1. Shaft Generator
18.3.1.2. Diesel Generator
18.3.1.3. Emergency Generator
18.3.2. Motor
18.3.2.1. Pumps
18.3.2.2. Deck Cranes
18.3.2.3. Thrusters
18.3.2.4. Winched
18.3.2.5. Compressors
18.3.2.6. Others
18.4. Marine Alternators and Motors Market Size (US$ Mn and ‘000 Units) Forecast by Capacity, 2016 – 2026
18.4.1. Alternator
18.4.1.1. Up to 410 kVA
18.4.1.2. 411 to 1000 kVA
18.4.1.3. 1001 to 3900 kVA
18.4.1.4. More than 3900 kVA
18.4.2. Motor
18.4.2.1. Below 11 KW
18.4.2.2. 11 KW to 110 KW
18.4.2.3. 110 KW to 600 KW
18.4.2.4. 600 KW to 1500 KW
18.4.2.5. Above 1500 KW
18.5. Marine Alternators and Motors Market Size (US$ Mn and ‘000 Units) Forecast by Distribution Channel,2016 – 2026
18.5.1. Direct Sales
18.5.2. Distributors
18.6. Marine Alternators and Motors Market Size (US$ Mn and ‘000 Units) Forecast by Country& Sub-region,2016 – 2026
18.6.1. China
18.6.2. Japan
18.6.3. Australia
18.6.4. Korea
18.6.5. Vietnam
18.6.6. Rest of Asia Pacific
18.7. Market Attractiveness Analysis
18.7.1. By Product
18.7.2. By Capacity
18.7.3. By Country
19. China Marine Alternators and Motors Market Analysis and Forecast
19.1. Key Findings
19.2. Marine Alternators and Motors Market Size (US$ Mn and ‘000 Units) Forecast by Product, 2016 – 2026
19.2.1. Alternator
19.2.1.1. Shaft Generator
19.2.1.2. Diesel Generator
19.2.1.3. Emergency Generator
19.2.2. Motor
19.2.2.1. Pumps
19.2.2.2. Deck Cranes
19.2.2.3. Thrusters
19.2.2.4. Winched
19.2.2.5. Compressors
19.2.2.6. Others
19.3. Marine Alternators and Motors Market Size (US$ Mn and ‘000 Units) Forecast by Capacity, 2016 – 2026
19.3.1. Alternator
19.3.1.1. Up to 410 kVA
19.3.1.2. 411 to 1000 kVA
19.3.1.3. 1001 to 3900 kVA
19.3.1.4. More than 3900 kVA
19.3.2. Motor
19.3.2.1. Below 11 KW
19.3.2.2. 11 KW to 110 KW
19.3.2.3. 110 KW to 600 KW
19.3.2.4. 600 KW to 1500 KW
19.3.2.5. Above 1500 KW
19.4. Marine Alternators and Motors Market Size (US$ Mn and ‘000 Units) Forecast by Distribution Channel, 2016 – 2026
19.4.1. Direct Sales
19.4.2. Distributors
20. Japan Marine Alternators and Motors Market Analysis and Forecast
20.1. Key Findings
20.2. Marine Alternators and Motors Market Size (US$ Mn and ‘000 Units) Forecast by Product, 2016 – 2026
20.2.1. Alternator
20.2.1.1. Shaft Generator
20.2.1.2. Diesel Generator
20.2.1.3. Emergency Generator
20.2.2. Motor
20.2.2.1. Pumps
20.2.2.2. Deck Cranes
20.2.2.3. Thrusters
20.2.2.4. Winched
20.2.2.5. Compressors
20.2.2.6. Others
20.3. Marine Alternators and Motors Market Size
20.3.1. Alternator
20.3.1.1. Up to 410 kVA
20.3.1.2. 411 to 1000 kVA
20.3.1.3. 1001 to 3900 kVA
20.3.1.4. More than 3900 kVA
20.3.2. Motor
20.3.2.1. Below 11 KW
20.3.2.2. 11 KW to 110 KW
20.3.2.3. 110 KW to 600 KW
20.3.2.4. 600 KW to 1500 KW
20.3.2.5. Above 1500 KW
20.4. Marine Alternators and Motors Market Size (US$ Mn and ‘000 Units) Forecast by Distribution Channel, 2016 – 2026
20.4.1. Direct Sales
20.4.2. Distributors
21. India Marine Alternators and Motors Market Analysis and Forecast
21.1. Marine Alternators and Motors Market Size (US$ Mn and ‘000 Units) Forecast by Product, 2016 – 2026
21.1.1. Alternator
21.1.1.1. Shaft Generator
21.1.1.2. Diesel Generator
21.1.1.3. Emergency Generator
21.1.2. Motor
21.1.2.1. Pumps
21.1.2.2. Deck Cranes
21.1.2.3. Thrusters
21.1.2.4. Winched
21.1.2.5. Compressors
21.1.2.6. Others
21.2. Marine Alternators and Motors Market Size (US$ Mn and ‘000 Units) Forecast by Capacity, 2016 – 2026
21.2.1. Alternator
21.2.1.1. Up to 410 kVA
21.2.1.2. 411 to 1000 kVA
21.2.1.3. 1001 to 3900 kVA
21.2.1.4. More than 3900 kVA
21.2.2. Motor
21.2.2.1. Below 11 KW
21.2.2.2. 11 KW to 110 KW
21.2.2.3. 110 KW to 600 KW
21.2.2.4. 600 KW to 1500 KW
21.2.2.5. Above 1500 KW
21.3. Marine Alternators and Motors Market Size (US$ Mn and ‘000 Units) Forecast by Distribution Channel, 2016 – 2026
21.3.1. Direct Sales
21.3.2. Distributors
22. Australia Marine Alternators and Motors Market Analysis and Forecast
22.1. Key Findings
22.2. Marine Alternators and Motors Market Size (US$ Mn and ‘000 Units) Forecast by Product, 2016 – 2026
22.2.1. Alternator
22.2.1.1. Shaft Generator
22.2.1.2. Diesel Generator
22.2.1.3. Emergency Generator
22.2.2. Motor
22.2.2.1. Pumps
22.2.2.2. Deck Cranes
22.2.2.3. Thrusters
22.2.2.4. Winched
22.2.2.5. Compressors
22.2.2.6. Others
22.3. Marine Alternators and Motors Market Size (US$ Mn and ‘000 Units) Forecast by Capacity, 2016 – 2026
22.3.1. Alternator
22.3.1.1. Up to 410 kVA
22.3.1.2. 411 to 1000 kVA
22.3.1.3. 1001 to 3900 kVA
22.3.1.4. More than 3900 kVA
22.3.2. Motor
22.3.2.1. Below 11 KW
22.3.2.2. 11 KW to 110 KW
22.3.2.3. 110 KW to 600 KW
22.3.2.4. 600 KW to 1500 KW
22.3.2.5. Above 1500 KW
22.4. Marine Alternators and Motors Market Size (US$ Mn and ‘000 Units) Forecast by Distribution Channel, 2016 – 2026
22.4.1. Direct Sales
22.4.2. Distributors
23. Korea Marine Alternators and Motors Market Analysis and Forecast
23.1. Key Findings
23.2. Marine Alternators and Motors Market Size (US$ Mn and ‘000 Units) Forecast by Product, 2016 – 2026
23.2.1. Alternator
23.2.1.1. Shaft Generator
23.2.1.2. Diesel Generator
23.2.1.3. Emergency Generator
23.2.2. Motor
23.2.2.1. Pumps
23.2.2.2. Deck Cranes
23.2.2.3. Thrusters
23.2.2.4. Winched
23.2.2.5. Compressors
23.2.2.6. Others
23.3. Marine Alternators and Motors Market Size (US$ Mn and ‘000 Units) Forecast by Capacity, 2016 – 2026
23.3.1. Alternator
23.3.1.1. Up to 410 kVA
23.3.1.2. 411 to 1000 kVA
23.3.1.3. 1001 to 3900 kVA
23.3.1.4. More than 3900 kVA
23.3.2. Motor
23.3.2.1. Below 11 KW
23.3.2.2. 11 KW to 110 KW
23.3.2.3. 110 KW to 600 KW
23.3.2.4. 600 KW to 1500 KW
23.3.2.5. Above 1500 KW
23.4. Marine Alternators and Motors Market Size (US$ Mn and ‘000 Units) Forecast by Distribution Channel, 2016 – 2026
23.4.1. Direct Sales
23.4.2. Distributors
24. Vietnam Marine Alternators and Motors Market Analysis and Forecast
24.1. Key Findings
24.2. Marine Alternators and Motors Market Size (US$ Mn and ‘000 Units) Forecast by Product, 2016 – 2026
24.2.1. Alternator
24.2.1.1. Shaft Generator
24.2.1.2. Diesel Generator
24.2.1.3. Emergency Generator
24.2.2. Motor
24.2.2.1. Pumps
24.2.2.2. Deck Cranes
24.2.2.3. Thrusters
24.2.2.4. Winched
24.2.2.5. Compressors
24.2.2.6. Others
24.3. Marine Alternators and Motors Market Size (US$ Mn and ‘000 Units) Forecast by Capacity, 2016 – 2026
24.3.1. Alternator
24.3.1.1. Up to 410 kVA
24.3.1.2. 411 to 1000 kVA
24.3.1.3. 1001 to 3900 kVA
24.3.1.4. More than 3900 kVA
24.3.2. Motor
24.3.2.1. Below 11 KW
24.3.2.2. 11 KW to 110 KW
24.3.2.3. 110 KW to 600 KW
24.3.2.4. 600 KW to 1500 KW
24.3.2.5. Above 1500 KW
24.4. Marine Alternators and Motors Market Size (US$ Mn and ‘000 Units) Forecast by Distribution Channel, 2016 – 2026
24.4.1. Direct Sales
24.4.2. Distributors
25. Philippines Marine Alternators and Motors Market Analysis and Forecast
25.1. Key Findings
25.2. Marine Alternators and Motors Market Size (US$ Mn and ‘000 Units) Forecast by Product, 2016 – 2026
25.2.1. Alternator
25.2.1.1. Shaft Generator
25.2.1.2. Diesel Generator
25.2.1.3. Emergency Generator
25.2.2. Motor
25.2.2.1. Pumps
25.2.2.2. Deck Cranes
25.2.2.3. Thrusters
25.2.2.4. Winched
25.2.2.5. Compressors
25.2.2.6. Others
25.3. Marine Alternators and Motors Market Size (US$ Mn and ‘000 Units) Forecast by Capacity, 2016 – 2026
25.3.1. Alternator
25.3.1.1. Up to 410 kVA
25.3.1.2. 411 to 1000 kVA
25.3.1.3. 1001 to 3900 kVA
25.3.1.4. More than 3900 kVA
25.3.2. Motor
25.3.2.1. Below 600 KW
25.3.2.2. 600 to 1500 KW
25.3.2.3. Above 1500 KW
25.4. Marine Alternators and Motors Market Size (US$ Mn and ‘000 Units) Forecast by Distribution Channel, 2016 – 2026
25.4.1. Direct Sales
25.4.2. Distributors
26. Malaysia Marine Alternators and Motors Market
Analysis and Forecast
26.1. Key Findings
26.2. Marine Alternators and Motors Market Size (US$ Mn and ‘000 Units) Forecast by Product, 2016 – 2026
26.2.1. Alternator
26.2.1.1. Shaft Generator
26.2.1.2. Diesel Generator
26.2.1.3. Emergency Generator
26.2.2. Motor
26.2.2.1. Pumps
26.2.2.2. Deck Cranes
26.2.2.3. Thrusters
26.2.2.4. Winched
26.2.2.5. Compressors
26.2.2.6. Others
26.3. Marine Alternators and Motors Market Size (US$ Mn and ‘000 Units) Forecast by Capacity, 2016 – 2026
26.3.1. Alternator
26.3.1.1. Up to 410 kVA
26.3.1.2. 411 to 1000 kVA
26.3.1.3. 1001 to 3900 kVA
26.3.1.4. More than 3900 kVA
26.3.2. Motor
26.3.2.1. Below 11 KW
26.3.2.2. 11 KW to 110 KW
26.3.2.3. 110 KW to 600 KW
26.3.2.4. 600 KW to 1500 KW
26.3.2.5. Above 1500 KW
26.4. Marine Alternators and Motors Market Size (US$ Mn and ‘000 Units) Forecast by Distribution Channel, 2016 – 2026
26.4.1. Direct Sales
26.4.2. Distributors
27. Taiwan Marine Alternators and Motors Market Analysis and Forecast
27.1. Key Findings
27.2. Marine Alternators and Motors Market Size (US$ Mn and ‘000 Units) Forecast by Product, 2016 – 2026
27.2.1. Alternator
27.2.1.1. Shaft Generator
27.2.1.2. Diesel Generator
27.2.1.3. Emergency Generator
27.2.2. Motor
27.2.2.1. Pumps
27.2.2.2. Deck Cranes
27.2.2.3. Thrusters
27.2.2.4. Winched
27.2.2.5. Compressors
27.2.2.6. Others
27.3. Marine Alternators and Motors Market Size (US$ Mn and ‘000 Units) Forecast by Capacity, 2016 – 2026
27.3.1. Alternator
27.3.1.1. Up to 410 kVA
27.3.1.2. 411 to 1000 kVA
27.3.1.3. 1001 to 3900 kVA
27.3.1.4. More than 3900 kVA
27.3.2. Motor
27.3.2.1. Below 11 KW
27.3.2.2. 11 KW to 110 KW
27.3.2.3. 110 KW to 600 KW
27.3.2.4. 600 KW to 1500 KW
27.3.2.5. Above 1500 KW
27.4. Marine Alternators and Motors Market Size (US$ Mn and ‘000 Units) Forecast by Distribution Channel, 2016 – 2026
27.4.1. Direct Sales
27.4.2. Distributors
28. Middle East & Africa (MEA) Marine Alternators and Motors Market Analysis and Forecast
28.1. Key Findings
28.2. Market Dynamics
28.2.1. Drivers
28.2.2. Restraints
28.2.3. Opportunities
28.2.4. Impact Analysis of Drivers & Restraints
28.3. Marine Alternators and Motors Market Size (US$ Mn and ‘000 Units) Forecast by Product, 2016 – 2026
28.3.1. Alternator
28.3.1.1. Shaft Generator
28.3.1.2. Diesel Generator
28.3.1.3. Emergency Generator
28.3.2. Motor
28.3.2.1. Pumps
28.3.2.2. Deck Cranes
28.3.2.3. Thrusters
28.3.2.4. Winched
28.3.2.5. Compressors
28.3.2.6. Others
28.4. Marine Alternators and Motors Market Size (US$ Mn and ‘000 Units) Forecast by Capacity, 2016 – 2026
28.4.1. Alternator
28.4.1.1. Up to 410 kVA
28.4.1.2. 411 to 1000 kVA
28.4.1.3. 1001 to 3900 kVA
28.4.1.4. More than 3900 kVA
28.4.2. Motor
28.4.2.1. Below 11 KW
28.4.2.2. 11 KW to 110 KW
28.4.2.3. 110 KW to 600 KW
28.4.2.4. 600 KW to 1500 KW
28.4.2.5. Above 1500 KW
28.5. Marine Alternators and Motors Market Size (US$ Mn and ‘000 Units) Forecast by Distribution Channel, 2016 – 2026
28.5.1. Direct Sales
28.5.2. Distributors
28.6. Marine Alternators and Motors Market Size (US$ Mn and ‘000 Units) Forecast by Country & Sub-region, 2016 – 2026
28.6.1. GCC Countries
28.6.2. South Africa
28.6.3. Northern Africa
28.6.4. Rest of MEA
28.7. Market Attractiveness Analysis
28.7.1. By Product
28.7.2. By Capacity
28.7.3. By Country
29. GCC Countries Marine Alternators and Motors Market Analysis and Forecast
29.1. Key Findings
29.2. Marine Alternators and Motors Market Size (US$ Mn and ‘000 Units) Forecast by Product, 2016 – 2026
29.2.1. Alternator
29.2.1.1. Shaft Generator
29.2.1.2. Diesel Generator
29.2.1.3. Emergency Generator
29.2.2. Motor
29.2.2.1. Pumps
29.2.2.2. Deck Cranes
29.2.2.3. Thrusters
29.2.2.4. Winched
29.2.2.5. Compressors
29.2.2.6. Others
29.3. Marine Alternators and Motors Market Size (US$ Mn and ‘000 Units) Forecast by Capacity, 2016 – 2026
29.3.1. Alternator
29.3.1.1. Up to 410 kVA
29.3.1.2. 411 to 1000 kVA
29.3.1.3. 1001 to 3900 kVA
29.3.1.4. More than 3900 kVA
29.3.2. Motor
29.3.2.1. Below 11 KW
29.3.2.2. 11 KW to 110 KW
29.3.2.3. 110 KW to 600 KW
29.3.2.4. 600 KW to 1500 KW
29.3.2.5. Above 1500 KW
29.4. Marine Alternators and Motors Market Size (US$ Mn and ‘000 Units) Forecast by Distribution Channel, 2016 – 2026
29.4.1. Direct Sales
29.4.2. Distributors
30. South Africa Marine Alternators and Motors Market Analysis and Forecast
30.1. Key Findings
30.2. Marine Alternators and Motors Market Size (US$ Mn and ‘000 Units) Forecast by Product, 2016 – 2026
30.2.1. Alternator
30.2.1.1. Shaft Generator
30.2.1.2. Diesel Generator
30.2.1.3. Emergency Generator
30.2.2. Motor
30.2.2.1. Pumps
30.2.2.2. Deck Cranes
30.2.2.3. Thrusters
30.2.2.4. Winched
30.2.2.5. Compressors
30.2.2.6. Others
30.3. Marine Alternators and Motors Market Size (US$ Mn and ‘000 Units) Forecast by Capacity, 2016 – 2026
30.3.1. Alternator
30.3.1.1. Up to 410 kVA
30.3.1.2. 411 to 1000 kVA
30.3.1.3. 1001 to 3900 kVA
30.3.1.4. More than 3900 kVA
30.3.2. Motor
30.3.2.1. Below 11 KW
30.3.2.2. 11 KW to 110 KW
30.3.2.3. 110 KW to 600 KW
30.3.2.4. 600 KW to 1500 KW
30.3.2.5. Above 1500 KW
30.4. Marine Alternators and Motors Market Size (US$ Mn and ‘000 Units) Forecast by Distribution Channel, 2016 – 2026
30.4.1. Direct Sales
30.4.2. Distributors
31. Northern Africa Marine Alternators and Motors Market Analysis and Forecast
31.1. Key Findings
31.2. Marine Alternators and Motors Market Size (US$ Mn and ‘000 Units) Forecast by Product, 2016 – 2026
31.2.1. Alternator
31.2.1.1. Shaft Generator
31.2.1.2. Diesel Generator
31.2.1.3. Emergency Generator
31.2.2. Motor
31.2.2.1. Pumps
31.2.2.2. Deck Cranes
31.2.2.3. Thrusters
31.2.2.4. Winched
31.2.2.5. Compressors
31.2.2.6. Others
31.3. Marine Alternators and Motors Market Size (US$ Mn and ‘000 Units) Forecast by Capacity, 2016 – 2026
31.3.1. Alternator
31.3.1.1. Up to 410 kVA
31.3.1.2. 411 to 1000 kVA
31.3.1.3. 1001 to 3900 kVA
31.3.1.4. More than 3900 kVA
31.3.2. Motor
31.3.2.1. Below 11 KW
31.3.2.2. 11 KW to 110 KW
31.3.2.3. 110 KW to 600 KW
31.3.2.4. 600 KW to 1500 KW
31.3.2.5. Above 1500 KW
31.4. Marine Alternators and Motors Market Size (US$ Mn and ‘000 Units) Forecast by Distribution Channel, 2016 – 2026
31.4.1. Direct Sales
31.4.2. Distributors
32. South America Marine Alternators and Motors Market Analysis and Forecast
32.1. Key Findings
32.2. Market Dynamics
32.2.1. Drivers
32.2.2. Restraints
32.2.3. Opportunities
32.2.4. Impact Analysis of Drivers & Restraints
32.3. Marine Alternators and Motors Market Size (US$ Mn and ‘000 Units) Forecast by Product, 2016 – 2026
32.3.1. Alternator
32.3.1.1. Shaft Generator
32.3.1.2. Diesel Generator
32.3.1.3. Emergency Generator
32.3.2. Motor
32.3.2.1. Pumps
32.3.2.2. Deck Cranes
32.3.2.3. Thrusters
32.3.2.4. Winched
32.3.2.5. Compressors
32.3.2.6. Others
32.4. Marine Alternators and Motors Market Size (US$ Mn and ‘000 Units) Forecast by Capacity, 2016 – 2026
32.4.1. Alternator
32.4.1.1. Up to 410 kVA
32.4.1.2. 411 to 1000 kVA
32.4.1.3. 1001 to 3900 kVA
32.4.1.4. More than 3900 kVA
32.4.2. Motor
32.4.2.1. Below 11 KW
32.4.2.2. 11 KW to 110 KW
32.4.2.3. 110 KW to 600 KW
32.4.2.4. 600 KW to 1500 KW
32.4.2.5. Above 1500 KW
32.5. Marine Alternators and Motors Market Size (US$ Mn and ‘000 Units) Forecast by Distribution Channel, 2016 – 2026
32.5.1. Direct Sales
32.5.2. Distributors
32.6. Marine Alternators and Motors Market Size (US$ Mn and ‘000 Units) Forecast, By Country, 2016 - 2026
32.6.1. Brazil
32.6.2. Rest of South America
32.7. Market Attractiveness Analysis
32.7.1. By Product
32.7.2. By Capacity
32.7.3. By Country
33. Competition Landscape
33.1. Market Player – Competition Matrix
33.2. Market Share Analysis By Company (2017)
33.3. Company Profiles (Details – Overview,
Financials, SWOT Analysis, and Strategy)
33.3.1. ABB Ltd
33.3.2. American Power Systems
33.3.3. BBB Industries
33.3.4. Caterpillar Inc.
33.3.5. Cummins Inc.
33.3.6. Danfoss A/S
33.3.7. Felm S.r.l
33.3.8. Hoyer Motors
33.3.9. Lynch Motor
33.3.10. Mecc Alte
33.3.11. Mitsubishi Corporation
33.3.12. Nidec Corporation
33.3.13. Prestolite Electric Llc
33.3.14. Siemens AG
33.3.15. Soga SPA
33.3.16. VEM Group
33.3.17. WEG Industries
33.4. Genset Manufacturers
33.4.1. Caterpillar Inc.
33.4.2. Fischer Panda GmbH
33.4.3. Kohler Power
33.4.4. MAN SE
33.4.5. Mase generator Spa
33.4.6. Nanni Industries SAS
33.4.7. Northern Lights Inc.
33.4.8. Polar Power Inc.
33.4.9. Sole Diesel S.A.
33.4.10. Whisper Power B.V.
33.5. Propulsion & Thruster System Manufacturer
33.5.1. AB Volvo Penta
33.5.2. BAE Systems
33.5.3. Caterpillar Inc.
33.5.4. Cummins Inc.
33.5.5. Fairbanks Morse Engine
33.5.6. General Electric
33.5.7. Rolls Royce Plc.
33.5.8. STEYR MOTORS GmbH
33.5.9. Torqeedo GmbH
33.5.10. Wartsila Corporation
33.3.1. ABB Ltd
34. Key Takeaways
List of Tables
Table 1 : Global Marine Alternators & Motors Market Volume Size & Forecast,‘000 Units by Product 2016-2026
Table 2 : Global Marine Alternators & Motors Market Value Size & Forecast, US$ Mn and ‘000 Units by Product 2016-2026
Table 3 : Global Marine Alternators & Motors Market Volume Size & Forecast,‘000 Units by Capacity 2016-2026
Table 4 : Global Marine Alternators & Motors Market Value Size & Forecast, US$ Mn and ‘000 Units by Capacity 2016-2026
Table 5 : Global Marine Alternators & Motors Market Volume Size & Forecast,‘000 Units by Distribution Channel 2016-2026
Table 6 : Global Marine Alternators & Motors Market Value Size & Forecast, US$ Mn and ‘000 Units by Distribution Channel 2016-2026
Table 7 : Global Marine Alternators & Motors Market Volume Size & Forecast,‘000 Units by Region, 2016-2026
Table 8 : Global Marine Alternators & Motors Market Value Size & Forecast, US$ Mn and ‘000 Units by Region, 2016-2026
Table 9 : North America Marine Alternators & Motors Market Volume Size & Forecast,‘000 Units by Product 2016-2026
Table 10 : North America Marine Alternators & Motors Market Value Size & Forecast, US$ Mn and ‘000 Units by Product 2016-2026
Table 11 : North America Marine Alternators & Motors Market Volume Size & Forecast,‘000 Units by Capacity 2016-2026
Table 12 : North America Marine Alternators & Motors Market Value Size & Forecast, US$ Mn and ‘000 Units by Capacity 2016-2026
Table 13 : North America Marine Alternators & Motors Market Volume Size & Forecast,‘000 Units by Distribution Channel 2016-2026
Table 14 : North America Marine Alternators & Motors Market Value Size & Forecast, US$ Mn and ‘000 Units by Distribution Channel 2016-2026
Table 15 : North America Marine Alternators & Motors Market Volume Size & Forecast,‘000 Units by Country 2016-2026
Table 16 : North America Marine Alternators & Motors Market Value Size & Forecast, US$ Mn and ‘000 Units by Country 2016-2026
Table 17 : U.S. Marine Alternators & Motors Market Volume Size & Forecast,‘000 Units by Product 2016-2026
Table 18 : U.S. Marine Alternators & Motors Market Value Size & Forecast, US$ Mn and ‘000 Units by Product 2016-2026
Table 19 : U.S. Marine Alternators & Motors Market Volume Size & Forecast,‘000 Units by Capacity 2016-2026
Table 20 : U.S. Marine Alternators & Motors Market Value Size & Forecast, US$ Mn and ‘000 Units by Capacity 2016-2026
Table 21 : U.S. Marine Alternators & Motors Market Volume Size & Forecast,‘000 Units by Distribution Channel 2016-2026
Table 22 : U.S. Marine Alternators & Motors Market Value Size & Forecast, US$ Mn and ‘000 Units by Distribution Channel 2016-2026
Table 23 : Canada Marine Alternators & Motors Market Volume Size & Forecast,‘000 Units by Product 2016-2026
Table 24 : Canada Marine Alternators & Motors Market Value Size & Forecast, US$ Mn and ‘000 Units by Product 2016-2026
Table 25 : Canada Marine Alternators & Motors Market Volume Size & Forecast,‘000 Units by Capacity 2016-2026
Table 26 : Canada Marine Alternators & Motors Market Value Size & Forecast, US$ Mn and ‘000 Units by Capacity 2016-2026
Table 27 : Canada Marine Alternators & Motors Market Volume Size & Forecast,‘000 Units by Distribution Channel 2016-2026
Table 28 : Canada Marine Alternators & Motors Market Value Size & Forecast, US$ Mn and ‘000 Units by Distribution Channel 2016-2026
Table 29 : Europe Marine Alternators & Motors Market Volume Size & Forecast,‘000 Units by Product 2016-2026
Table 30 : Europe Marine Alternators & Motors Market Value Size & Forecast, US$ Mn and ‘000 Units by Product 2016-2026
Table 31 : Europe Marine Alternators & Motors Market Volume Size & Forecast,‘000 Units by Capacity 2016-2026
Table 32 : Europe Marine Alternators & Motors Market Value Size & Forecast, US$ Mn and ‘000 Units by Capacity 2016-2026
Table 33 : Europe Marine Alternators & Motors Market Volume Size & Forecast,‘000 Units by Distribution Channel 2016-2026
Table 34 : Europe Marine Alternators & Motors Market Value Size & Forecast, US$ Mn and ‘000 Units by Distribution Channel 2016-2026
Table 35 : Europe Marine Alternators & Motors Market Volume Size & Forecast,‘000 Units by Country 2016-2026
Table 36 : Europe Marine Alternators & Motors Market Value Size & Forecast, US$ Mn and ‘000 Units by Country 2016-2026
Table 37 : Germany Marine Alternators & Motors Market Volume Size & Forecast,‘000 Units by Product 2016-2026
Table 38 : Germany Marine Alternators & Motors Market Value Size & Forecast, US$ Mn and ‘000 Units by Product 2016-2026
Table 39 : Germany Marine Alternators & Motors Market Volume Size & Forecast,‘000 Units by Capacity 2016-2026
Table 40 : Germany Marine Alternators & Motors Market Value Size & Forecast, US$ Mn and ‘000 Units by Capacity 2016-2026
Table 41 : Germany Marine Alternators & Motors Market Volume Size & Forecast,‘000 Units by Distribution Channel 2016-2026
Table 42 : Germany Marine Alternators & Motors Market Value Size & Forecast, US$ Mn and ‘000 Units by Distribution Channel 2016-2026
Table 43 : U.K. Marine Alternators & Motors Market Volume Size & Forecast,‘000 Units by Product 2016-2026
Table 44 : U.K. Marine Alternators & Motors Market Value Size & Forecast, US$ Mn and ‘000 Units by Product 2016-2026
Table 45 : U.K. Marine Alternators & Motors Market Volume Size & Forecast,‘000 Units by Capacity 2016-2026
Table 46 : U.K. Marine Alternators & Motors Market Value Size & Forecast, US$ Mn and ‘000 Units by Capacity 2016-2026
Table 47 : U.K. Marine Alternators & Motors Market Volume Size & Forecast,‘000 Units by Distribution Channel 2016-2026
Table 48 : U.K. Marine Alternators & Motors Market Value Size & Forecast, US$ Mn and ‘000 Units by Distribution Channel 2016-2026
Table 49 : France Marine Alternators & Motors Market Volume Size & Forecast,‘000 Units by Product 2016-2026
Table 50 : France Marine Alternators & Motors Market Value Size & Forecast, US$ Mn and ‘000 Units by Product 2016-2026
Table 51 : France Marine Alternators & Motors Market Volume Size & Forecast,‘000 Units by Capacity 2016-2026
Table 52 : France Marine Alternators & Motors Market Value Size & Forecast, US$ Mn and ‘000 Units by Capacity 2016-2026
Table 53 : France Marine Alternators & Motors Market Volume Size & Forecast,‘000 Units by Distribution Channel 2016-2026
Table 54 : France Marine Alternators & Motors Market Value Size & Forecast, US$ Mn and ‘000 Units by Distribution Channel 2016-2026
Table 55 : Italy Marine Alternators & Motors Market Volume Size & Forecast,‘000 Units by Product 2016-2026
Table 56 : Italy Marine Alternators & Motors Market Value Size & Forecast, US$ Mn and ‘000 Units by Product 2016-2026
Table 57 : Italy Marine Alternators & Motors Market Volume Size & Forecast,‘000 Units by Capacity 2016-2026
Table 58 : Italy Marine Alternators & Motors Market Value Size & Forecast, US$ Mn and ‘000 Units by Capacity 2016-2026
Table 59 : Italy Marine Alternators & Motors Market Volume Size & Forecast,‘000 Units by Distribution Channel 2016-2026
Table 60 : Italy Marine Alternators & Motors Market Value Size & Forecast, US$ Mn and ‘000 Units by Distribution Channel 2016-2026
Table 61 : Spain Marine Alternators & Motors Market Volume Size & Forecast,‘000 Units by Product 2016-2026
Table 62 : Spain Marine Alternators & Motors Market Value Size & Forecast, US$ Mn and ‘000 Units by Product 2016-2026
Table 63 : Spain Marine Alternators & Motors Market Volume Size & Forecast,‘000 Units by Capacity 2016-2026
Table 64 : Spain Marine Alternators & Motors Market Value Size & Forecast, US$ Mn and ‘000 Units by Capacity 2016-2026
Table 65 : Spain Marine Alternators & Motors Market Volume Size & Forecast,‘000 Units by Distribution Channel 2016-2026
Table 66 : Spain Marine Alternators & Motors Market Value Size & Forecast, US$ Mn and ‘000 Units by Distribution Channel 2016-2026
Table 67 : Portugal Marine Alternators & Motors Market Volume Size & Forecast,‘000 Units by Product 2016-2026
Table 68 : Portugal Marine Alternators & Motors Market Value Size & Forecast, US$ Mn and ‘000 Units by Product 2016-2026
Table 69 : Portugal Marine Alternators & Motors Market Volume Size & Forecast,‘000 Units by Capacity 2016-2026
Table 70 : Portugal Marine Alternators & Motors Market Value Size & Forecast, US$ Mn and ‘000 Units by Capacity 2016-2026
Table 71 : Portugal Marine Alternators & Motors Market Volume Size & Forecast,‘000 Units by Distribution Channel 2016-2026
Table 72 : Portugal Marine Alternators & Motors Market Value Size & Forecast, US$ Mn and ‘000 Units by Distribution Channel 2016-2026
Table 73 : Scandinavia Marine Alternators & Motors Market Volume Size & Forecast,‘000 Units by Product 2016-2026
Table 74 : Scandinavia Marine Alternators & Motors Market Value Size & Forecast, US$ Mn and ‘000 Units by Product 2016-2026
Table 75 : Scandinavia Marine Alternators & Motors Market Volume Size & Forecast,‘000 Units by Capacity 2016-2026
Table 76 : Scandinavia Marine Alternators & Motors Market Value Size & Forecast, US$ Mn and ‘000 Units by Capacity 2016-2026
Table 77 : Scandinavia Marine Alternators & Motors Market Volume Size & Forecast,‘000 Units by Distribution Channel 2016-2026
Table 78 : Scandinavia Marine Alternators & Motors Market Value Size & Forecast, US$ Mn and ‘000 Units by Distribution Channel 2016-2026
Table 79 : Balkans Marine Alternators & Motors Market Volume Size & Forecast,‘000 Units by Product 2016-2026
Table 80 : Balkans Marine Alternators & Motors Market Value Size & Forecast, US$ Mn and ‘000 Units by Product 2016-2026
Table 81 : Balkans Marine Alternators & Motors Market Volume Size & Forecast,‘000 Units by Capacity 2016-2026
Table 82 : Balkans Marine Alternators & Motors Market Value Size & Forecast, US$ Mn and ‘000 Units by Capacity 2016-2026
Table 83 : Balkans Marine Alternators & Motors Market Volume Size & Forecast,‘000 Units by Distribution Channel 2016-2026
Table 84 : Balkans Marine Alternators & Motors Market Value Size & Forecast, US$ Mn and ‘000 Units by Distribution Channel 2016-2026
Table 85 : Asia Pacific Marine Alternators & Motors Market Volume Size & Forecast,‘000 Units by Product 2016-2026
Table 86 : Asia Pacific Marine Alternators & Motors Market Value Size & Forecast, US$ Mn and ‘000 Units by Product 2016-2026
Table 87 : Asia Pacific Marine Alternators & Motors Market Volume Size & Forecast,‘000 Units by Capacity 2016-2026
Table 88 : Asia Pacific Marine Alternators & Motors Market Value Size & Forecast, US$ Mn and ‘000 Units by Capacity 2016-2026
Table 89 : Asia Pacific Marine Alternators & Motors Market Volume Size & Forecast,‘000 Units by Distribution Channel 2016-2026
Table 90 : Asia Pacific Marine Alternators & Motors Market Value Size & Forecast, US$ Mn and ‘000 Units by Distribution Channel 2016-2026
Table 91 : Asia Pacific Marine Alternators & Motors Market Volume Size & Forecast,‘000 Units by Country 2016-2026
Table 92 : Asia Pacific Marine Alternators & Motors Market Value Size & Forecast, US$ Mn and ‘000 Units by Country 2016-2026
Table 93 : China Marine Alternators & Motors Market Volume Size & Forecast,‘000 Units by Product 2016-2026
Table 94 : China Marine Alternators & Motors Market Value Size & Forecast, US$ Mn and ‘000 Units by Product 2016-2026
Table 95 : China Marine Alternators & Motors Market Volume Size & Forecast,‘000 Units by Capacity 2016-2026
Table 96 : China Marine Alternators & Motors Market Value Size & Forecast, US$ Mn and ‘000 Units by Capacity 2016-2026
Table 97 : China Marine Alternators & Motors Market Volume Size & Forecast,‘000 Units by Distribution Channel 2016-2026
Table 98 : China Marine Alternators & Motors Market Value Size & Forecast, US$ Mn and ‘000 Units by Distribution Channel 2016-2026
Table 99 : Japan Marine Alternators & Motors Market Volume Size & Forecast,‘000 Units by Product 2016-2026
Table 100 : Japan Marine Alternators & Motors Market Value Size & Forecast, US$ Mn and ‘000 Units by Product 2016-2026
Table 101 : Japan Marine Alternators & Motors Market Volume Size & Forecast,‘000 Units by Capacity 2016-2026
Table 102 : Japan Marine Alternators & Motors Market Value Size & Forecast, US$ Mn and ‘000 Units by Capacity 2016-2026
Table 103 : Japan Marine Alternators & Motors Market Volume Size & Forecast,‘000 Units by Distribution Channel 2016-2026
Table 104 : Japan Marine Alternators & Motors Market Value Size & Forecast, US$ Mn and ‘000 Units by Distribution Channel 2016-2026
Table 105 : India Marine Alternators & Motors Market Volume Size & Forecast,‘000 Units by Product 2016-2026
Table 106 : India Marine Alternators & Motors Market Value Size & Forecast, US$ Mn and ‘000 Units by Product 2016-2026
Table 107 : India Marine Alternators & Motors Market Volume Size & Forecast,‘000 Units by Capacity 2016-2026
Table 108 : India Marine Alternators & Motors Market Value Size & Forecast, US$ Mn and ‘000 Units by Capacity 2016-2026
Table 109 : India Marine Alternators & Motors Market Volume Size & Forecast,‘000 Units by Distribution Channel 2016-2026
Table 110 : India Marine Alternators & Motors Market Value Size & Forecast, US$ Mn and ‘000 Units by Distribution Channel 2016-2026
Table 111 : Australia Marine Alternators & Motors Market Volume Size & Forecast,‘000 Units by Product 2016-2026
Table 112 : Australia Marine Alternators & Motors Market Value Size & Forecast, US$ Mn and ‘000 Units by Product 2016-2026
Table 113 : Australia Marine Alternators & Motors Market Volume Size & Forecast,‘000 Units by Capacity 2016-2026
Table 114 : Australia Marine Alternators & Motors Market Value Size & Forecast, US$ Mn and ‘000 Units by Capacity 2016-2026
Table 115 : Australia Marine Alternators & Motors Market Volume Size & Forecast,‘000 Units by Distribution Channel 2016-2026
Table 116 : Australia Marine Alternators & Motors Market Value Size & Forecast, US$ Mn and ‘000 Units by Distribution Channel 2016-2026
Table 117 : Korea Marine Alternators & Motors Market Volume Size & Forecast,‘000 Units by Product 2016-2026
Table 118 : Korea Marine Alternators & Motors Market Value Size & Forecast, US$ Mn and ‘000 Units by Product 2016-2026
Table 119 : Korea Marine Alternators & Motors Market Volume Size & Forecast,‘000 Units by Capacity 2016-2026
Table 120 : Korea Marine Alternators & Motors Market Value Size & Forecast, US$ Mn and ‘000 Units by Capacity 2016-2026
Table 121 : Korea Marine Alternators & Motors Market Volume Size & Forecast,‘000 Units by Distribution Channel 2016-2026
Table 122 : Korea Marine Alternators & Motors Market Value Size & Forecast, US$ Mn and ‘000 Units by Distribution Channel 2016-2026
Table 123 : Vietnam Marine Alternators & Motors Market Volume Size & Forecast,‘000 Units by Product 2016-2026
Table 124 : Vietnam Marine Alternators & Motors Market Value Size & Forecast, US$ Mn and ‘000 Units by Product 2016-2026
Table 125 : Vietnam Marine Alternators & Motors Market Volume Size & Forecast,‘000 Units by Capacity 2016-2026
Table 126 : Vietnam Marine Alternators & Motors Market Value Size & Forecast, US$ Mn and ‘000 Units by Capacity 2016-2026
Table 127 : Vietnam Marine Alternators & Motors Market Volume Size & Forecast,‘000 Units by Distribution Channel 2016-2026
Table 128 : Vietnam Marine Alternators & Motors Market Value Size & Forecast, US$ Mn and ‘000 Units by Distribution Channel 2016-2026
Table 129 : Philippines Marine Alternators & Motors Market Volume Size & Forecast,‘000 Units by Product 2016-2026
Table 130 : Philippines Marine Alternators & Motors Market Value Size & Forecast, US$ Mn and ‘000 Units by Product 2016-2026
Table 131 : Philippines Marine Alternators & Motors Market Volume Size & Forecast,‘000 Units by Capacity 2016-2026
Table 132 : Philippines Marine Alternators & Motors Market Value Size & Forecast, US$ Mn and ‘000 Units by Capacity 2016-2026
Table 133 : Philippines Marine Alternators & Motors Market Volume Size & Forecast,‘000 Units by Distribution Channel 2016-2026
Table 134 : Philippines Marine Alternators & Motors Market Value Size & Forecast, US$ Mn and ‘000 Units by Distribution Channel 2016-2026
Table 135 : Malaysia Marine Alternators & Motors Market Volume Size & Forecast,‘000 Units by Product 2016-2026
Table 136 : Malaysia Marine Alternators & Motors Market Value Size & Forecast, US$ Mn and ‘000 Units by Product 2016-2026
Table 137 : Malaysia Marine Alternators & Motors Market Volume Size & Forecast,‘000 Units by Capacity 2016-2026
Table 138 : Malaysia Marine Alternators & Motors Market Value Size & Forecast, US$ Mn and ‘000 Units by Capacity 2016-2026
Table 139 : Malaysia Marine Alternators & Motors Market Volume Size & Forecast,‘000 Units by Distribution Channel 2016-2026
Table 140 : Malaysia Marine Alternators & Motors Market Value Size & Forecast, US$ Mn and ‘000 Units by Distribution Channel 2016-2026
Table 141 : Taiwan Marine Alternators & Motors Market Volume Size & Forecast,‘000 Units by Product 2016-2026
Table 142 : Taiwan Marine Alternators & Motors Market Value Size & Forecast, US$ Mn and ‘000 Units by Product 2016-2026
Table 143 : Taiwan Marine Alternators & Motors Market Volume Size & Forecast,‘000 Units by Capacity 2016-2026
Table 144 : Taiwan Marine Alternators & Motors Market Value Size & Forecast, US$ Mn and ‘000 Units by Capacity 2016-2026
Table 145 : Taiwan Marine Alternators & Motors Market Volume Size & Forecast,‘000 Units by Distribution Channel 2016-2026
Table 146 : Taiwan Marine Alternators & Motors Market Value Size & Forecast, US$ Mn and ‘000 Units by Distribution Channel 2016-2026
Table 147 : Middle East and Africa Marine Alternators & Motors Market Volume Size & Forecast,‘000 Units by Product 2016-2026
Table 148 : Middle East and Africa Marine Alternators & Motors Market Value Size & Forecast, US$ Mn and ‘000 Units by Product 2016-2026
Table 149 : Middle East and Africa Marine Alternators & Motors Market Volume Size & Forecast,‘000 Units by Capacity 2016-2026
Table 150 : Middle East and Africa Marine Alternators & Motors Market Value Size & Forecast, US$ Mn and ‘000 Units by Capacity 2016-2026
Table 151 : Middle East and Africa Marine Alternators & Motors Market Volume Size & Forecast,‘000 Units by Distribution Channel 2016-2026
Table 152 : Middle East and Africa Marine Alternators & Motors Market Value Size & Forecast, US$ Mn and ‘000 Units by Distribution Channel 2016-2026
Table 153 : Middle East and Africa Marine Alternators & Motors Market Volume Size & Forecast,‘000 Units by Country 2016-2026
Table 154 : Middle East and Africa Marine Alternators & Motors Market Value Size & Forecast, US$ Mn and ‘000 Units by Country 2016-2026
Table 155 : GCC Marine Alternators & Motors Market Volume Size & Forecast,‘000 Units by Product 2016-2026
Table 156 : GCC Marine Alternators & Motors Market Value Size & Forecast, US$ Mn and ‘000 Units by Product 2016-2026
Table 157 : GCC Marine Alternators & Motors Market Volume Size & Forecast,‘000 Units by Capacity 2016-2026
Table 158 : GCC Marine Alternators & Motors Market Value Size & Forecast, US$ Mn and ‘000 Units by Capacity 2016-2026
Table 159 : GCC Marine Alternators & Motors Market Volume Size & Forecast,‘000 Units by Distribution Channel 2016-2026
Table 160 : GCC Marine Alternators & Motors Market Value Size & Forecast, US$ Mn and ‘000 Units by Distribution Channel 2016-2026
Table 161 : North Africa Marine Alternators & Motors Market Volume Size & Forecast,‘000 Units by Product 2016-2026
Table 162 : North Africa Marine Alternators & Motors Market Value Size & Forecast, US$ Mn and ‘000 Units by Product 2016-2026
Table 163 : North Africa Marine Alternators & Motors Market Volume Size & Forecast,‘000 Units by Capacity 2016-2026
Table 164 : North Africa Marine Alternators & Motors Market Value Size & Forecast, US$ Mn and ‘000 Units by Capacity 2016-2026
Table 165 : North Africa Marine Alternators & Motors Market Volume Size & Forecast,‘000 Units by Distribution Channel 2016-2026
Table 166 : North Africa Marine Alternators & Motors Market Value Size & Forecast, US$ Mn and ‘000 Units by Distribution Channel 2016-2026
Table 167 : South Africa Marine Alternators & Motors Market Volume Size & Forecast,‘000 Units by Product 2016-2026
Table 168 : South Africa Marine Alternators & Motors Market Value Size & Forecast, US$ Mn and ‘000 Units by Product 2016-2026
Table 169 : South Africa Marine Alternators & Motors Market Volume Size & Forecast,‘000 Units by Capacity 2016-2026
Table 170 : South Africa Marine Alternators & Motors Market Value Size & Forecast, US$ Mn and ‘000 Units by Capacity 2016-2026
Table 171 : South Africa Marine Alternators & Motors Market Volume Size & Forecast,‘000 Units by Distribution Channel 2016-2026
Table 172 : South Africa Marine Alternators & Motors Market Value Size & Forecast, US$ Mn and ‘000 Units by Distribution Channel 2016-2026
Table 173 : South America Marine Alternators & Motors Market Volume Size & Forecast,‘000 Units by Product 2016-2026
Table 174 : South America Marine Alternators & Motors Market Value Size & Forecast, US$ Mn and ‘000 Units by Product 2016-2026
Table 175 : South America Marine Alternators & Motors Market Volume Size & Forecast,‘000 Units by Capacity 2016-2026
Table 176 : South America Marine Alternators & Motors Market Value Size & Forecast, US$ Mn and ‘000 Units by Capacity 2016-2026
Table 177 : South America Marine Alternators & Motors Market Volume Size & Forecast,‘000 Units by Distribution Channel 2016-2026
Table 178 : South America Marine Alternators & Motors Market Value Size & Forecast, US$ Mn and ‘000 Units by Distribution Channel 2016-2026
Table 179 : South America Marine Alternators & Motors Market Volume Size & Forecast,‘000 Units by Country 2016-2026
Table 180 : South America Marine Alternators & Motors Market Value Size & Forecast, US$ Mn and ‘000 Units by Country 2016-2026
Table 181 : Brazil Marine Alternators & Motors Market Volume Size & Forecast,‘000 Units by Product 2016-2026
Table 182 : Brazil Marine Alternators & Motors Market Value Size & Forecast, US$ Mn and ‘000 Units by Product 2016-2026
Table 183 : Brazil Marine Alternators & Motors Market Volume Size & Forecast,‘000 Units by Capacity 2016-2026
Table 184 : Brazil Marine Alternators & Motors Market Value Size & Forecast, US$ Mn and ‘000 Units by Capacity 2016-2026
Table 185 : Brazil Marine Alternators & Motors Market Volume Size & Forecast,‘000 Units by Distribution Channel 2016-2026
Table 186 : Brazil Marine Alternators & Motors Market Value Size & Forecast, US$ Mn and ‘000 Units by Distribution Channel 2016-2026
List of Figures
Figure 2 : Global Marine Alternators & Motors Market Projections by Alternator, US$ Mn and ‘000 Units by Product, 2012-2027
Figure 3 : Global Marine Alternators & Motors Market Projections by Motor, ‘000 Units by Product, 2012-2027
Figure 4 : Global Marine Alternators & Motors Market Projections by Motor, US$ Mn and ‘000 Units by Product, 2012-2026
Figure 5 : Global Marine Alternators & Motors Market Projections by Alternator, ‘000 Units by Capacity 2012-2027
Figure 6 : Global Marine Alternators & Motors Market Projections by Alternator, US$ Mn and ‘000 Units by Capacity 2012-2027
Figure 7 : Global Marine Alternators & Motors Market Projections by Motor, ‘000 Units by Capacity 2012-2026
Figure 8 : Global Marine Alternators & Motors Market Projections by Motor, US$ Mn and ‘000 Units by Capacity 2012-2027
Figure 9 : Global Marine Alternators & Motors Market Projections, ‘000 Units by Distribution Channel 2012-2027
Figure 10 : Global Marine Alternators & Motors Market Projections, US$ Mn and ‘000 Units by Distribution Channel 2012-2027
Figure 11 : Global Marine Alternators & Motors Market Projections, ‘000 Units by Region 2012-2026
Figure 12 : Global Marine Alternators & Motors Market Projections, US$ Mn and ‘000 Units by Region 2012-2027
Figure 13 : North America Marine Alternators & Motors Market Projections by Alternator, ‘000 Units by Product, 2012-2026
Figure 14 : North America Marine Alternators & Motors Market Projections by Alternator, US$ Mn and ‘000 Units by Product, 2012-2027
Figure 15 : North America Marine Alternators & Motors Market Projections by Motor, ‘000 Units by Product, 2012-2027
Figure 16 : North America Marine Alternators & Motors Market Projections by Motor, US$ Mn and ‘000 Units by Product, 2012-2026
Figure 17 : North America Marine Alternators & Motors Market Projections by Alternator, ‘000 Units by Capacity 2012-2027
Figure 18 : North America Marine Alternators & Motors Market Projections by Alternator, US$ Mn and ‘000 Units by Capacity 2012-2027
Figure 19 : North America Marine Alternators & Motors Market Projections by Motor, ‘000 Units by Capacity 2012-2026
Figure 20 : North America Marine Alternators & Motors Market Projections by Motor, US$ Mn and ‘000 Units by Capacity 2012-2027
Figure 21 : North America Marine Alternators & Motors Market Projections, ‘000 Units by Distribution Channel 2012-2027
Figure 22 : North America Marine Alternators & Motors Market Projections, US$ Mn and ‘000 Units by Distribution Channel 2012-2027
Figure 23 : North America Marine Alternators & Motors Market Projections, ‘000 Units by Region 2012-2026
Figure 24 : North America Marine Alternators & Motors Market Projections, US$ Mn and ‘000 Units by Region 2012-2027
Figure 25 : U.S. Marine Alternators & Motors Market Projections by Alternator, ‘000 Units by Product, 2012-2026
Figure 26 : U.S. Marine Alternators & Motors Market Projections by Alternator, US$ Mn and ‘000 Units by Product, 2012-2027
Figure 27 : U.S. Marine Alternators & Motors Market Projections by Motor, ‘000 Units by Product, 2012-2027
Figure 28 : U.S. Marine Alternators & Motors Market Projections by Motor, US$ Mn and ‘000 Units by Product, 2012-2026
Figure 29 : U.S. Marine Alternators & Motors Market Projections by Alternator, ‘000 Units by Capacity 2012-2027
Figure 30 : U.S. Marine Alternators & Motors Market Projections by Alternator, US$ Mn and ‘000 Units by Capacity 2012-2027
Figure 31 : U.S. Marine Alternators & Motors Market Projections by Motor, ‘000 Units by Capacity 2012-2026
Figure 32 : U.S. Marine Alternators & Motors Market Projections by Motor, US$ Mn and ‘000 Units by Capacity 2012-2027
Figure 33 : U.S. Marine Alternators & Motors Market Projections, ‘000 Units by Distribution Channel 2012-2027
Figure 34 : U.S. Marine Alternators & Motors Market Projections, US$ Mn and ‘000 Units by Distribution Channel 2012-2027
Figure 35 : Canada Marine Alternators & Motors Market Projections by Alternator, ‘000 Units by Product, 2012-2026
Figure 36 : Canada Marine Alternators & Motors Market Projections by Alternator, US$ Mn and ‘000 Units by Product, 2012-2027
Figure 37 : Canada Marine Alternators & Motors Market Projections by Motor, ‘000 Units by Product, 2012-2027
Figure 38 : Canada Marine Alternators & Motors Market Projections by Motor, US$ Mn and ‘000 Units by Product, 2012-2026
Figure 39 : Canada Marine Alternators & Motors Market Projections by Alternator, ‘000 Units by Capacity 2012-2027
Figure 40 : Canada Marine Alternators & Motors Market Projections by Alternator, US$ Mn and ‘000 Units by Capacity 2012-2027
Figure 41 : Canada Marine Alternators & Motors Market Projections by Motor, ‘000 Units by Capacity 2012-2026
Figure 42 : Canada Marine Alternators & Motors Market Projections by Motor, US$ Mn and ‘000 Units by Capacity 2012-2027
Figure 43 : Canada Marine Alternators & Motors Market Projections, ‘000 Units by Distribution Channel 2012-2027
Figure 44 : Canada Marine Alternators & Motors Market Projections, US$ Mn and ‘000 Units by Distribution Channel 2012-2027
Figure 45 : Europe Marine Alternators & Motors Market Projections by Alternator, ‘000 Units by Product, 2012-2026
Figure 46 : Europe Marine Alternators & Motors Market Projections by Alternator, US$ Mn and ‘000 Units by Product, 2012-2027
Figure 47 : Europe Marine Alternators & Motors Market Projections by Motor, ‘000 Units by Product, 2012-2027
Figure 48 : Europe Marine Alternators & Motors Market Projections by Motor, US$ Mn and ‘000 Units by Product, 2012-2026
Figure 49 : Europe Marine Alternators & Motors Market Projections by Alternator, ‘000 Units by Capacity 2012-2027
Figure 50 : Europe Marine Alternators & Motors Market Projections by Alternator, US$ Mn and ‘000 Units by Capacity 2012-2027
Figure 51 : Europe Marine Alternators & Motors Market Projections by Motor, ‘000 Units by Capacity 2012-2026
Figure 52 : Europe Marine Alternators & Motors Market Projections by Motor, US$ Mn and ‘000 Units by Capacity 2012-2027
Figure 53 : Europe Marine Alternators & Motors Market Projections, ‘000 Units by Distribution Channel 2012-2027
Figure 54 : Europe Marine Alternators & Motors Market Projections, US$ Mn and ‘000 Units by Distribution Channel 2012-2027
Figure 55 : Europe Marine Alternators & Motors Market Projections, ‘000 Units by Region 2012-2026
Figure 56 : Europe Marine Alternators & Motors Market Projections, US$ Mn and ‘000 Units by Region 2012-2027
Figure 57 : Germany Marine Alternators & Motors Market Projections by Alternator, ‘000 Units by Product, 2012-2026
Figure 58 : Germany Marine Alternators & Motors Market Projections by Alternator, US$ Mn and ‘000 Units by Product, 2012-2027
Figure 59 : Germany Marine Alternators & Motors Market Projections by Motor, ‘000 Units by Product, 2012-2027
Figure 60 : Germany Marine Alternators & Motors Market Projections by Motor, US$ Mn and ‘000 Units by Product, 2012-2026
Figure 61 : Germany Marine Alternators & Motors Market Projections by Alternator, ‘000 Units by Capacity 2012-2027
Figure 62 : Germany Marine Alternators & Motors Market Projections by Alternator, US$ Mn and ‘000 Units by Capacity 2012-2027
Figure 63 : Germany Marine Alternators & Motors Market Projections by Motor, ‘000 Units by Capacity 2012-2026
Figure 64 : Germany Marine Alternators & Motors Market Projections by Motor, US$ Mn and ‘000 Units by Capacity 2012-2027
Figure 65 : Germany Marine Alternators & Motors Market Projections, ‘000 Units by Distribution Channel 2012-2027
Figure 66 : Germany Marine Alternators & Motors Market Projections, US$ Mn and ‘000 Units by Distribution Channel 2012-2027
Figure 67 : U.K. Marine Alternators & Motors Market Projections by Alternator, ‘000 Units by Product, 2012-2026
Figure 68 : U.K. Marine Alternators & Motors Market Projections by Alternator, US$ Mn and ‘000 Units by Product, 2012-2027
Figure 69 : U.K. Marine Alternators & Motors Market Projections by Motor, ‘000 Units by Product, 2012-2027
Figure 70 : U.K. Marine Alternators & Motors Market Projections by Motor, US$ Mn and ‘000 Units by Product, 2012-2026
Figure 71 : U.K. Marine Alternators & Motors Market Projections by Alternator, ‘000 Units by Capacity 2012-2027
Figure 72 : U.K. Marine Alternators & Motors Market Projections by Alternator, US$ Mn and ‘000 Units by Capacity 2012-2027
Figure 73 : U.K. Marine Alternators & Motors Market Projections by Motor, ‘000 Units by Capacity 2012-2026
Figure 74 : U.K. Marine Alternators & Motors Market Projections by Motor, US$ Mn and ‘000 Units by Capacity 2012-2027
Figure 75 : U.K. Marine Alternators & Motors Market Projections, ‘000 Units by Distribution Channel 2012-2027
Figure 76 : U.K. Marine Alternators & Motors Market Projections, US$ Mn and ‘000 Units by Distribution Channel 2012-2027
Figure 77 : France Marine Alternators & Motors Market Projections by Alternator, ‘000 Units by Product, 2012-2026
Figure 78 : France Marine Alternators & Motors Market Projections by Alternator, US$ Mn and ‘000 Units by Product, 2012-2027
Figure 79 : France Marine Alternators & Motors Market Projections by Motor, ‘000 Units by Product, 2012-2027
Figure 80 : France Marine Alternators & Motors Market Projections by Motor, US$ Mn and ‘000 Units by Product, 2012-2026
Figure 81 : France Marine Alternators & Motors Market Projections by Alternator, ‘000 Units by Capacity 2012-2027
Figure 82 : France Marine Alternators & Motors Market Projections by Alternator, US$ Mn and ‘000 Units by Capacity 2012-2027
Figure 83 : France Marine Alternators & Motors Market Projections by Motor, ‘000 Units by Capacity 2012-2026
Figure 84 : France Marine Alternators & Motors Market Projections by Motor, US$ Mn and ‘000 Units by Capacity 2012-2027
Figure 85 : France Marine Alternators & Motors Market Projections, ‘000 Units by Distribution Channel 2012-2027
Figure 86 : France Marine Alternators & Motors Market Projections, US$ Mn and ‘000 Units by Distribution Channel 2012-2027
Figure 87 : Italy Marine Alternators & Motors Market Projections by Alternator, ‘000 Units by Product, 2012-2026
Figure 88 : Italy Marine Alternators & Motors Market Projections by Alternator, US$ Mn and ‘000 Units by Product, 2012-2027
Figure 89 : Italy Marine Alternators & Motors Market Projections by Motor, ‘000 Units by Product, 2012-2027
Figure 90 : Italy Marine Alternators & Motors Market Projections by Motor, US$ Mn and ‘000 Units by Product, 2012-2026
Figure 91 : Italy Marine Alternators & Motors Market Projections by Alternator, ‘000 Units by Capacity 2012-2027
Figure 92 : Italy Marine Alternators & Motors Market Projections by Alternator, US$ Mn and ‘000 Units by Capacity 2012-2027
Figure 93 : Italy Marine Alternators & Motors Market Projections by Motor, ‘000 Units by Capacity 2012-2026
Figure 94 : Italy Marine Alternators & Motors Market Projections by Motor, US$ Mn and ‘000 Units by Capacity 2012-2027
Figure 95 : Italy Marine Alternators & Motors Market Projections, ‘000 Units by Distribution Channel 2012-2027
Figure 96 : Italy Marine Alternators & Motors Market Projections, US$ Mn and ‘000 Units by Distribution Channel 2012-2027
Figure 97 : Spain Marine Alternators & Motors Market Projections by Alternator, ‘000 Units by Product, 2012-2026
Figure 98 : Spain Marine Alternators & Motors Market Projections by Alternator, US$ Mn and ‘000 Units by Product, 2012-2027
Figure 99 : Spain Marine Alternators & Motors Market Projections by Motor, ‘000 Units by Product, 2012-2027
Figure 100 : Spain Marine Alternators & Motors Market Projections by Motor, US$ Mn and ‘000 Units by Product, 2012-2026
Figure 101 : Spain Marine Alternators & Motors Market Projections by Alternator, ‘000 Units by Capacity 2012-2027
Figure 102 : Spain Marine Alternators & Motors Market Projections by Alternator, US$ Mn and ‘000 Units by Capacity 2012-2027
Figure 103 : Spain Marine Alternators & Motors Market Projections by Motor, ‘000 Units by Capacity 2012-2026
Figure 104 : Spain Marine Alternators & Motors Market Projections by Motor, US$ Mn and ‘000 Units by Capacity 2012-2027
Figure 105 : Spain Marine Alternators & Motors Market Projections, ‘000 Units by Distribution Channel 2012-2027
Figure 106 : Spain Marine Alternators & Motors Market Projections, US$ Mn and ‘000 Units by Distribution Channel 2012-2027
Figure 107 : Portugal Marine Alternators & Motors Market Projections by Alternator, ‘000 Units by Product, 2012-2026
Figure 108 : Portugal Marine Alternators & Motors Market Projections by Alternator, US$ Mn and ‘000 Units by Product, 2012-2027
Figure 109 : Portugal Marine Alternators & Motors Market Projections by Motor, ‘000 Units by Product, 2012-2027
Figure 110 : Portugal Marine Alternators & Motors Market Projections by Motor, US$ Mn and ‘000 Units by Product, 2012-2026
Figure 111 : Portugal Marine Alternators & Motors Market Projections by Alternator, ‘000 Units by Capacity 2012-2027
Figure 112 : Portugal Marine Alternators & Motors Market Projections by Alternator, US$ Mn and ‘000 Units by Capacity 2012-2027
Figure 113 : Portugal Marine Alternators & Motors Market Projections by Motor, ‘000 Units by Capacity 2012-2026
Figure 114 : Portugal Marine Alternators & Motors Market Projections by Motor, US$ Mn and ‘000 Units by Capacity 2012-2027
Figure 115 : Portugal Marine Alternators & Motors Market Projections, ‘000 Units by Distribution Channel 2012-2027
Figure 116 : Portugal Marine Alternators & Motors Market Projections, US$ Mn and ‘000 Units by Distribution Channel 2012-2027
Figure 117 : Scandinavia Marine Alternators & Motors Market Projections by Alternator, ‘000 Units by Product, 2012-2026
Figure 118 : Scandinavia Marine Alternators & Motors Market Projections by Alternator, US$ Mn and ‘000 Units by Product, 2012-2027
Figure 119 : Scandinavia Marine Alternators & Motors Market Projections by Motor, ‘000 Units by Product, 2012-2027
Figure 120 : Scandinavia Marine Alternators & Motors Market Projections by Motor, US$ Mn and ‘000 Units by Product, 2012-2026
Figure 121 : Scandinavia Marine Alternators & Motors Market Projections by Alternator, ‘000 Units by Capacity 2012-2027
Figure 122 : Scandinavia Marine Alternators & Motors Market Projections by Alternator, US$ Mn and ‘000 Units by Capacity 2012-2027
Figure 123 : Scandinavia Marine Alternators & Motors Market Projections by Motor, ‘000 Units by Capacity 2012-2026
Figure 124 : Scandinavia Marine Alternators & Motors Market Projections by Motor, US$ Mn and ‘000 Units by Capacity 2012-2027
Figure 125 : Scandinavia Marine Alternators & Motors Market Projections, ‘000 Units by Distribution Channel 2012-2027
Figure 126 : Scandinavia Marine Alternators & Motors Market Projections, US$ Mn and ‘000 Units by Distribution Channel 2012-2027
Figure 127 : Balkans Marine Alternators & Motors Market Projections by Alternator, ‘000 Units by Product, 2012-2026
Figure 128 : Balkans Marine Alternators & Motors Market Projections by Alternator, US$ Mn and ‘000 Units by Product, 2012-2027
Figure 129 : Balkans Marine Alternators & Motors Market Projections by Motor, ‘000 Units by Product, 2012-2027
Figure 130 : Balkans Marine Alternators & Motors Market Projections by Motor, US$ Mn and ‘000 Units by Product, 2012-2026
Figure 131 : Balkans Marine Alternators & Motors Market Projections by Alternator, ‘000 Units by Capacity 2012-2027
Figure 132 : Balkans Marine Alternators & Motors Market Projections by Alternator, US$ Mn and ‘000 Units by Capacity 2012-2027
Figure 133 : Balkans Marine Alternators & Motors Market Projections by Motor, ‘000 Units by Capacity 2012-2026
Figure 134 : Balkans Marine Alternators & Motors Market Projections by Motor, US$ Mn and ‘000 Units by Capacity 2012-2027
Figure 135 : Balkans Marine Alternators & Motors Market Projections, ‘000 Units by Distribution Channel 2012-2027
Figure 136 : Balkans Marine Alternators & Motors Market Projections, US$ Mn and ‘000 Units by Distribution Channel 2012-2027
Figure 137 : Asia Pacific Marine Alternators & Motors Market Projections by Alternator, ‘000 Units by Product, 2012-2026
Figure 138 : Asia Pacific Marine Alternators & Motors Market Projections by Alternator, US$ Mn and ‘000 Units by Product, 2012-2027
Figure 139 : Asia Pacific Marine Alternators & Motors Market Projections by Motor, ‘000 Units by Product, 2012-2027
Figure 140 : Asia Pacific Marine Alternators & Motors Market Projections by Motor, US$ Mn and ‘000 Units by Product, 2012-2026
Figure 141 : Asia Pacific Marine Alternators & Motors Market Projections by Alternator, ‘000 Units by Capacity 2012-2027
Figure 142 : Asia Pacific Marine Alternators & Motors Market Projections by Alternator, US$ Mn and ‘000 Units by Capacity 2012-2027
Figure 143 : Asia Pacific Marine Alternators & Motors Market Projections by Motor, ‘000 Units by Capacity 2012-2026
Figure 144 : Asia Pacific Marine Alternators & Motors Market Projections by Motor, US$ Mn and ‘000 Units by Capacity 2012-2027
Figure 145 : Asia Pacific Marine Alternators & Motors Market Projections, ‘000 Units by Distribution Channel 2012-2027
Figure 146 : Asia Pacific Marine Alternators & Motors Market Projections, US$ Mn and ‘000 Units by Distribution Channel 2012-2027
Figure 147 : Asia Pacific Marine Alternators & Motors Market Projections, ‘000 Units by Region 2012-2026
Figure 148 : Asia Pacific Marine Alternators & Motors Market Projections, US$ Mn and ‘000 Units by Region 2012-2027
Figure 149 : China Marine Alternators & Motors Market Projections by Alternator, ‘000 Units by Product, 2012-2026
Figure 150 : China Marine Alternators & Motors Market Projections by Alternator, US$ Mn and ‘000 Units by Product, 2012-2027
Figure 151 : China Marine Alternators & Motors Market Projections by Motor, ‘000 Units by Product, 2012-2027
Figure 152 : China Marine Alternators & Motors Market Projections by Motor, US$ Mn and ‘000 Units by Product, 2012-2026
Figure 153 : China Marine Alternators & Motors Market Projections by Alternator, ‘000 Units by Capacity 2012-2027
Figure 154 : China Marine Alternators & Motors Market Projections by Alternator, US$ Mn and ‘000 Units by Capacity 2012-2027
Figure 155 : China Marine Alternators & Motors Market Projections by Motor, ‘000 Units by Capacity 2012-2026
Figure 156 : China Marine Alternators & Motors Market Projections by Motor, US$ Mn and ‘000 Units by Capacity 2012-2027
Figure 157 : China Marine Alternators & Motors Market Projections, ‘000 Units by Distribution Channel 2012-2027
Figure 158 : China Marine Alternators & Motors Market Projections, US$ Mn and ‘000 Units by Distribution Channel 2012-2027
Figure 159 : Japan Marine Alternators & Motors Market Projections by Alternator, ‘000 Units by Product, 2012-2026
Figure 160 : Japan Marine Alternators & Motors Market Projections by Alternator, US$ Mn and ‘000 Units by Product, 2012-2027
Figure 161 : Japan Marine Alternators & Motors Market Projections by Motor, ‘000 Units by Product, 2012-2027
Figure 162 : Japan Marine Alternators & Motors Market Projections by Motor, US$ Mn and ‘000 Units by Product, 2012-2026
Figure 163 : Japan Marine Alternators & Motors Market Projections by Alternator, ‘000 Units by Capacity 2012-2027
Figure 164 : Japan Marine Alternators & Motors Market Projections by Alternator, US$ Mn and ‘000 Units by Capacity 2012-2027
Figure 165 : Japan Marine Alternators & Motors Market Projections by Motor, ‘000 Units by Capacity 2012-2026
Figure 166 : Japan Marine Alternators & Motors Market Projections by Motor, US$ Mn and ‘000 Units by Capacity 2012-2027
Figure 167 : Japan Marine Alternators & Motors Market Projections, ‘000 Units by Distribution Channel 2012-2027
Figure 168 : Japan Marine Alternators & Motors Market Projections, US$ Mn and ‘000 Units by Distribution Channel 2012-2027
Figure 169 : India Marine Alternators & Motors Market Projections by Alternator, ‘000 Units by Product, 2012-2026
Figure 170 : India Marine Alternators & Motors Market Projections by Alternator, US$ Mn and ‘000 Units by Product, 2012-2027
Figure 171 : India Marine Alternators & Motors Market Projections by Motor, ‘000 Units by Product, 2012-2027
Figure 172 : India Marine Alternators & Motors Market Projections by Motor, US$ Mn and ‘000 Units by Product, 2012-2026
Figure 173 : India Marine Alternators & Motors Market Projections by Alternator, ‘000 Units by Capacity 2012-2027
Figure 174 : India Marine Alternators & Motors Market Projections by Alternator, US$ Mn and ‘000 Units by Capacity 2012-2027
Figure 175 : India Marine Alternators & Motors Market Projections by Motor, ‘000 Units by Capacity 2012-2026
Figure 176 : India Marine Alternators & Motors Market Projections by Motor, US$ Mn and ‘000 Units by Capacity 2012-2027
Figure 177 : India Marine Alternators & Motors Market Projections, ‘000 Units by Distribution Channel 2012-2027
Figure 178 : India Marine Alternators & Motors Market Projections, US$ Mn and ‘000 Units by Distribution Channel 2012-2027
Figure 179 : Australia Marine Alternators & Motors Market Projections by Alternator, ‘000 Units by Product, 2012-2026
Figure 180 : Australia Marine Alternators & Motors Market Projections by Alternator, US$ Mn and ‘000 Units by Product, 2012-2027
Figure 181 : Australia Marine Alternators & Motors Market Projections by Motor, ‘000 Units by Product, 2012-2027
Figure 182 : Australia Marine Alternators & Motors Market Projections by Motor, US$ Mn and ‘000 Units by Product, 2012-2026
Figure 183 : Australia Marine Alternators & Motors Market Projections by Alternator, ‘000 Units by Capacity 2012-2027
Figure 184 : Australia Marine Alternators & Motors Market Projections by Alternator, US$ Mn and ‘000 Units by Capacity 2012-2027
Figure 185 : Australia Marine Alternators & Motors Market Projections by Motor, ‘000 Units by Capacity 2012-2026
Figure 186 : Australia Marine Alternators & Motors Market Projections by Motor, US$ Mn and ‘000 Units by Capacity 2012-2027
Figure 187 : Australia Marine Alternators & Motors Market Projections, ‘000 Units by Distribution Channel 2012-2027
Figure 188 : Australia Marine Alternators & Motors Market Projections, US$ Mn and ‘000 Units by Distribution Channel 2012-2027
Figure 189 : Korea Marine Alternators & Motors Market Projections by Alternator, ‘000 Units by Product, 2012-2026
Figure 190 : Korea Marine Alternators & Motors Market Projections by Alternator, US$ Mn and ‘000 Units by Product, 2012-2027
Figure 191 : Korea Marine Alternators & Motors Market Projections by Motor, ‘000 Units by Product, 2012-2027
Figure 192 : Korea Marine Alternators & Motors Market Projections by Motor, US$ Mn and ‘000 Units by Product, 2012-2026
Figure 193 : Korea Marine Alternators & Motors Market Projections by Alternator, ‘000 Units by Capacity 2012-2027
Figure 194 : Korea Marine Alternators & Motors Market Projections by Alternator, US$ Mn and ‘000 Units by Capacity 2012-2027
Figure 195 : Korea Marine Alternators & Motors Market Projections by Motor, ‘000 Units by Capacity 2012-2026
Figure 196 : Korea Marine Alternators & Motors Market Projections by Motor, US$ Mn and ‘000 Units by Capacity 2012-2027
Figure 197 : Korea Marine Alternators & Motors Market Projections, ‘000 Units by Distribution Channel 2012-2027
Figure 198 : Korea Marine Alternators & Motors Market Projections, US$ Mn and ‘000 Units by Distribution Channel 2012-2027
Figure 199 : Vietnam Marine Alternators & Motors Market Projections by Alternator, ‘000 Units by Product, 2012-2026
Figure 200 : Vietnam Marine Alternators & Motors Market Projections by Alternator, US$ Mn and ‘000 Units by Product, 2012-2027
Figure 201 : Vietnam Marine Alternators & Motors Market Projections by Motor, ‘000 Units by Product, 2012-2027
Figure 202 : Vietnam Marine Alternators & Motors Market Projections by Motor, US$ Mn and ‘000 Units by Product, 2012-2026
Figure 203 : Vietnam Marine Alternators & Motors Market Projections by Alternator, ‘000 Units by Capacity 2012-2027
Figure 204 : Vietnam Marine Alternators & Motors Market Projections by Alternator, US$ Mn and ‘000 Units by Capacity 2012-2027
Figure 205 : Vietnam Marine Alternators & Motors Market Projections by Motor, ‘000 Units by Capacity 2012-2026
Figure 206 : Vietnam Marine Alternators & Motors Market Projections by Motor, US$ Mn and ‘000 Units by Capacity 2012-2027
Figure 207 : Vietnam Marine Alternators & Motors Market Projections, ‘000 Units by Distribution Channel 2012-2027
Figure 208 : Vietnam Marine Alternators & Motors Market Projections, US$ Mn and ‘000 Units by Distribution Channel 2012-2027
Figure 209 : Philippines Marine Alternators & Motors Market Projections by Alternator, ‘000 Units by Product, 2012-2026
Figure 210 : Philippines Marine Alternators & Motors Market Projections by Alternator, US$ Mn and ‘000 Units by Product, 2012-2027
Figure 211 : Philippines Marine Alternators & Motors Market Projections by Motor, ‘000 Units by Product, 2012-2027
Figure 212 : Philippines Marine Alternators & Motors Market Projections by Motor, US$ Mn and ‘000 Units by Product, 2012-2026
Figure 213 : Philippines Marine Alternators & Motors Market Projections by Alternator, ‘000 Units by Capacity 2012-2027
Figure 214 : Philippines Marine Alternators & Motors Market Projections by Alternator, US$ Mn and ‘000 Units by Capacity 2012-2027
Figure 215 : Philippines Marine Alternators & Motors Market Projections by Motor, ‘000 Units by Capacity 2012-2026
Figure 216 : Philippines Marine Alternators & Motors Market Projections by Motor, US$ Mn and ‘000 Units by Capacity 2012-2027
Figure 217 : Philippines Marine Alternators & Motors Market Projections, ‘000 Units by Distribution Channel 2012-2027
Figure 218 : Philippines Marine Alternators & Motors Market Projections, US$ Mn and ‘000 Units by Distribution Channel 2012-2027
Figure 219 : Malaysia Marine Alternators & Motors Market Projections by Alternator, ‘000 Units by Product, 2012-2026
Figure 220 : Malaysia Marine Alternators & Motors Market Projections by Alternator, US$ Mn and ‘000 Units by Product, 2012-2027
Figure 221 : Malaysia Marine Alternators & Motors Market Projections by Motor, ‘000 Units by Product, 2012-2027
Figure 222 : Malaysia Marine Alternators & Motors Market Projections by Motor, US$ Mn and ‘000 Units by Product, 2012-2026
Figure 223 : Malaysia Marine Alternators & Motors Market Projections by Alternator, ‘000 Units by Capacity 2012-2027
Figure 224 : Malaysia Marine Alternators & Motors Market Projections by Alternator, US$ Mn and ‘000 Units by Capacity 2012-2027
Figure 225 : Malaysia Marine Alternators & Motors Market Projections by Motor, ‘000 Units by Capacity 2012-2026
Figure 226 : Malaysia Marine Alternators & Motors Market Projections by Motor, US$ Mn and ‘000 Units by Capacity 2012-2027
Figure 227 : Malaysia Marine Alternators & Motors Market Projections, ‘000 Units by Distribution Channel 2012-2027
Figure 228 : Malaysia Marine Alternators & Motors Market Projections, US$ Mn and ‘000 Units by Distribution Channel 2012-2027
Figure 229 : Taiwan Marine Alternators & Motors Market Projections by Alternator, ‘000 Units by Product, 2012-2026
Figure 230 : Taiwan Marine Alternators & Motors Market Projections by Alternator, US$ Mn and ‘000 Units by Product, 2012-2027
Figure 231 : Taiwan Marine Alternators & Motors Market Projections by Motor, ‘000 Units by Product, 2012-2027
Figure 232 : Taiwan Marine Alternators & Motors Market Projections by Motor, US$ Mn and ‘000 Units by Product, 2012-2026
Figure 233 : Taiwan Marine Alternators & Motors Market Projections by Alternator, ‘000 Units by Capacity 2012-2027
Figure 234 : Taiwan Marine Alternators & Motors Market Projections by Alternator, US$ Mn and ‘000 Units by Capacity 2012-2027
Figure 235 : Taiwan Marine Alternators & Motors Market Projections by Motor, ‘000 Units by Capacity 2012-2026
Figure 236 : Taiwan Marine Alternators & Motors Market Projections by Motor, US$ Mn and ‘000 Units by Capacity 2012-2027
Figure 237 : Taiwan Marine Alternators & Motors Market Projections, ‘000 Units by Distribution Channel 2012-2027
Figure 238 : Taiwan Marine Alternators & Motors Market Projections, US$ Mn and ‘000 Units by Distribution Channel 2012-2027
Figure 239 : Middle East & Africa Marine Alternators & Motors Market Projections by Alternator, ‘000 Units by Product, 2012-2026
Figure 240 : Middle East & Africa Marine Alternators & Motors Market Projections by Alternator, US$ Mn and ‘000 Units by Product, 2012-2027
Figure 241 : Middle East & Africa Marine Alternators & Motors Market Projections by Motor, ‘000 Units by Product, 2012-2027
Figure 242 : Middle East & Africa Marine Alternators & Motors Market Projections by Motor, US$ Mn and ‘000 Units by Product, 2012-2026
Figure 243 : Middle East & Africa Marine Alternators & Motors Market Projections by Alternator, ‘000 Units by Capacity 2012-2027
Figure 244 : Middle East & Africa Marine Alternators & Motors Market Projections by Alternator, US$ Mn and ‘000 Units by Capacity 2012-2027
Figure 245 : Middle East & Africa Marine Alternators & Motors Market Projections by Motor, ‘000 Units by Capacity 2012-2026
Figure 246 : Middle East & Africa Marine Alternators & Motors Market Projections by Motor, US$ Mn and ‘000 Units by Capacity 2012-2027
Figure 247 : Middle East & Africa Marine Alternators & Motors Market Projections, ‘000 Units by Distribution Channel 2012-2027
Figure 248 : Middle East & Africa Marine Alternators & Motors Market Projections, US$ Mn and ‘000 Units by Distribution Channel 2012-2027
Figure 249 : Middle East & Africa Marine Alternators & Motors Market Projections, ‘000 Units by Region 2012-2026
Figure 250 : Middle East & Africa Marine Alternators & Motors Market Projections, US$ Mn and ‘000 Units by Region 2012-2027
Figure 251 : GCC Marine Alternators & Motors Market Projections by Alternator, ‘000 Units by Product, 2012-2026
Figure 252 : GCC Marine Alternators & Motors Market Projections by Alternator, US$ Mn and ‘000 Units by Product, 2012-2027
Figure 253 : GCC Marine Alternators & Motors Market Projections by Motor, ‘000 Units by Product, 2012-2027
Figure 254 : GCC Marine Alternators & Motors Market Projections by Motor, US$ Mn and ‘000 Units by Product, 2012-2026
Figure 255 : GCC Marine Alternators & Motors Market Projections by Alternator, ‘000 Units by Capacity 2012-2027
Figure 256 : GCC Marine Alternators & Motors Market Projections by Alternator, US$ Mn and ‘000 Units by Capacity 2012-2027
Figure 257 : GCC Marine Alternators & Motors Market Projections by Motor, ‘000 Units by Capacity 2012-2026
Figure 258 : GCC Marine Alternators & Motors Market Projections by Motor, US$ Mn and ‘000 Units by Capacity 2012-2027
Figure 259 : GCC Marine Alternators & Motors Market Projections, ‘000 Units by Distribution Channel 2012-2027
Figure 260 : GCC Marine Alternators & Motors Market Projections, US$ Mn and ‘000 Units by Distribution Channel 2012-2027
Figure 261 : North Africa Marine Alternators & Motors Market Projections by Alternator, ‘000 Units by Product, 2012-2026
Figure 262 : North Africa Marine Alternators & Motors Market Projections by Alternator, US$ Mn and ‘000 Units by Product, 2012-2027
Figure 263 : North Africa Marine Alternators & Motors Market Projections by Motor, ‘000 Units by Product, 2012-2027
Figure 264 : North Africa Marine Alternators & Motors Market Projections by Motor, US$ Mn and ‘000 Units by Product, 2012-2026
Figure 265 : North Africa Marine Alternators & Motors Market Projections by Alternator, ‘000 Units by Capacity 2012-2027
Figure 266 : North Africa Marine Alternators & Motors Market Projections by Alternator, US$ Mn and ‘000 Units by Capacity 2012-2027
Figure 267 : North Africa Marine Alternators & Motors Market Projections by Motor, ‘000 Units by Capacity 2012-2026
Figure 268 : North Africa Marine Alternators & Motors Market Projections by Motor, US$ Mn and ‘000 Units by Capacity 2012-2027
Figure 269 : North Africa Marine Alternators & Motors Market Projections, ‘000 Units by Distribution Channel 2012-2027
Figure 270 : North Africa Marine Alternators & Motors Market Projections, US$ Mn and ‘000 Units by Distribution Channel 2012-2027
Figure 271 : South Africa Marine Alternators & Motors Market Projections by Alternator, ‘000 Units by Product, 2012-2026
Figure 272 : South Africa Marine Alternators & Motors Market Projections by Alternator, US$ Mn and ‘000 Units by Product, 2012-2027
Figure 273 : South Africa Marine Alternators & Motors Market Projections by Motor, ‘000 Units by Product, 2012-2027
Figure 274 : South Africa Marine Alternators & Motors Market Projections by Motor, US$ Mn and ‘000 Units by Product, 2012-2026
Figure 275 : South Africa Marine Alternators & Motors Market Projections by Alternator, ‘000 Units by Capacity 2012-2027
Figure 276 : South Africa Marine Alternators & Motors Market Projections by Alternator, US$ Mn and ‘000 Units by Capacity 2012-2027
Figure 277 : South Africa Marine Alternators & Motors Market Projections by Motor, ‘000 Units by Capacity 2012-2026
Figure 278 : South Africa Marine Alternators & Motors Market Projections by Motor, US$ Mn and ‘000 Units by Capacity 2012-2027
Figure 279 : South Africa Marine Alternators & Motors Market Projections, ‘000 Units by Distribution Channel 2012-2027
Figure 280 : South Africa Marine Alternators & Motors Market Projections, US$ Mn and ‘000 Units by Distribution Channel 2012-2027
Figure 281 : South America Marine Alternators & Motors Market Projections by Alternator, ‘000 Units by Product, 2012-2026
Figure 282 : South America Marine Alternators & Motors Market Projections by Alternator, US$ Mn and ‘000 Units by Product, 2012-2027
Figure 283 : South America Marine Alternators & Motors Market Projections by Motor, ‘000 Units by Product, 2012-2027
Figure 284 : South America Marine Alternators & Motors Market Projections by Motor, US$ Mn and ‘000 Units by Product, 2012-2026
Figure 285 : South America Marine Alternators & Motors Market Projections by Alternator, ‘000 Units by Capacity 2012-2027
Figure 286 : South America Marine Alternators & Motors Market Projections by Alternator, US$ Mn and ‘000 Units by Capacity 2012-2027
Figure 287 : South America Marine Alternators & Motors Market Projections by Motor, ‘000 Units by Capacity 2012-2026
Figure 288 : South America Marine Alternators & Motors Market Projections by Motor, US$ Mn and ‘000 Units by Capacity 2012-2027
Figure 289 : South America Marine Alternators & Motors Market Projections, ‘000 Units by Distribution Channel 2012-2027
Figure 290 : South America Marine Alternators & Motors Market Projections, US$ Mn and ‘000 Units by Distribution Channel 2012-2027
Figure 291 : South America Marine Alternators & Motors Market Projections, ‘000 Units by Region 2012-2026
Figure 292 : South America Marine Alternators & Motors Market Projections, US$ Mn and ‘000 Units by Region 2012-2027
Figure 293 : South Africa Marine Alternators & Motors Market Projections by Alternator, ‘000 Units by Product, 2012-2026
Figure 294 : South Africa Marine Alternators & Motors Market Projections by Alternator, US$ Mn and ‘000 Units by Product, 2012-2027
Figure 295 : South Africa Marine Alternators & Motors Market Projections by Motor, ‘000 Units by Product, 2012-2027
Figure 296 : South Africa Marine Alternators & Motors Market Projections by Motor, US$ Mn and ‘000 Units by Product, 2012-2026
Figure 297 : South Africa Marine Alternators & Motors Market Projections by Alternator, ‘000 Units by Capacity 2012-2027
Figure 298 : South Africa Marine Alternators & Motors Market Projections by Alternator, US$ Mn and ‘000 Units by Capacity 2012-2027
Figure 299 : South Africa Marine Alternators & Motors Market Projections by Motor, ‘000 Units by Capacity 2012-2026
Figure 300 : South Africa Marine Alternators & Motors Market Projections by Motor, US$ Mn and ‘000 Units by Capacity 2012-2027
Figure 301 : South Africa Marine Alternators & Motors Market Projections, ‘000 Units by Distribution Channel 2012-2027
Figure 302 : South Africa Marine Alternators & Motors Market Projections, US$ Mn and ‘000 Units by Distribution Channel 2012-2027
Copyright © Transparency Market Research, Inc. All Rights reserved
Trust Online

Marine Alternators and Motors Market
