Location based virtual reality is a suite of hardware and software components that enable end-users to visualize and experience virtual environment in real-time. Virtual reality includes hardware and software that is required to provide a virtual environment of real or imaginary subject and further interact with it. Demand for location based virtual reality is expected to rise globally, largely due to rising applications in end-use sectors such as healthcare, education, gaming, and media and entertainment.
The location based VR market are expected to expand substantially from 2017 onwards and expand at a moderate pace till 2021, owing to increasing possibilities of application in various end-use sectors such as retail, automotive, gaming etc.. Furthermore, the market is expected to expand toward the latter half of the forecast period (2022–2025), due to extensive adoption of hardware components, such as headsets and glasses, and increasing application of software and services among end-users. The location based VR market is expected to see value generation in commercial sector from year 2019.
The global location based VR market is anticipated to observe growth over the timeframe of analysis. Growth of the market is mainly ascribed to technological progress in the field of virtual reality. There has been a rise in the utilization of VR technology together with the augmented investment in the technology of virtual reality (VR). This factor is estimated to support development of the global location based VR market in the years to come.
There has been an augmented popularity of 360-degree content along with increased deployment of this technology indicates toward widespread acceptance of VR technology. As the popularity grows, it is expected the price of various virtual reality hardware components, such as VR headsets and joysticks will decrease. These factors are likely to work in favor of the growth of the global location based VR market in the near future.
In various sectors, such as entertainment, media, and gaming, the demand for virtual reality technology is rising exponentially. Such high demands for this technology from across industries are estimated to open up new growth opportunities for the global location based VR market in the near future.
Technological progress made in the field of virtual reality technology is triggered by the development in 5D, 4D, and 3D technologies, which has led to considerable advancements in the entertainment industry. Viewers are now able to witness 360-degree content in an all-around view of a scene. VR games support much improved gaming experience as it supports 360-degree content. The popularity of 360-degree is expected to rise as location based VR technology is coming up as one of much sought after mainstream gaming platforms. These factors are estimated to support development of the global location based VR market in the years to come.
The prevalence of Coronavirus has resulted in unprecedented global recession and several companies across the globe have been forced to take strict measures, such as salary deductions, laying off employees, and so on. Several small businesses have shut their operations and manufacturing activities have been brought to a halt. Given such grim situation worldwide, the global location based VR market is likely to witness setback in the next few months to come.
Some of the high investments in the developments of technology were made by technological giants such as QUALCOMM Ventures, Samsung Venture, Oculus, and Google Ventures. These technology giants are trying to create a monopoly in the market through investments and partnering with new emerging startups. The market is estimated to witness similar investment scenario from private venture capitalists and technology giants during the forecast period. Adoption of technology is higher in the gaming, media and entertainment sector, as compared to other sectors in the industry. Current advancements in technology in location based VR are boosting the expectation of end-users to experience virtual surrounding in different applications, irrespective of any location or time. Hardware developers have been introducing or updating location based VR enhancements in the last few years in order to improve user experience.
The global location based VR market has been segmented based on component, end-use, application, technology type, and region. Based on component, the market has been divided into hardware and software. The hardware segment has been further split into head mounted display, head up display, glasses, sensor/input, and camera. Based on end-use, the market has been segregated into amusement park, themed attraction, 4D films, automotive, retail & transport, and healthcare. In terms of application, the location based VR market has been split into entertainment, media, training/ simulation, navigation, sales, and medical. Based on technology type, the market has been classified into 2 Dimensional (2D), 3 Dimensional (3D), and cloud merged reality (CMR). According to the analysis, adoption of 3D and cloud merged reality technologies is expected to be considerably high, as constant developments are being introduced in the market, while the data stored in cloud is easier to fetch, independent of location and time. Therefore, adoption of CMR technology is increasing across all regions. Moreover, adoption of location based VR in the automotive industry is increasing in Europe owing to the presence of a large number of automotive industries in the region. Applications of location based VR is also increasing in the healthcare industry, as patients are advised to play VR games in order to reduce anxiety.
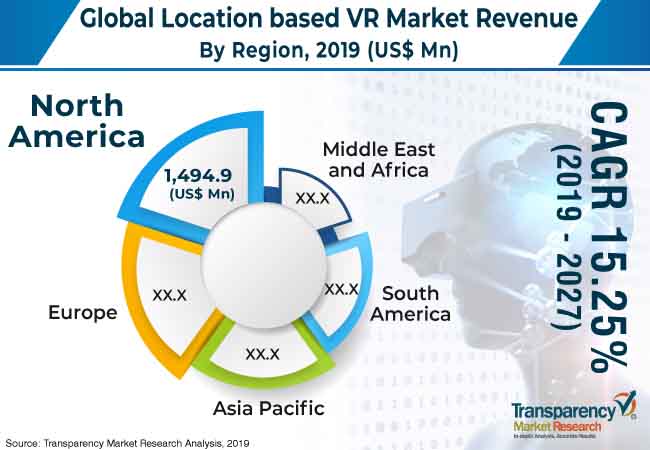
In terms of revenue, North America holds a prominent share of the global location based VR market due to considerable adoption of location based VR in the region, awareness about the technology and technological developments among customers is increasing across the region. Additionally, increasing usage of location based VR across applications such as gaming, media and entertainment is projected to boost the market during the forecast period. Demand for location based VR is rising in Europe and Asia Pacific, due to the increasing number of 4D films, amusement parks, and themed attractions in these regions owing to the rise in young population in these regions. In Europe, companies are implementing advanced customer support solutions, such as chatbots and social media platforms, for continuous interaction and reviews. Furthermore, expansion of manufacturing industries in Asia Pacific is boosting the application of location based VR in the automotive industry in the region.
The research study includes profiles of leading companies operating in the global location based VR market. Key players profiled include Appentus Technologies, BidOn Games Studio, Cortex, Craftars, Google, LLC, HQSoftware, HTC Corporation, Huawei Technologies Co., Ltd., Intel Corporation, MOFABLES, NEXT NOW, INC., Oculus VR, and ScienceSoft USA Corporation.
1. Preface
1.1. Market Scope
1.2. Market Segmentation
1.3. Key Research Objectives
2. Assumptions and Research Methodology
2.1. Market Taxonomy - Segment Definitions
2.2. Research Methodology
2.2.1. List of Primary and Secondary Sources
2.3. Key Assumptions for Data Modelling
3. Executive Summary: Global Location Based VR Market
4. Market Overview
4.1. Introduction
4.2. Global Market – Macro Economic Factors Overview
4.2.1. Global ICT Spending (US$ Mn), 2013, 2019, 2027
4.2.2. Key Regional Socio-Political-Technological Developments and their Impact Considerations
4.3. Market Factor Analysis
4.3.1. Porter’s Five Forces Analysis
4.3.2. PESTEL Analysis
4.3.3. Value Chain Analysis
4.3.4. Market Dynamics (Growth Influencers)
4.3.4.1. Drivers
4.3.4.2. Restraints
4.3.4.3. Opportunities
4.3.4.4. Impact Analysis of Drivers & Restraints
4.4. Regulations and Policies
4.5. Technology Roadmap
4.6. Connectivity Requirement Analysis
4.6.1. WiFi Connectivity
4.6.2. 5G
4.7. Global Location Based VR Market Analysis and Forecast, 2012–2026
4.7.1. Market Revenue Analysis (US$ Mn)
4.7.1.1. Historic Growth Trends, 2013–2018
4.7.1.2. Forecast Trends, 2019–2027
4.8. Market Opportunity Analysis – By Region (Global/North America/Europe/Asia Pacific/Middle East & Africa/South America)
4.8.1. By Component
4.8.2. By End-use
4.8.3. By Application
4.8.4. By Technology Type
4.9. Competitive Scenario and Trends
4.9.1. Location Based VR Market Concentration Rate
4.9.1.1. List of New Entrants
4.9.2. Mergers & Acquisitions, Expansions
4.10. Market Outlook
5. Global Location Based VR Market Analysis and Forecast, by Component
5.1. Overview and Definitions
5.2. Key Segment Analysis
5.3. Global Location Based VR Market Revenue (US$ Mn) Forecast, by Component, 2017–2027
5.3.1. Hardware (Mn Units)
5.3.1.1. Head Mounted Display
5.3.1.2. Head up Displays
5.3.1.3. Glasses
5.3.1.4. Sensor/Input
5.3.1.5. Camera
5.3.2. Software
6. Global Location Based VR Market Analysis and Forecast, by End-use
6.1. Overview
6.2. Key Segment Analysis
6.3. Global Location Based VR Market Revenue (US$ Mn) Forecast, by End-use 2017–2027
6.3.1. Amusement Park
6.3.2. Themed Attraction
6.3.3. 4D Films
6.3.4. Games
6.3.5. Automotive
6.3.6. Retail & Transport
7. Global Location Based VR Market Analysis and Forecast, by Application
7.1. Overview
7.2. Key Segment Analysis
7.3. Global Location Based VR Market Revenue (US$ Mn) Forecast, by Application, 2017–2027
7.3.1. Entertainment
7.3.2. Gaming
7.3.3. Media
7.3.4. Training/ Simulation
7.3.5. Navigation
7.3.6. Sales
8. Global Location Based VR Market Analysis and Forecast, by Technology Type
8.1. Overview
8.2. Key Segment Analysis
8.3. Global Location Based VR Market Revenue (US$ Mn) Forecast, by Technology Type, 2017–2027
8.3.1. 2-Dimensional (2D)
8.3.2. 3-Dimensional (3D)
8.3.3. Cloud Merged Reality (CMR)
9. Global Location Based VR Market Analysis and Forecast, by Region
9.1. Overview
9.2. Key Segment Analysis
9.3. Global Location Based VR Market Revenue (US$ Mn) Forecast, by Region, 2017–2027
9.3.1. North America
9.3.2. Europe
9.3.3. Asia Pacific
9.3.4. Middle East & Africa
9.3.5. South America
10. North America Location Based VR Market Analysis and Forecast
10.1. Key Findings
10.2. Impact Analysis of Drivers and Restraints
10.3. North America Location Based VR Market Revenue (US$ Mn) Forecast, by Component, 2017–2027
10.3.1. Hardware (Mn Units)
10.3.1.1. Head Mounted Display
10.3.1.2. Head up Displays
10.3.1.3. Glasses
10.3.1.4. Sensor/Input
10.3.1.5. Camera
10.3.2. Software
10.4. North America Location Based VR Market Revenue (US$ Mn) Forecast, by End-use 2017–2027
10.4.1. Amusement Park
10.4.2. Themed Attraction
10.4.3. 4D Films
10.4.4. Games
10.4.5. Automotive
10.4.6. Retail & Transport
10.5. North America Location Based VR Market Revenue (US$ Mn) Forecast, by Application, 2017–2027
10.5.1. Entertainment
10.5.2. Gaming
10.5.3. Media
10.5.4. Training/ Simulation
10.5.5. Navigation
10.5.6. Sales
10.6. North America Location Based VR Market Revenue (US$ Mn) Forecast, by Technology Type, 2017–2027
10.6.1. 2-Dimensional (2D)
10.6.2. 3-Dimensional (3D)
10.6.3. Cloud Merged Reality (CMR)
10.7. North America Location Based VR Market Revenue (US$ Mn) Forecast, by Country, 2017–2027
10.7.1. The U.S.
10.7.2. Canada
10.7.3. Rest of North America
11. Europe Location Based VR Market Analysis and Forecast
11.1. Key Findings
11.2. Impact Analysis of Drivers and Restraints
11.3. Europe Location Based VR Market Revenue (US$ Mn) Forecast, by Component, 2017–2027
11.3.1. Hardware (Mn Units)
11.3.1.1. Head Mounted Display
11.3.1.2. Head up Displays
11.3.1.3. Glasses
11.3.1.4. Sensor/Input
11.3.1.5. Camera
11.3.2. Software
11.4. Europe Location Based VR Market Revenue (US$ Mn) Forecast, by End-use 2017–2027
11.4.1. Amusement Park
11.4.2. Themed Attraction
11.4.3. 4D Films
11.4.4. Games
11.4.5. Automotive
11.4.6. Retail & Transport
11.5. Europe Location Based VR Market Revenue (US$ Mn) Forecast, by Application, 2017–2027
11.5.1. Entertainment
11.5.2. Gaming
11.5.3. Media
11.5.4. Training/ Simulation
11.5.5. Navigation
11.5.6. Sales
11.6. Europe Location Based VR Market Revenue (US$ Mn) Forecast, by Technology Type, 2017–2027
11.6.1. 2-Dimensional (2D)
11.6.2. 3-Dimensional (3D)
11.6.3. Cloud Merged Reality (CMR)
11.7. Europe Location Based VR Market Revenue (US$ Mn) Forecast, by Country/Sub-region, 2017–2027
11.7.1. Germany
11.7.2. France
11.7.3. U.K.
11.7.4. Rest of Europe
12. Asia Pacific Location Based VR Market Analysis and Forecast
12.1. Key Findings
12.2. Impact Analysis of Drivers and Restraints
12.3. Asia Pacific Location Based VR Market Revenue (US$ Mn) Forecast, by Component, 2017–2027
12.3.1. Hardware (Mn Units)
12.3.1.1. Head Mounted Display
12.3.1.2. Head up Displays
12.3.1.3. Glasses
12.3.1.4. Sensor/Input
12.3.1.5. Camera
12.3.2. Software
12.4. Asia Pacific Location Based VR Market Revenue (US$ Mn) Forecast, by End-use 2017–2027
12.4.1. Amusement Park
12.4.2. Themed Attraction
12.4.3. 4D Films
12.4.4. Games
12.4.5. Automotive
12.4.6. Retail & Transport
12.5. Asia Pacific Location Based VR Market Revenue (US$ Mn) Forecast, by Application, 2017–2027
12.5.1. Entertainment
12.5.2. Gaming
12.5.3. Media
12.5.4. Training/ Simulation
12.5.5. Navigation
12.5.6. Sales
12.6. Asia Pacific Location Based VR Market Revenue (US$ Mn) Forecast, by Technology Type, 2017–2027
12.6.1. 2-Dimensional (2D)
12.6.2. 3-Dimensional (3D)
12.6.3. Cloud Merged Reality (CMR)
12.7. Asia Pacific Location Based VR Market Revenue (US$ Mn) Forecast, by Country/Sub-region, 2017–2027
12.7.1. China
12.7.2. India
12.7.3. Japan
12.7.4. Rest of Asia Pacific
13. Middle East & Africa (MEA) Location Based VR Market Analysis and Forecast
13.1. Key Findings
13.2. Impact Analysis of Drivers and Restraints
13.3. Middle East & Africa Location Based VR Market Revenue (US$ Mn) Forecast, by Component, 2017–2027
13.3.1. Hardware (Mn Units)
13.3.1.1. Head Mounted Display
13.3.1.2. Head up Displays
13.3.1.3. Glasses
13.3.1.4. Sensor/Input
13.3.1.5. Camera
13.3.2. Software
13.4. Middle East & Africa Location Based VR Market Revenue (US$ Mn) Forecast, by End-use 2017–2027
13.4.1. Amusement Park
13.4.2. Themed Attraction
13.4.3. 4D Films
13.4.4. Games
13.4.5. Automotive
13.4.6. Retail & Transport
13.5. Middle East & Africa Location Based VR Market Revenue (US$ Mn) Forecast, by Application, 2017–2027
13.5.1. Entertainment
13.5.2. Gaming
13.5.3. Media
13.5.4. Training/ Simulation
13.5.5. Navigation
13.5.6. Sales
13.6. Middle East & Africa Location Based VR Market Revenue (US$ Mn) Forecast, by Technology Type, 2017–2027
13.6.1. 2-Dimensional (2D)
13.6.2. 3-Dimensional (3D)
13.6.3. Cloud Merged Reality (CMR)
13.7. Middle East & Africa Location Based VR Market Revenue (US$ Mn) Forecast, by Country/Sub-region, 2017–2027
13.7.1. GCC Countries
13.7.2. South Africa
13.7.3. Rest of Middle East & Africa
14. South America Location Based VR Market Analysis and Forecast
14.1. Key Findings
14.2. Impact Analysis of Drivers and Restraints
14.3. South America Location Based VR Market Revenue (US$ Mn) Forecast, by Component, 2017–2027
14.3.1. Hardware (Mn Units)
14.3.1.1. Head Mounted Display
14.3.1.2. Head up Displays
14.3.1.3. Glasses
14.3.1.4. Sensor/Input
14.3.1.5. Camera
14.3.2. Software
14.4. South America Location Based VR Market Revenue (US$ Mn) Forecast, by End-use 2017–2027
14.4.1. Amusement Park
14.4.2. Themed Attraction
14.4.3. 4D Films
14.4.4. Games
14.4.5. Automotive
14.4.6. Retail & Transport
14.5. South America Location Based VR Market Revenue (US$ Mn) Forecast, by Application, 2017–2027
14.5.1. Entertainment
14.5.2. Gaming
14.5.3. Media
14.5.4. Training/ Simulation
14.5.5. Navigation
14.5.6. Sales
14.6. South America Location Based VR Market Revenue (US$ Mn) Forecast, by Technology Type, 2017–2027
14.6.1. 2-Dimensional (2D)
14.6.2. 3-Dimensional (3D)
14.6.3. Cloud Merged Reality (CMR)
14.7. South America Location Based VR Market Revenue (US$ Mn) Forecast, by Country/Sub-region, 2017–2027
14.7.1. Brazil
14.7.2. Rest of South America
15. Competition Landscape
15.1. Market Player – Competition Matrix
15.2. Market Share Analysis (%), by Company (2017)
16. Company Profiles (Details – Business Overview, Sales Area/Geographical Presence, and Strategy)
16.1. Eon Reality Inc.
16.1.1. Business Overview
16.1.2. Business segment
16.1.3. Financial
16.1.4. Strategy
16.2. Google, LLC
16.2.1. Business Overview
16.2.2. Business segment
16.2.3. Financial
16.2.4. Strategy
16.3. HQSoftware
16.3.1. Business Overview
16.3.2. Business segment
16.3.3. Financial
16.3.4. Strategy
16.4. HTC Corporation
16.4.1. Business Overview
16.4.2. Business segment
16.4.3. Financial
16.4.4. Strategy
16.5. Huawei Technologies Co., Ltd.
16.5.1. Business Overview
16.5.2. Business segment
16.5.3. Financial
16.5.4. Strategy
16.6. Intel Corporation
16.6.1. Business Overview
16.6.2. Business segment
16.6.3. Financial
16.6.4. Strategy
16.7. Microsoft Corporation
16.7.1. Business Overview
16.7.2. Business segment
16.7.3. Financial
16.7.4. Strategy
16.8. Oculus VR
16.8.1. Business Overview
16.8.2. Business segment
16.8.3. Financial
16.8.4. Strategy
16.9. Samsung Electronics Co., Ltd.
16.9.1. Business Overview
16.9.2. Business segment
16.9.3. Financial
16.9.4. Strategy
16.10. Sony Interactive Entertainment LLC
16.10.1. Business Overview
16.10.2. Business segment
16.10.3. Financial
16.10.4. Strategy
17. Key Takeaways
List of Tables
Table No. 1: New Entrants in Location Based VR Market
Table No. 2: Global Location Based VR Market Value (US$ Mn) and Forecast, by Component, 2017?2027
Table No. 3: Global Location Based VR Market Volume (Thousand Units) and Forecast, by Component, 2017?2027
Table No. 4: Global Location Based VR Market Value (US$ Mn) and Forecast, by End-use, 2017?2027
Table No. 5: Global Location Based VR Market Value (US$ Mn) and Forecast, by Application, 2017?2027
Table No. 6: Global Location Based VR Market Value (US$ Mn) and Forecast, by Technology Type, 2017?2027
Table No. 7: Global Location Based VR Market Value (US$ Mn) and Forecast, by Region, 2017?2027
Table No. 8: Global Location Based VR Market Volume (Thousand Units) and Forecast, by Region, 2017?2027
Table No. 9: North America Location Based VR Market Value (US$ Mn) and Forecast, by Component, 2017?2027
Table No. 10: North America Location Based VR Market Volume (Thousand Units) and Forecast, by Component, 2017?2027
Table No. 11: North America Location Based VR Market Value (US$ Mn) and Forecast, by Application, 2017?2027
Table No. 12: North America Location Based VR Market Value (US$ Mn) and Forecast, by Technology Type, 2017?2027
Table No. 13: North America Location Based VR Market Value (US$ Mn) and Forecast, by End-use, 2017?2027
Table No. 14: North America Location Based VR Market Value (US$ Mn) and Forecast, by Country, 2017?2027
Table No. 15: Europe Location Based VR Market Value (US$ Mn) and Forecast, by Component, 2017?2027
Table No. 16: Europe Location Based VR Market Volume (Thousand Units) and Forecast, by Component, 2017?2027
Table No. 17: Europe Location Based VR Market Value (US$ Mn) and Forecast, by Application, 2017?2027
Table No. 18: Europe Location Based VR Market Value (US$ Mn) and Forecast, by Technology Type, 2017?2027
Table No. 19: Europe Location Based VR Market Value (US$ Mn) and Forecast, by End-use, 2017?2027
Table No. 20: Europe Location Based VR Market Value (US$ Mn) and Forecast, by Country, 2017?2027
Table No. 21: Asia Pacific Location Based VR Market Value (US$ Mn) and Forecast, by Component, 2017?2027
Table No. 22: Asia Pacific Location Based VR Market Volume (Thousand Units) and Forecast, by Component, 2017?2027
Table No. 23: Asia Pacific Location Based VR Market Value (US$ Mn) and Forecast, by Application, 2017?2027
Table No. 24: Asia Pacific Location Based VR Market Value (US$ Mn) and Forecast, by Technology Type, 2017?2027
Table No. 25: Asia Pacific Location Based VR Market Value (US$ Mn) and Forecast, by End-use, 2017?2027
Table No. 26: Asia Pacific Location Based VR Market Value (US$ Mn) and Forecast, by Country, 2017?2027
Table No. 27: Middle East & Africa Location Based VR Market Value (US$ Mn) and Forecast, by Component, 2017?2027
Table No. 28: Middle East & Africa Location Based VR Market Volume (Thousand Units) and Forecast, by Component, 2017?2027
Table No. 29: Middle East & Africa Location Based VR Market Value (US$ Mn) and Forecast, by Application, 2017?2027
Table No. 30: Middle East & Africa Location Based VR Market Value (US$ Mn) and Forecast, by Technology Type, 2017?2027
Table No. 31: Middle East & Africa Location Based VR Market Value (US$ Mn) and Forecast, by End-use, 2017?2027
Table No. 32: Middle East & Africa Location Based VR Market Value (US$ Mn) and Forecast, by Country, 2017?2027
Table No. 33: South America Location Based VR Market Value (US$ Mn) and Forecast, by Component, 2017?2027
Table No. 34: South America Location Based VR Market Volume (Thousand Units) and Forecast, by Component, 2017?2027
Table No. 35: South America Location Based VR Market Value (US$ Mn) and Forecast, by Application, 2017?2027
Table No. 36: South America Location Based VR Market Value (US$ Mn) and Forecast, by Technology Type, 2017?2027
Table No. 37: South America Location Based VR Market Value (US$ Mn) and Forecast, by End-use, 2017?2027
Table No. 38: South America Location Based VR Market Value (US$ Mn) and Forecast, by Country, 2017?2027
List of Figures
Figure No. 1: Share Analysis
Figure No. 2: Gross Domestic Product (GDP) per Capita; Analysis (1/2) (US$ Tn), By Major Countries, 2012-2017
Figure No. 3: GDP (US$ Bn), Top Economies (2012-2017)
Figure No. 4: Top Economies GDP Landscape
Figure No. 5: Vale Chain Analysis
Figure No. 6: Global Location Based VR Market Size (US$ Mn) and Forecast, 2013 – 2027
Figure No. 7: Global Location Based VR Market Opportunity Analysis, 2017 – 2027
Figure No. 8: Global Location Based VR Market Size (Thousand Units) and Forecast, 2013 – 2027
Figure No. 9: Global Location Based VR Market Opportunity Analysis, 2017 – 2027
Figure No. 10: Global Location Based VR Market Opportunity Assessment, by Component
Figure No. 11: Global Location Based VR Market Opportunity Assessment, by Application
Figure No. 12: Global Location Based VR Market Opportunity Assessment, by Technology Type
Figure No. 13: Global Location Based VR Market Opportunity Assessment, by End-use
Figure No. 14: Global Location Based VR Market Opportunity Assessment, by Region
Figure No. 15: North America Location Based VR Market Opportunity Assessment, by Component
Figure No. 16: North America Location Based VR Market Opportunity Assessment, by Application
Figure No. 17: North America Location Based VR Market Opportunity Assessment, by Technology Type
Figure No. 18: North America Location Based VR Market Opportunity Assessment, by End-use
Figure No. 19: North America Location Based VR Market Opportunity Assessment, by Country
Figure No. 20: Europe Location Based VR Market Opportunity Assessment, by Component
Figure No. 21: Europe Location Based VR Market Opportunity Assessment, by Application
Figure No. 22: Europe Location Based VR Market Opportunity Assessment, by Technology Type
Figure No. 23: Europe Location Based VR Market Opportunity Assessment, by End-use
Figure No. 24: Europe Location Based VR Market Opportunity Assessment, by Country
Figure No. 25: Asia Pacific Location Based VR Market Opportunity Assessment, by Component
Figure No. 26: Asia Pacific Location Based VR Market Opportunity Assessment, by Application
Figure No. 27: Asia Pacific Location Based VR Market Opportunity Assessment, by Technology Type
Figure No. 28: Asia Pacific Location Based VR Market Opportunity Assessment, by End-use
Figure No. 29: Asia Pacific Location Based VR Market Opportunity Assessment, by Country
Figure No. 30: MEA Location Based VR Market Opportunity Assessment, by Component
Figure No. 31: MEA Location Based VR Market Opportunity Assessment, by Application
Figure No. 32: MEA Location Based VR Market Opportunity Assessment, by Technology Type
Figure No. 33: MEA Location Based VR Market Opportunity Assessment, by End-use
Figure No. 34: MEA Location Based VR Market Opportunity Assessment, by Country
Figure No. 35: South America MEA Location Based VR Market Opportunity Assessment, by Component
Figure No. 36: South America Location Based VR Market Opportunity Assessment, by Application
Figure No. 37: South America Location Based VR Market Opportunity Assessment, by Technology Type
Figure No. 38: South America Location Based VR Market Opportunity Assessment, by End-use
Figure No. 39: South America Location Based VR Market Opportunity Assessment, by Country
Figure No. 40: Global Location Based VR Market, Application, CAGR (%) (2019 – 2027)
Figure No. 41: Global Location Based VR Market, by Technology Type. CAGR (%) (2019 – 2027)
Figure No. 42: Global Location Based VR Market, End-use, CAGR (%) (2019 – 2027)
Figure No. 43: Global Location Based VR Market Analysis and Forecast, by Component (2019)
Figure No. 44: Global Location Based VR Market Analysis and Forecast, by Component (2027)
Figure No. 45: Global Location Based VR Market Analysis and Forecast, by End-use, (2019)
Figure No. 46: Global Location Based VR Market Analysis and Forecast, End-use (2027)
Figure No. 47: Global Location Based VR Market Analysis and Forecast, by Application (2019)
Figure No. 48: Global Location Based VR Market Analysis and Forecast, by Application (2027)
Figure No. 49: Global Location Based VR Market Analysis and Forecast, by Technology Type (2019)
Figure No. 50: Global Location Based VR Market Analysis and Forecast, by Technology Type (2027)
Figure No. 51: Global Location Based VR Market Analysis and Forecast, by Region, (2019)
Figure No. 52: Global Location Based VR Market Analysis and Forecast, Region (2027)
Figure No. 53: North America Location Based VR Market Size (US$ Mn) and Forecast, 2017?2027
Figure No. 54: North America Location Based VR Market Opportunity Analysis, 2017?2027
Figure No. 55: North America Location Based VR Market Volume (Thousand Units) and Forecast, 2017?2027
Figure No. 56: North America Location Based VR Market Volume Opportunity Analysis, 2017?2027
Figure No. 57: North America Location Based VR Market Analysis and Forecast, by Component (2019)
Figure No. 58: North America Location Based VR Market Analysis and Forecast, by Component (2027)
Figure No. 59: North America Location Based VR Market Analysis and Forecast, by Application (2019)
Figure No. 60: North America Location Based VR Market Analysis and Forecast, by Application (2027)
Figure No. 61: North America Location Based VR Market Analysis and Forecast, by Technology Type (2019)
Figure No. 62: North America Location Based VR Market Analysis and Forecast, by Technology Type (2027)
Figure No. 63: North America Location Based VR Market Analysis and Forecast, by End-use, (2019)
Figure No. 64: North America Location Based VR Market Analysis and Forecast, End-use (2027)
Figure No. 65: North America Location Based VR Market Analysis and Forecast, by Country, (2019)
Figure No. 66: North America Location Based VR Market Analysis and Forecast, Country (2027)
Figure No. 67: Europe Location Based VR Market Size (US$ Mn) and Forecast, 2017?2027
Figure No. 68: Europe Location Based VR Market Opportunity Analysis, 2017?2027
Figure No. 69: Europe Location Based VR Market Volume (Thousand Units) and Forecast, 2017?2027
Figure No. 70: Europe Location Based VR Market Volume Opportunity Analysis, 2017?2027
Figure No. 71: Europe Location Based VR Market Analysis and Forecast, by Component (2019)
Figure No. 72: Europe Location Based VR Market Analysis and Forecast, by Component (2027)
Figure No. 73: Europe Location Based VR Market Analysis and Forecast, by Application (2019)
Figure No. 74: Europe Location Based VR Market Analysis and Forecast, by Application (2027)
Figure No. 75: Europe Location Based VR Market Analysis and Forecast, by Technology Type (2019)
Figure No. 76: Europe Location Based VR Market Analysis and Forecast, by Technology Type (2027)
Figure No. 77: Europe Location Based VR Market Analysis and Forecast, by End-use, (2019)
Figure No. 78: Europe Location Based VR Market Analysis and Forecast, End-use (2027)
Figure No. 79: Europe Location Based VR Market Analysis and Forecast, by Country, (2019)
Figure No. 80: Europe Location Based VR Market Analysis and Forecast, Country (2027)
Figure No. 81: Asia Pacific Location Based VR Market Size (US$ Mn) and Forecast, 2017?2027
Figure No. 82: Asia Pacific Location Based VR Market Opportunity Analysis, 2017?2027
Figure No. 83: Asia Pacific Location Based VR Market Volume (Thousand Units) and Forecast, 2017?2027
Figure No. 84: Asia Pacific Location Based VR Market Volume Opportunity Analysis, 2017?2027
Figure No. 85: Asia Pacific Location Based VR Market Analysis and Forecast, by Component (2019)
Figure No. 86: Asia Pacific Location Based VR Market Analysis and Forecast, by Component (2027)
Figure No. 87: Asia Pacific Location Based VR Market Analysis and Forecast, by Application (2019)
Figure No. 88: Asia Pacific Location Based VR Market Analysis and Forecast, by Application (2027)
Figure No. 89: Asia Pacific Location Based VR Market Analysis and Forecast, by Technology Type (2019)
Figure No. 90: Asia Pacific Location Based VR Market Analysis and Forecast, by Technology Type (2027)
Figure No. 91: Asia Pacific Location Based VR Market Analysis and Forecast, by End-use, (2019)
Figure No. 92: Asia Pacific Location Based VR Market Analysis and Forecast, End-use (2027)
Figure No. 93: Asia Pacific Location Based VR Market Analysis and Forecast, by Country, (2019)
Figure No. 94: Asia Pacific Location Based VR Market Analysis and Forecast, Country (2027)
Figure No. 95: Middle East & Africa Location Based VR Market Size (US$ Mn) and Forecast, 2017?2027
Figure No. 96: Middle East & Africa Location Based VR Market Opportunity Analysis, 2017?2027
Figure No. 97: Middle East & Africa Location Based VR Market Volume (Thousand Units) and Forecast, 2017?2027
Figure No. 98: Middle East & Africa Location Based VR Market Volume Opportunity Analysis, 2017?2027
Figure No. 99: Middle East & Africa Location Based VR Market Analysis and Forecast, by Component (2019)
Figure No. 100: Middle East & Africa Location Based VR Market Analysis and Forecast, by Component (2027)
Figure No. 101: Middle East & Africa Location Based VR Market Analysis and Forecast, by Application (2019)
Figure No. 102: Middle East & Africa Location Based VR Market Analysis and Forecast, by Application (2027)
Figure No. 103: Middle East & Africa Location Based VR Market Analysis and Forecast, by Technology Type (2019)
Figure No. 104: Middle East & Africa Location Based VR Market Analysis and Forecast, by Technology Type (2027)
Figure No. 105: Middle East & Africa Location Based VR Market Analysis and Forecast, by End-use, (2019)
Figure No. 106: Middle East & Africa Location Based VR Market Analysis and Forecast, End-use (2027)
Figure No. 107: Middle East & Africa Location Based VR Market Analysis and Forecast, by Country, (2019)
Figure No. 108: Middle East & Africa Location Based VR Market Analysis and Forecast, Country (2027)
Figure No. 109: South America Location Based VR Market Size (US$ Mn) and Forecast, 2017?2027
Figure No. 110: South America Location Based VR Market Opportunity Analysis, 2017?2027
Figure No. 111: South America Location Based VR Market Volume (Thousand Units) and Forecast, 2017?2027
Figure No. 112: South America Location Based VR Market Volume Opportunity Analysis, 2017?2027
Figure No. 113: South America Location Based VR Market Analysis and Forecast, by Component (2019)
Figure No. 114: South America Location Based VR Market Analysis and Forecast, by Component (2027)
Figure No. 115: South America Location Based VR Market Analysis and Forecast, by Application (2019)
Figure No. 116: South America Location Based VR Market Analysis and Forecast, by Application (2027)
Figure No. 117: South America Location Based VR Market Analysis and Forecast, by Technology Type (2019)
Figure No. 118: South America Location Based VR Market Analysis and Forecast, by Technology Type (2027)
Figure No. 119: South America Location Based VR Market Analysis and Forecast, by End-use, (2019)
Figure No. 120: South America Location Based VR Market Analysis and Forecast, End-use (2027)
Figure No. 121: South America Location Based VR Market Analysis and Forecast, by Country, (2019)
Figure No. 122: South America Location Based VR Market Analysis and Forecast, Country (2027)
Figure No. 123: Global Location Based VR Market Revenue Share Analysis, by Company, 2018
Copyright © Transparency Market Research, Inc. All Rights reserved
Trust Online

Location Based VR Market
