The healthcare sector is converging with the Information and Communications Technology (ICT) sector rapidly, as the need for tech-driven, highly-efficient electronic appliances is growing in various applications, including assisted living. Statistics published by the United Nations state that, in 2013, elderly people accounted for nearly 12% of the global population, and this number is likely to grow rapidly to reach 21% by 2050. This is expected to give rise to the demand for automatic machine-based assistance for the elderly population, consequently providing a fillip to the growth of the location-based ambient intelligence market.
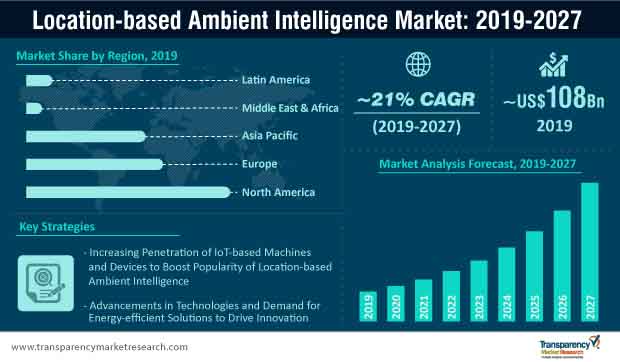
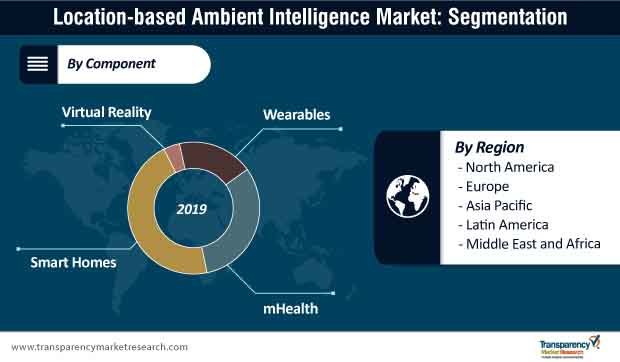
The global market for location-based ambient intelligence reached ~US$ 91.7 billion in 2018, and is likely to reach ~US$ 108 Bn in 2019, with a two-fifth revenue share occupied its applications in smart homes. While the integration of location-based ambient intelligence is observed largely in connected homes, emerging trends in the e-healthcare and telemedicine industries will underscore the new growth prospects for the market in the coming future.
Ongoing advancements in technologies are likely to boost the popularity of ambient-assisted living and the integration of ambient intelligence solutions for assisting medical diagnosis. Increasing sales potential of medical devices that are integrated with ambient intelligence technology, which is intrinsically and thoroughly connected with artificial intelligence (AI), will create a massive window of opportunities for stakeholders in the healthcare sector.
Market players are likely adopt new strategies to focus on changing end users’ needs in specific application areas. This will remain the primary driving engine for the battle for the development of next-gen devices and evolved personal assistant applications of location-based ambient intelligence that can predict dynamic end-user requirements, and make changes in systems that can facilitate these needs.
While the world of Internet of Things (IoT), Virtual Reality (VR), and Ambient Intelligence is mainly characterized by advancements in technology, innovations in the location-based ambient intelligence landscape are not driven by the newest additions in technologies anymore. Commercial applications in the market are mainly driven by consumer perception about their experience with IoT-based, wearable devices.
With the increasing dependence of digital innovation on consumer experience, a majority of market players’ strategies and decision-making policies will be influenced by the thought of providing intuitive and personalized features through the integration of high-quality sensors in location-based ambient intelligence applications. This is redefining the emerging trends and winning imperatives for stakeholders in the location-based ambient intelligence market.
With increasing consumer awareness about the environmental impact of various appliances that they use, the demand for energy-efficient location-based ambient intelligence solutions is surging rapidly. In addition, consumers are also voicing their concerns about cyber threats and the need for security features in location-based ambient-intelligent devices.
These trends in the market are giving rise to technology-driven partnerships among leading players in the location-based ambient intelligence market. For instance, HTC Corporation, a Taiwanese consumer electronics company, has partnered with several ecosystem players to expand its VR footprint, globally. The company partnered with Valve Corp. in order to provide VR based games, specifically to promote HTC Vive among end users. Furthermore, the company partnered with several input controller providers and software & service providers to increase the usage of HTC Vive in different end-user applications.
Another leading player in the market and a Chinese multinational technology company – Huawei Technologies Co., Ltd., focuses on partnerships with companies for the integration and licensing of advanced technologies. It partnered with ARM, a processor design company. The incorporation of ARM’s new ARMv8 license enables technology in networking and cloud computing.
Furthermore, the increasing need for constant advancements in connectivity has been triggering new trends in the location-based ambient intelligence market, and this is bolstering more collaborations among electronic companies with telecommunication service providers. For instance, in February 2018, Samsung Electronics partnered with Vodafone Group to develop and launch a range of consumer Internet of Things (IoT) 'Smart Home' product and services.
Other major players operating in the global location-based ambient intelligence market and profiled in the report include
1. Preface
1.1. Market Scope
1.2. Market Segmentation
1.3. Key Research Objectives
2. Assumptions and Research Methodology
2.1. Report Assumptions
2.2. Acronyms
2.3. Research Methodology
3. Executive Summary : Global Location-based Ambient Intelligence Market
4. Market Overview
4.1. Introduction
4.2. Global Market – Macro Economic Factors Overview
4.2.1. World GDP Indicator – For Top 20 Economies
4.2.2. Key Regional Socio-political-technological Developments and Their Impact Considerations
4.3. Technology/Product Roadmap
4.4. Market Factor Analysis
4.4.1. Porter’s Five Forces Analysis
4.4.2. PEST Analysis
4.4.3. Market Dynamics (Growth Influencers)
4.4.3.1. Drivers
4.4.3.2. Restraints
4.4.3.3. Opportunities
4.5. Global Location-based Ambient Intelligence Market Analysis and Forecast, 2017 - 2027
4.5.1. Market Revenue Analysis (US$ Bn)
4.5.1.1. Historic Growth Trends, 2013-2018
4.5.1.2. Forecast trends, 2019-2027
4.6. Market Opportunity Assessment – By Region (Global/North America/Europe/Asia Pacific/Middle East & Africa/South America)
4.6.1. By Region/Country
4.6.2. By Component
4.6.3. By Institution Type
4.7. Market Outlook
5. Global Location-based Ambient Intelligence Market Analysis and Forecast, by Component
5.1. Overview
5.2. Key Segment Analysis
5.3. Location-based Ambient Intelligence Market Size (US$ Bn) Forecast, by Component, 2017 - 2027
5.3.1. Virtual Reality
5.3.1.1. Hardware
5.3.1.2. Software
5.3.2. Wearables
5.3.3. mHealth
5.3.4. Smart Homes
5.3.4.1. Lighting Control
5.3.4.2. Security & Access Control
5.3.4.3. HVAC Control
5.3.4.4. Entertainment Control
5.3.4.5. Others
6. Global Location-based Ambient Intelligence Market Analysis and Forecast, by Region
6.1. Overview
6.2. Key Segment Analysis
6.3. Location-based Ambient Intelligence Market Size (US$ Bn) Forecast, by Region, 2017 - 2027
6.3.1. North America
6.3.2. Europe
6.3.3. Asia Pacific
6.3.4. Middle East & Africa
6.3.5. South America
7. North America Location-based Ambient Intelligence Market Analysis and Forecast
7.1. Overview
7.2. Location-based Ambient Intelligence Market Size (US$ Bn) Forecast, by Component, 2017 - 2027
7.2.1. Virtual Reality
7.2.1.1. Hardware
7.2.1.2. Software
7.2.2. Wearables
7.2.3. mHealth
7.2.4. Smart Homes
7.2.4.1. Lighting Control
7.2.4.2. Security & Access Control
7.2.4.3. HVAC Control
7.2.4.4. Entertainment Control
7.2.4.5. Others
7.3. Location-based Ambient Intelligence Market Size (US$ Bn) Forecast, by Country & Sub-region, 2017 - 2027
7.3.1. The U.S.
7.3.2. Canada
7.3.3. Rest of North America
8. Europe Location-based Ambient Intelligence Market Analysis and Forecast
8.1. Overview
8.2. Location-based Ambient Intelligence Market Size (US$ Bn) Forecast, by Component, 2017 - 2027
8.2.1. Virtual Reality
8.2.1.1. Hardware
8.2.1.2. Software
8.2.2. Wearables
8.2.3. mHealth
8.2.4. Smart Homes
8.2.4.1. Lighting Control
8.2.4.2. Security & Access Control
8.2.4.3. HVAC Control
8.2.4.4. Entertainment Control
8.2.4.5. Others
8.3. Location-based Ambient Intelligence Market Size (US$ Bn) Forecast, by Country & Sub-region, 2017 - 2027
8.3.1. Germany
8.3.2. France
8.3.3. UK
8.3.4. Rest of Europe
9. Asia Pacific Location-based Ambient Intelligence Market Analysis and Forecast
9.1. Overview
9.2. Location-based Ambient Intelligence Market Size (US$ Bn) Forecast, by Component, 2017 - 2027
9.2.1. Virtual Reality
9.2.1.1. Hardware
9.2.1.2. Software
9.2.2. Wearables
9.2.3. mHealth
9.2.4. Smart Homes
9.2.4.1. Lighting Control
9.2.4.2. Security & Access Control
9.2.4.3. HVAC Control
9.2.4.4. Entertainment Control
9.2.4.5. Others
9.3. Location-based Ambient Intelligence Market Size (US$ Bn) Forecast, by Country & Sub-region, 2017 - 2027
9.3.1. China
9.3.2. Japan
9.3.3. India
9.3.4. Australia
9.3.5. Rest of Asia Pacific
10. Middle East & Africa Location-based Ambient Intelligence Market Analysis and Forecast
10.1. Overview
10.2. Location-based Ambient Intelligence Market Size (US$ Bn) Forecast, by Component, 2017 - 2027
10.2.1. Virtual Reality
10.2.1.1. Hardware
10.2.1.2. Software
10.2.2. Wearables
10.2.3. mHealth
10.2.4. Smart Homes
10.2.4.1. Lighting Control
10.2.4.2. Security & Access Control
10.2.4.3. HVAC Control
10.2.4.4. Entertainment Control
10.2.4.5. Others
10.3. Location-based Ambient Intelligence Market Size (US$ Bn) Forecast, by Country & Sub-region, 2017 – 2027
10.3.1. GCC
10.3.2. South Africa
10.3.3. Rest of Middle East & Africa
11. South America Location-based Ambient Intelligence Market Analysis and Forecast
11.1. Overview
11.2. Location-based Ambient Intelligence Market Size (US$ Bn) Forecast, by Component, 2017 - 2027
11.2.1. Virtual Reality
11.2.1.1. Hardware
11.2.1.2. Software
11.2.2. Wearables
11.2.3. mHealth
11.2.4. Smart Homes
11.2.4.1. Lighting Control
11.2.4.2. Security & Access Control
11.2.4.3. HVAC Control
11.2.4.4. Entertainment Control
11.2.4.5. Others
11.3. Location-based Ambient Intelligence Market Size (US$ Bn) Forecast, by Country & Sub-region, 2017 - 2027
11.3.1. Brazil
11.3.2. Rest of South America
12. Competition Landscape
12.1. Market Player –Regional Presence Intensity Map
13. Company Profiles(Details – Basic Overview, Geographical Presence, Revenue, Strategy)
13.1. Huawei Technologies Co., Ltd.
13.1.1. Overview
13.1.2. Product Portfolio
13.1.3. Revenue
13.1.4. Key Developments
13.1.5. Strategic Overview
13.2. Samsung Electronics Co., Ltd.
13.2.1. Overview
13.2.2. Product Portfolio
13.2.3. Revenue
13.2.4. Key Developments
13.2.5. Strategic Overview
13.3. ABB Ltd.
13.3.1. Overview
13.3.2. Product Portfolio
13.3.3. Revenue
13.3.4. Key Developments
13.3.5. Strategic Overview
13.4. Honeywell International Inc.
13.4.1. Overview
13.4.2. Product Portfolio
13.4.3. Revenue
13.4.4. Key Developments
13.4.5. Strategic Overview
13.5. Johnson Controls Inc.
13.5.1. Overview
13.5.2. Product Portfolio
13.5.3. Revenue
13.5.4. Key Developments
13.5.5. Strategic Overview
13.6. Nokia Corporation
13.6.1. Overview
13.6.2. Product Portfolio
13.6.3. Revenue
13.6.4. Key Developments
13.6.5. Strategic Overview
13.7. Schneider Electric SE
13.7.1. Overview
13.7.2. Product Portfolio
13.7.3. Revenue
13.7.4. Key Developments
13.7.5. Strategic Overview
13.8. Siemens AG
13.8.1. Overview
13.8.2. Product Portfolio
13.8.3. Revenue
13.8.4. Key Developments
13.8.5. Strategic Overview
13.9. Google, LLC.
13.9.1. Overview
13.9.2. Product Portfolio
13.9.3. Revenue
13.9.4. Key Developments
13.9.5. Strategic Overview
13.10. HTC Corporation
13.10.1. Overview
13.10.2. Product Portfolio
13.10.3. Revenue
13.10.4. Key Developments
13.10.5. Strategic Overview
14. Key Takeaways
List of Tables
Table 1: North America ICT Spending (US$ Mn)
Table 2: Europe ICT Spending (US$ Mn)
Table 3: Asia Pacific ICT Spending (US$ Mn)
Table 4: MEA ICT Spending (US$ Mn)
Table 5: South America ICT Spending (US$ Mn)
Table 6: Global Location-based Ambient Intelligence Market Size (US$ Bn) Forecast, By Component, 2017 – 2027
Table 7: Global Location-based Ambient Intelligence MarketSize (US$ Bn) Forecast, By Virtual Reality, 2017 – 2027
Table 8: Global Location-based Ambient Intelligence MarketSize (US$ Bn) Forecast, By Smart Homes, 2017 – 2027
Table 9: Global Location-based Ambient Intelligence Market Size (US$ Bn) Forecast, By Virtual Reality, By region 2017 – 2027
Table 10: Global Location-based Ambient Intelligence Market Size (US$ Bn) Forecast, By Wearables, By region 2017 – 2027
Table 11: Global Location-based Ambient Intelligence Market Size (US$ Bn) Forecast, By mHealth, By region 2017 – 2027
Table 12: Global Location-based Ambient Intelligence Market Size (US$ Bn) Forecast, By Smart Homes, By region 2017 – 2027
Table 13: Global Location-based Ambient Intelligence Market Revenue (US$ Bn) Forecast, by Region, 2017 - 2027
Table 14: North America Location-based Ambient Intelligence Market Size (US$ Bn) Forecast, By Component, 2017 – 2027
Table 15: North America Location-based Ambient Intelligence Market Size (US$ Bn) Forecast, By Virtual Reality, 2017 – 2027
Table 16: North America Location-based Ambient Intelligence Market Size (US$ Bn) Forecast, By Smart Homes, 2017 – 2027
Table 17: North America Location-based Ambient Intelligence Market Size (US$ Bn) Forecast, By Country, 2017 – 2027
Table 18: Europe Location-based Ambient Intelligence Market Size (US$ Bn) Forecast, By Component, 2017 – 2027
Table 19: Europe Location-based Ambient Intelligence Market Size (US$ Bn) Forecast, By Virtual Reality, 2017 – 2027
Table 20: Europe Location-based Ambient Intelligence Market Size (US$ Bn) Forecast, By Smart Homes, 2017 – 2027
Table 21: Europe Location-based Ambient Intelligence Market Size (US$ Bn) Forecast, By Country, 2017 – 2027
Table 22: Asia Pacific Location-based Ambient Intelligence Market Size (US$ Bn) Forecast, By Component, 2017 – 2027
Table 23: Asia Pacific Location-based Ambient Intelligence Market Size (US$ Bn) Forecast, By Virtual Reality, 2017 – 2027
Table 24: Asia Pacific Location-based Ambient Intelligence Market Size (US$ Bn) Forecast, By Smart Homes, 2017 – 2027
Table 25: Asia Pacific Location-based Ambient Intelligence Market Size (US$ Bn) Forecast, By Country, 2017 – 2027
Table 26: Middle East & Africa Location-based Ambient Intelligence Market Size (US$ Bn) Forecast, By Component, 2017 – 2027
Table 27: Middle East & Africa Location-based Ambient Intelligence Market Size (US$ Bn) Forecast, By Virtual Reality, 2017 – 2027
Table 28: Middle East & Africa Location-based Ambient Intelligence Market Size (US$ Bn) Forecast, By Smart Homes, 2017 – 2027
Table 29: Middle East & Africa Location-based Ambient Intelligence Market Size (US$ Bn) Forecast, By Country, 2017 – 2027
Table 30: South America Location-based Ambient Intelligence Market Size (US$ Bn) Forecast, By Component, 2017 – 2027
Table 31: South America Location-based Ambient Intelligence Market Size (US$ Bn) Forecast, By Virtual Reality, 2017 – 2027
Table 32: South America Location-based Ambient Intelligence Market Size (US$ Bn) Forecast, By Smart Homes, 2017 – 2027
Table 33: South America Location-based Ambient Intelligence Market Size (US$ Bn) Forecast, By Country, 2017 – 2027
List of Figures
Figure 1: Global Market Value (US$ Bn)
Figure 2: Dominating Segments
Figure 3: Fastest Growing Segments, (CAGR 2019-2027)
Figure 4: North America Market Value, US$ Bn
Figure 5: Europe Market Value, US$ Bn
Figure 6: Asia Pacific Market Value, US$ Bn
Figure 7: South America Market Value, US$ Bn
Figure 8: South America Market Value, US$ Bn
Figure 9: Gross Domestic Product (GDP) per Capita; Analysis (1/2) (US$ Tn), By Major Countries, 2012-2017
Figure 10: Global Location-based Ambient Intelligence Market Size (US$ Bn) Forecast, 2013 – 2018
Figure 11: Global Location-based Ambient Intelligence Market Size (US$ Bn) Forecast, 2019 – 2027
Figure 12: Global Location-based Ambient Intelligence Market Attractiveness Analysis, by Country
Figure 13: Global Location-based Ambient Intelligence Market Attractiveness Analysis, by Country
Figure 14: Global Location-based Ambient Intelligence Market Attractiveness Analysis, by Component
Figure 15: Global Location-based Ambient Intelligence Market Attractiveness Analysis, by Component
Figure 16: Global Location-based Ambient Intelligence Value Share Analysis, By Component, 2017
Figure 17: Global Location-based Ambient Intelligence Value Share Analysis, By Component, 2027
Figure 18: Global Location-based Ambient Intelligence Value Share Analysis, By Virtual Reality, By Region, 2017
Figure 19: Global Location-based Ambient Intelligence Value Share Analysis, By Virtual Reality, By Region, 2027
Figure 20: Global Location-based Ambient Intelligence Value Share Analysis, By Wearables, By Region, 2017
Figure 21: Global Location-based Ambient Intelligence Value Share Analysis, By Wearables, By Region, 2027
Figure 22: Global Location-based Ambient Intelligence Value Share Analysis, By mHealth, By Region, 2017
Figure 23: Global Location-based Ambient Intelligence Value Share Analysis, By mHealth, By Region, 2027
Figure 24: Global Location-based Ambient Intelligence Value Share Analysis, By Smart Homes, By Region, 2017
Figure 25: Global Location-based Ambient Intelligence Value Share Analysis, By Smart Homes, By Region, 2027
Figure 26: Global Location-based Ambient Intelligence Market Share Analysis, by Region (2019)
Figure 27: Global Location-based Ambient Intelligence Market Share Analysis, by Region (2027)
Figure 28: North America Location-based Ambient Intelligence Market Revenue (US$ Bn) and Y-o-Y Forecast, 2018– 2026
Figure 29: North America Location-based Ambient Intelligence Market Opportunity Growth Analysis (US$ Bn), 2016 – 2026
Figure 30: North America Location-based Ambient Intelligence Value Share Analysis, By Component, 2017
Figure 31: North America Location-based Ambient Intelligence Value Share Analysis, By Component, 2027
Figure 32: North America Location-based Ambient Intelligence Value Share Analysis, By Country, 2017
Figure 33: North America Location-based Ambient Intelligence Value Share Analysis, By Country, 2027
Figure 34: Europe Location-based Ambient Intelligence Market Revenue (US$ Bn) and Y-o-Y Forecast, 2018– 2026
Figure 35: Europe Location-based Ambient Intelligence Market Opportunity Growth Analysis (US$ Bn), 2016 – 2026
Figure 36: Europe Location-based Ambient Intelligence Value Share Analysis, By Component, 2017
Figure 37: Europe Location-based Ambient Intelligence Value Share Analysis, By Component, 2027
Figure 38: Europe Location-based Ambient Intelligence Value Share Analysis, By Country, 2017
Figure 39: Europe Location-based Ambient Intelligence Value Share Analysis, By Country, 2027
Figure 40: Asia Pacific Location-based Ambient Intelligence Market Revenue (US$ Bn) and Y-o-Y Forecast, 2018– 2026
Figure 41: Asia Pacific Location-based Ambient Intelligence Market Opportunity Growth Analysis (US$ Bn), 2016 – 2026
Figure 42: Asia Pacific Location-based Ambient Intelligence Value Share Analysis, By Component, 2017
Figure 43: Asia Pacific Location-based Ambient Intelligence Value Share Analysis, By Component, 2027
Figure 44: Asia Pacific Location-based Ambient Intelligence Value Share Analysis, By Country, 2017
Figure 45: Asia Pacific Location-based Ambient Intelligence Value Share Analysis, By Country, 2027
Figure 46: Middle East & Africa Location-based Ambient Intelligence Market Revenue (US$ Bn) and Y-o-Y Forecast, 2018– 2026
Figure 47: Middle East & Africa Location-based Ambient Intelligence Market Opportunity Growth Analysis (US$ Bn), 2016 – 2026
Figure 48: Middle East & Africa Location-based Ambient Intelligence Value Share Analysis, By Component, 2017
Figure 49: Middle East & Africa Location-based Ambient Intelligence Value Share Analysis, By Component, 2027
Figure 50: Middle East & Africa Location-based Ambient Intelligence Value Share Analysis, By Country, 2017
Figure 51: Middle East & Africa Location-based Ambient Intelligence Value Share Analysis, By Country, 2027
Figure 52: South America Location-based Ambient Intelligence Market Revenue (US$ Bn) and Y-o-Y Forecast, 2018– 2026
Figure 53: South America Location-based Ambient Intelligence Market Opportunity Growth Analysis (US$ Bn), 2016 – 2026
Figure 54: South America Location-based Ambient Intelligence Value Share Analysis, By Component, 2017
Figure 55: South America Location-based Ambient Intelligence Value Share Analysis, By Component, 2027
Figure 56: South America Location-based Ambient Intelligence Value Share Analysis, By Country, 2017
Figure 57: South America Location-based Ambient Intelligence Value Share Analysis, By Country, 2027
Figure 58: Huawei Technologies Co., Ltd Breakdown of Net Sales, by Geography, 2018
Figure 59:Huawei Technologies Co., LtdRevenue (US$ Mn) & Y-o-Y Growth (%), 2015–2018
Figure 60: Samsung Electronics Co., Ltd Breakdown of Net Sales, by Segment, 2018
Figure 61: Samsung Electronics Co., Ltd Revenue (US$ Mn) & Y-o-Y Growth (%), 2016–2018
Figure 62: ABB Ltd Breakdown of Net Sales, by Geography, 2017
Figure 63: ABB Ltd Revenue (US$ Mn) & Y-o-Y Growth (%), 2016–2018
Figure 64: Honeywell International Inc Breakdown of Net Sales, by Segment, 2018
Figure 65: Honeywell International Inc Revenue (US$ Mn) & Y-o-Y Growth (%), 2015–2018
Figure 66: Johnson Controls Inc Breakdown of Net Sales, by Segment, 2018
Figure 67: Johnson Controls Inc Revenue (US$ Bn) & Y-o-Y Growth (%), 2015–2018
Figure 68: Nokia Corporation Breakdown of Net Sales, by Geography, 2018
Figure 69: Nokia Corporation Revenue (US$ Mn) & Y-o-Y Growth (%), 2015–2018
Figure 70: Schneider Electric SE Breakdown of Net Sales, by Geography, 2018
Figure 71: Schneider Electric SE Revenue (US$ Bn) & Y-o-Y Growth (%), 2015–2018
Figure 72: Siemens AG Breakdown of Net Sales, by Geography, 2018
Figure 73: Siemens AG Revenue (US$ Mn) & Y-o-Y Growth (%), 2015–2018
Figure 74: Google, LLC Breakdown of Net Sales, by Geography, 2018
Figure 75: Google, LLC Revenue (US$ Mn) & Y-o-Y Growth (%), 2015–2018
Figure 76: HTC Corporation Breakdown of Net Sales, by Geography, 2017
Figure 77: HTC Corporation Revenue (US$ Mn) & Y-o-Y Growth (%), 2017–2018
Copyright © Transparency Market Research, Inc. All Rights reserved
Trust Online

Location-based Ambient Intelligence Market
