Automatic liquid soap dispensing pumps have witnessed increased popularity during the COVID-19 pandemic in order to contain the spread of the novel infection. Companies in the liquid dispensing pump market such as Jaguar are encouraging consumers to invest in automatic soap dispensers, owing to rising concerns about bathroom sanitization and hygiene. Moreover, guidelines by the Centers for Disease Control and Prevention (CDC) emphasize on hand washing as an important practice to prevent exposure to COVID-19.
The growing adoption of the sensor technology and contactless amenities is generating revenue opportunities for companies in the global liquid dispensing pump market. Manufacturers are tapping into long-term growth benefits with innovations in automatic liquid soap dispensing pumps to minimize contact with amenities during hand wash.
Smart and contactless liquid dispensing pumps deliver uniform sanitizer doses and offer modern aesthetics in various facilities. However, their batteries wear down fast and high purchasing cost of automatic liquid dispensing pumps, especially in developing economies such as India are influencing market growth. Hence, companies in the liquid dispensing pump market including OakMist are increasing the availability of DRDO (Defence Research and Development Organisation)-approved automatic touchless hand sanitizer dispensers to overcome its conventional drawbacks.
Manufacturers in the liquid dispensing pump market are increasing their production capabilities for wall mounted and compact liquid dispensers that are easy to use and eliminate contact point for users.
Precise functionality and improved performance have become a prerequisite for manufacturers competing in the largely fragmented liquid dispensing pump market. Raepak - a packaging company in Norwich, England, is recognizing this requirement and gaining proficiency in recycling of containers with stylish designs, embossed pump detailing, and improved performance to meet consumer demands.
Companies in the liquid dispensing pump market are boosting their research in the pump action technology to nearly empty all the liquid from the container. Such technologies help prevent waste of liquids and increase consumer satisfaction. The pump action technology also offers controlled dosage of liquids and enables cost savings for users. The airless pump technology is being highly publicized for incorporating the vacuum and piston in containers to efficiently empty all the liquid from the container.
Personal care and cosmetics are providing stable and long-term revenue streams for stakeholders in the liquid dispensing pump market. However, dropper vials and airless options are emerging as an alternative to liquid dispensing pumps. Hence, manufacturers are adapting to changing needs of consumers with the help of innovations in eCommerce-friendly packaging to expand business streams.
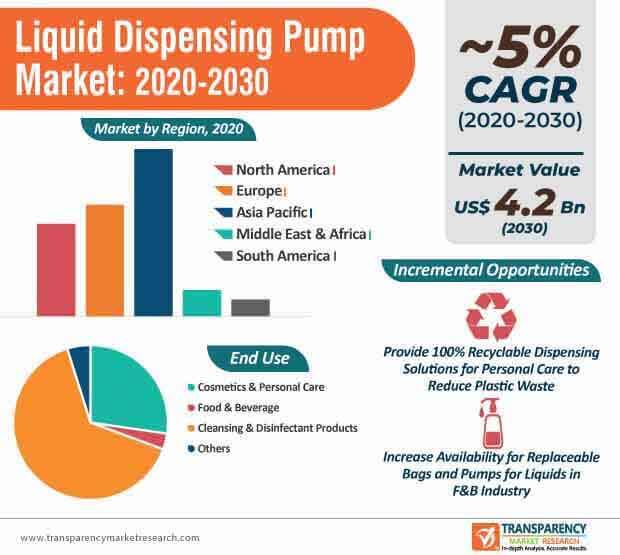
Sustainability and eCommerce-friendly packaging are megatrends in the liquid dispensing pump market. Conscious consumers are opting for 100% recyclable dispensing solutions to reduce plastic waste in the environment. Thus, manufacturers are realizing that there is no one-size-fits-all solution for establishing a true circular economy.
Apart from healthcare and personal care industries, companies in the liquid dispensing pump market are unlocking growth opportunities in the food & beverages (F&B) industry too. Quantex - an innovator in single-use disposable pump technology is leveraging incremental opportunities in the F&B industry in an effort to reduce plastic waste by introducing replaceable bags and pumps. Manufacturers are developing pumps that are attached to the product’s (ketchup, BBQ sauce or sour cream) primary container, which can be emptied and replaced with another bag and pump.
In the F&B industry, manufacturers in the liquid dispensing pump market are incorporating aseptic valve to prevent bacterial ingress for increased hygiene where the pumps can reverse cycle to prevent any dribble after each dispense.
Analysts’ Viewpoint
Contactless and automatic liquid dispensing pumps need improvements in terms of reducing its maintenance cost and battery capacities to establish long-term revenue streams after the coronavirus pandemic subsides. Breakthrough innovations such as highly precise syringe pumps with a touchscreen interface help to quickly dispense fluids in the healthcare landscape. The changing needs of consumers are emerging as one of the major challenges for investment allocation in new technologies, when the earlier becomes less significant. Hence, manufacturers in the liquid dispensing pump market should collaborate with think tanks, researchers, and experts from universities and other institutions to gain proficiency in sustainable and beneficial technologies that help in establishing a truly circular economy.
Section 1. Preface
1.1. Market Definition and Scope
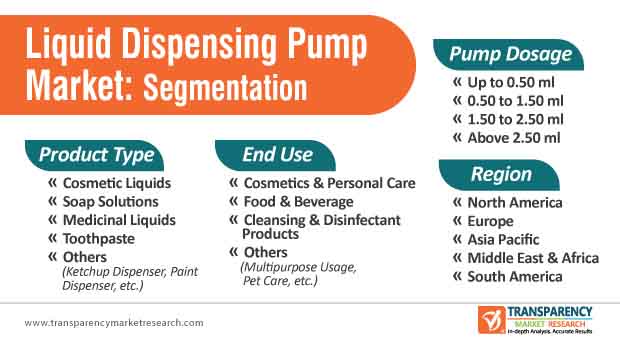
1.2. Market Segmentation
1.3. Key Research Objectives
1.4. Research Highlights
Section 2. Assumptions
Section 3. Research Methodology
Section 4. Executive Summary
Section 5. Global Market Overview
5.1. Introduction
5.2. Market Dynamics
5.2.1. Drivers
5.2.2. Restraints
5.2.3. Opportunities
5.3. Key Trends Analysis
5.3.1. Demand Side Analysis
5.3.2. Supply Side Analysis
5.4. Key Market Indicators
5.4.1. Packaging Industry Overview
5.5. Industry SWOT Analysis
5.6. Porter’s Five Forces Analysis
5.7. Covid-19 Impact Analysis
5.8. Raw Material Analysis
5.9. Technological Overview
5.10. Global Liquid Dispensing Pump Market Analysis and Forecast, 2018 - 2030
5.10.1. Market Revenue Projections (US$ Mn)
5.10.2. Market Revenue Projections (Million Units)
Section 6. Global Liquid Dispensing Pump Market Analysis and Forecast, By Product Type
6.1. Global Liquid Dispensing Pump Market Size (US$ Mn and Million Units) Forecast, By Product Type, 2018 - 2030
6.1.1. Cosmetic Liquids
6.1.2. Soap Solutions
6.1.3. Medicinal Liquids
6.1.4. Toothpaste
6.1.5. Others (Ketchup Dispenser, Paint Dispenser, etc.)
6.2. Incremental Opportunity, By Product Type
Section 7. Global Liquid Dispensing Pump Market Analysis and Forecast, By Pump Dosage
7.1. Global Liquid Dispensing Pump Market Size (US$ Mn and Million Units) Forecast, By Pump Dosage, 2018 - 2030
7.1.1. Up to 0.50 ml
7.1.2. 0.50 TO 1.50 ml
7.1.3. 1.50 to 2.50 ml
7.1.4. Above 2.50 ml
7.2. Incremental Opportunity, By Pump Dosage
Section 8. Global Liquid Dispensing Pump Market Analysis and Forecast, By End-use
8.1. Global Liquid Dispensing Pump Market Size (US$ Mn and Million Units) Forecast, By End-use, 2018 - 2030
8.1.1. Cosmetics & Personal Care
8.1.2. Food & Beverage
8.1.3. Cleansing & Disinfectant Products
8.1.4. Others (Multipurpose Usage, Pet Care, etc.)
8.2. Incremental Opportunity, By End-use
Section 9. Global Liquid Dispensing Pump Market Analysis and Forecast, By Region
9.1. Global Liquid Dispensing Pump Market Size (US$ Mn and Million Units) Forecast, By Region, 2018 - 2030
9.1.1. North America
9.1.2. Europe
9.1.3. Asia Pacific
9.1.4. Middle East & Africa
9.1.5. South America
9.2. Incremental Opportunity, By Region
Section 10. North America Liquid Dispensing Pump Market Analysis and Forecast
10.1. Regional Snapshot
10.2. Market Share analysis-2019 (%)
10.2.1. Top 5 Pumps Manufacturer
10.3. Price Trend Analysis
10.3.1. Weighted Average Selling Price ($)
10.4. COVID-19 Impact analysis
10.5. Key Trends Analysis
10.5.1. Demand Side Analysis
10.5.2. Supply Side Analysis
10.6. Consumer Buying Behavior Analysis
10.6.1. Product Preference
10.6.2. Preferred Capacity
10.6.3. Consumer trends
10.7. List of Competitors for Liquid Dispensing Pumps
10.7.1. By Market Price
10.7.2. By Quantity Sold Per Month
10.8. Trade Analysis
10.8.1. Imports
10.8.1.1. Major Customers, By Key Countries
10.8.2. Export
10.9. Liquid Dispensing Pump Market Size (US$ Mn and Million Units) Forecast, By Product Type, 2018 - 2030
10.9.1. Cosmetic Liquids
10.9.2. Soap Solutions
10.9.3. Medicinal Liquids
10.9.4. Toothpaste
10.9.5. Others (Ketchup Dispenser, Paint Dispenser, etc.)
10.10. Liquid Dispensing Pump Market Size (US$ Mn and Million Units) Forecast, By Pump Dosage, 2018 - 2030
10.10.1. Up to 0.50 ml
10.10.2. 0.50 to 1.50 ml
10.10.3. 1.50 to 2.50 ml
10.10.4. Above 2.50 ml
10.11. Liquid Dispensing Pump Market Size (US$ Mn and Million Units) Forecast, By End-use, 2018 - 2030
10.11.1. Cosmetics & Personal Care
10.11.2. Food & Beverage
10.11.3. Cleansing & Disinfectant Products
10.11.4. Others (Multipurpose Usage, Pet Care, etc.)
10.12. Liquid Dispensing Pump Market Size (US$ Mn and Million Units) Forecast, By Country & Sub-region, 2018 - 2030
10.12.1. U.S.
10.12.2. Canada
10.12.3. Rest of North America
10.13. Incremental Opportunity Analysis
Section 11. Europe Liquid Dispensing Pump Market Analysis and Forecast
11.1. Regional Snapshot
11.2. Market Share analysis-2019 (%)
11.2.1. Top 5 Pumps Manufacturer
11.3. Price Trend Analysis
11.3.1. Weighted Average Selling Price ($)
11.4. COVID-19 Impact analysis
11.5. Key Trends Analysis
11.5.1. Demand Side Analysis
11.5.2. Supply Side Analysis
11.6. Consumer Buying Behavior Analysis
11.6.1. Product Preference
11.6.2. Preferred Capacity
11.6.3. Consumer trends
11.7. List of Competitors for Liquid Dispensing Pump
11.7.1. By Market Price
11.7.2. By Quantity Sold Per Month
11.8. Trade Analysis
11.8.1. Imports
11.8.1.1. Major Customers, By Key Countries
11.8.2. Export
11.9. Liquid Dispensing Pump Market Size (US$ Mn and Million Units) Forecast, By Product Type, 2018 - 2030
11.9.1. Cosmetic Liquids
11.9.2. Soap Solutions
11.9.3. Medicinal Liquids
11.9.4. Toothpaste
11.9.5. Others (Ketchup Dispenser, Paint Dispenser, etc.)
11.10. Liquid Dispensing Pump Market Size (US$ Mn and Million Units) Forecast, By Pump Dosage, 2018 - 2030
11.10.1. Up to 0.50 ml
11.10.2. 0.50 to 1.50 ml
11.10.3. 1.50 to 2.50 ml
11.10.4. Above 2.50 ml
11.11. Liquid Dispensing Pump Market Size (US$ Mn and Million Units) Forecast, By End-use, 2018 - 2030
11.11.1. Cosmetics & Personal Care
11.11.2. Food & Beverage
11.11.3. Cleansing & Disinfectant Products
11.11.3.1. Others (Multipurpose Usage, Pet Care, etc.)
11.12. Liquid Dispensing Pump Market Size (US$ Mn and Million Units) Forecast, By Country & Sub-region, 2018 - 2030
11.12.1. U.K.
11.12.2. Germany
11.12.3. France
11.12.4. Rest of Europe
11.13. Incremental Opportunity Analysis
Section 12. Asia Pacific Liquid Dispensing Pump Market Analysis and Forecast
12.1. Regional Snapshot
12.2. Market Share analysis-2019 (%)
12.2.1. Top 5 Pumps Manufacturer
12.3. Price Trend Analysis
12.3.1. Weighted Average Selling Price ($)
12.4. COVID-19 Impact analysis
12.5. Key Trends Analysis
12.5.1. Demand Side Analysis
12.5.2. Supply Side Analysis
12.6. Consumer Buying Behavior Analysis
12.6.1. Product Preference
12.6.2. Preferred Capacity
12.6.3. Consumer trends
12.7. List of Competitors for Liquid Dispensing Pump
12.7.1. By Market Price
12.7.2. By Quantity Sold Per Month
12.8. Trade Analysis
12.8.1. Imports
12.8.1.1. Major Customers, By Key Countries
12.8.2. Export
12.9. Liquid Dispensing Pump Market Size (US$ Mn and Million Units) Forecast, By Product Type, 2018 - 2030
12.9.1. Cosmetic Liquids
12.9.2. Soap Solutions
12.9.3. Medicinal Liquids
12.9.4. Toothpaste
12.9.5. Others (Ketchup Dispenser, Paint Dispenser, etc.)
12.10. Liquid Dispensing Pump Market Size (US$ Mn and Million Units) Forecast, By Pump Dosage, 2018 - 2030
12.10.1. Up to 0.50 ml
12.10.2. 0.50 to 1.50 ml
12.10.3. 1.50 to 2.50 ml
12.10.4. Above 2.50 ml
12.11. Liquid Dispensing Pump Market Size (US$ Mn and Million Units) Forecast, By End-use, 2018 - 2030
12.11.1. Cosmetics & Personal Care
12.11.2. Food & Beverage
12.11.3. Cleansing & Disinfectant Products
12.11.4. Others (Multipurpose Usage, Pet Care, etc.)
12.12. Liquid Dispensing Pump Market Size (US$ Mn and Million Units) Forecast, By Country & Sub-region, 2018 - 2030
12.12.1. China
12.12.2. India
12.12.3. Japan
12.12.4. Rest of Asia Pacific
12.13. Incremental Opportunity Analysis
Section 13. Middle East & Africa Liquid Dispensing Pump Market Analysis and Forecast
13.1. Regional Snapshot
13.2. Market Share analysis-2019 (%)
13.2.1. Top 5 Pumps Manufacturer
13.3. Price Trend Analysis
13.3.1. Weighted Average Selling Price ($)
13.4. COVID-19 Impact analysis
13.5. Key Trends Analysis
13.5.1. Demand Side Analysis
13.5.2. Supply Side Analysis
13.6. Consumer Buying Behavior Analysis
13.6.1. Product Preference
13.6.2. Preferred Capacity
13.6.3. Consumer trends
13.7. List of Competitors for Liquid Dispensing Pump
13.7.1. By Market Price
13.7.2. By Quantity Sold Per Month
13.8. Trade Analysis
13.8.1. Imports
13.8.1.1. Major Customers, By Key Countries
13.8.2. Export
13.9. Liquid Dispensing Pump Market Size (US$ Mn and Million Units) Forecast, By Product Type, 2018 - 2030
13.9.1. Cosmetic Liquids
13.9.2. Soap Solutions
13.9.3. Medicinal Liquids
13.9.4. Toothpaste
13.9.5. Others (Ketchup Dispenser, Paint Dispenser, etc.)
13.10. Liquid Dispensing Pump Market Size (US$ Mn and Million Units) Forecast, By Pump Dosage, 2018 - 2030
13.10.1. Up to 0.50 ml
13.10.2. 0.50 to 1.50 ml
13.10.3. 1.50 to 2.50 ml
13.10.4. Above 2.50 ml
13.11. Liquid Dispensing Pump Market Size (US$ Mn and Million Units) Forecast, By End-use, 2018 - 2030
13.11.1. Cosmetics & Personal Care
13.11.2. Food & Beverage
13.11.3. Cleansing & Disinfectant Products
13.11.4. Others (Multipurpose Usage, Pet Care, etc.)
13.12. Liquid Dispensing Pump Market Size (US$ Mn and Million Units) Forecast, By Country & Sub-region, 2018 - 2030
13.12.1. GCC
13.12.2. South Africa
13.12.3. Rest of Middle East & Africa
13.13. Incremental Opportunity Analysis
Section 14. South America Liquid Dispensing Pump Market Analysis and Forecast
14.1. Regional Snapshot
14.2. Market Share analysis-2019 (%)
14.2.1. Top 5 Pumps Manufacturer
14.3. Price Trend Analysis
14.3.1. Weighted Average Selling Price ($)
14.4. COVID-19 Impact analysis
14.5. Key Trends Analysis
14.5.1. Demand Side Analysis
14.5.2. Supply Side Analysis
14.6. Consumer Buying Behavior Analysis
14.6.1. Product Preference
14.6.2. Preferred Capacity
14.6.3. Consumer trends
14.7. List of Competitors for Liquid Dispensing Pump
14.7.1. By Market Price
14.7.2. By Quantity Sold Per Month
14.8. Trade Analysis
14.8.1. Imports
14.8.1.1. Major Customers, By Key Countries
14.8.2. Export
14.9. Liquid Dispensing Pump Market Size (US$ Mn and Million Units) Forecast, By Product Type, 2018 - 2030
14.9.1. Cosmetic Liquids
14.9.2. Soap Solutions
14.9.3. Medicinal Liquids
14.9.4. Toothpaste
14.9.5. Others (Ketchup Dispenser, Paint Dispenser, etc.)
14.10. Liquid Dispensing Pump Market Size (US$ Mn and Million Units) Forecast, By Pump Dosage, 2018 - 2030
14.10.1. Up to 0.50 ml
14.10.2. 0.50 to 1.50 ml
14.10.3. 1.50 to 2.50 ml
14.10.4. Above 2.50 ml
14.11. Liquid Dispensing Pump Market Size (US$ Mn and Million Units) Forecast, By End-use, 2018 - 2030
14.11.1. Cosmetics & Personal Care
14.11.2. Food & Beverage
14.11.3. Cleansing & Disinfectant Products
14.11.4. Others (Multipurpose Usage, Pet Care, etc.)
14.12. Liquid Dispensing Pump Market Size (US$ Mn and Million Units) Forecast, By Country & Sub-region, 2018 - 2030
14.12.1. Brazil
14.12.2. Rest of South America
14.13. Incremental Opportunity Analysis
Section 15. Competition Landscape
15.1. Market Player – Competition Dashboard
15.1.1. Market Revenue Share Analysis (%), (2019)-Manufacturer
15.1.2. Market Revenue Share Analysis (%) and Volume Analysis, End-use (2019)
15.1.2.1. Pumps:- P&G, J&J, Loreal, Unilever, Bath and Body Works
15.1.3. Key End user Profiling (Relevant filling sites / location etc., Key suppliers providing pumps and triggers, Turnover and % share of customer’s spends of each supplier for the relevant products)
15.2. Company Profiles (Manufacturers)
15.2.1. Details – (Company Overview, Revenue, Strategy, Manufacturing Plant Capacities, Annual Production and Sales By Product Type, Different SKUs offered (variants by design & by color), Key Clientele, No. of customers and their names, Spend Share For Each Supplier, Capacity Expansion Plans, Innovation, Cost Structure & Business Overview)
15.2.1.1. Technological and Operational Efficiency of Manufacturers (Inventory/Turnaround time)
15.2.1.2. Innovation: Lead time to develop new products, use of recycled products
15.2.1.3. Pricing: any contracts that manufacturers have with their customers, how often are the prices revised
15.2.1.3.1. AptarGroup, Inc.
15.2.1.3.1.1. Company Overview
15.2.1.3.1.2. Revenue
15.2.1.3.1.3. Strategy
15.2.1.3.1.4. Manufacturing Plant Capacities
15.2.1.3.1.5. Annual Production and Sales By Product Type
15.2.1.3.1.6. Different SKUs offered (variants by design & by color)
15.2.1.3.1.7. Key Clientele
15.2.1.3.1.8. No. of customers and their names
15.2.1.3.1.9. Spend Share For Each Supplier
15.2.1.3.1.10. Capacity Expansion Plans
15.2.1.3.1.11. Innovation
15.2.1.3.1.12. Cost Structure & Business Overview
15.2.1.3.2. NingBo Seng CZe Macrospray Co LTD
15.2.1.3.2.1. Company Overview
15.2.1.3.2.2. Revenue
15.2.1.3.2.3. Strategy
15.2.1.3.2.4. Manufacturing Plant Capacities
15.2.1.3.2.5. Annual Production and Sales By Product Type
15.2.1.3.2.6. Different SKUs offered (variants by design & by color)
15.2.1.3.2.7. Key Clientele
15.2.1.3.2.8. No. of customers and their names
15.2.1.3.2.9. Spend Share For Each Supplier
15.2.1.3.2.10. Capacity Expansion Plans
15.2.1.3.2.11. Innovation
15.2.1.3.2.12. Cost Structure & Business Overview
15.2.1.3.3. CLC Co., Ltd.
15.2.1.3.3.1. Company Overview
15.2.1.3.3.2. Revenue
15.2.1.3.3.3. Strategy
15.2.1.3.3.4. Manufacturing Plant Capacities
15.2.1.3.3.5. Annual Production and Sales By Product Type
15.2.1.3.3.6. Different SKUs offered (variants by design & by color)
15.2.1.3.3.7. Key Clientele
15.2.1.3.3.8. No. of customers and their names
15.2.1.3.3.9. Spend Share For Each Supplier
15.2.1.3.3.10. Capacity Expansion Plans
15.2.1.3.3.11. Innovation
15.2.1.3.3.12. Cost Structure & Business Overview
15.2.1.3.4. Yoshino Kogyosho Co., Ltd.
15.2.1.3.4.1. Company Overview
15.2.1.3.4.2. Revenue
15.2.1.3.4.3. Strategy
15.2.1.3.4.4. Manufacturing Plant Capacities
15.2.1.3.4.5. Annual Production and Sales By Product Type
15.2.1.3.4.6. Different SKUs offered (variants by design & by color)
15.2.1.3.4.7. Key Clientele
15.2.1.3.4.8. No. of customers and their names
15.2.1.3.4.9. Spend Share For Each Supplier
15.2.1.3.4.10. Capacity Expansion Plans
15.2.1.3.4.11. Innovation
15.2.1.3.4.12. Cost Structure & Business Overview
15.2.1.3.5. Knida Company Limiteds
15.2.1.3.5.1. Company Overview
15.2.1.3.5.2. Revenue
15.2.1.3.5.3. Strategy
15.2.1.3.5.4. Manufacturing Plant Capacities
15.2.1.3.5.5. Annual Production and Sales By Product Type
15.2.1.3.5.6. Different SKUs offered (variants by design & by color)
15.2.1.3.5.7. Key Clientele
15.2.1.3.5.8. No. of customers and their names
15.2.1.3.5.9. Spend Share For Each Supplier
15.2.1.3.5.10. Capacity Expansion Plans
15.2.1.3.5.11. Innovation
15.2.1.3.5.12. Cost Structure & Business Overview
15.2.1.3.6. RAEPAK LTD
15.2.1.3.6.1. Company Overview
15.2.1.3.6.2. Revenue
15.2.1.3.6.3. Strategy
15.2.1.3.6.4. Manufacturing Plant Capacities
15.2.1.3.6.5. Annual Production and Sales By Product Type
15.2.1.3.6.6. Different SKUs offered (variants by design & by color)
15.2.1.3.6.7. Key Clientele
15.2.1.3.6.8. No. of customers and their names
15.2.1.3.6.9. Spend Share For Each Supplier
15.2.1.3.6.10. Capacity Expansion Plans
15.2.1.3.6.11. Innovation
15.2.1.3.6.12. Cost Structure & Business Overview
15.2.1.3.7. Rieke Packaging Systems Limited
15.2.1.3.7.1. Company Overview
15.2.1.3.7.2. Revenue
15.2.1.3.7.3. Strategy
15.2.1.3.7.4. Manufacturing Plant Capacities
15.2.1.3.7.5. Annual Production and Sales By Product Type
15.2.1.3.7.6. Different SKUs offered (variants by design & by color)
15.2.1.3.7.7. Key Clientele
15.2.1.3.7.8. No. of customers and their names
15.2.1.3.7.9. Spend Share For Each Supplier
15.2.1.3.7.10. Capacity Expansion Plans
15.2.1.3.7.11. Innovation
15.2.1.3.7.12. Cost Structure & Business Overview
15.2.1.3.8. Silgan Dispensing
15.2.1.3.8.1. Company Overview
15.2.1.3.8.2. Revenue
15.2.1.3.8.3. Strategy
15.2.1.3.8.4. Manufacturing Plant Capacities
15.2.1.3.8.5. Annual Production and Sales By Product Type
15.2.1.3.8.6. Different SKUs offered (variants by design & by color)
15.2.1.3.8.7. Key Clientele
15.2.1.3.8.8. No. of customers and their names
15.2.1.3.8.9. Spend Share For Each Supplier
15.2.1.3.8.10. Capacity Expansion Plans
15.2.1.3.8.11. Innovation
15.2.1.3.8.12. Cost Structure & Business Overview
15.2.1.3.9. Tekni-Plex, Inc.
15.2.1.3.9.1. Company Overview
15.2.1.3.9.2. Revenue
15.2.1.3.9.3. Strategy
15.2.1.3.9.4. Manufacturing Plant Capacities
15.2.1.3.9.5. Annual Production and Sales By Product Type
15.2.1.3.9.6. Different SKUs offered (variants by design & by color)
15.2.1.3.9.7. Key Clientele
15.2.1.3.9.8. No. of customers and their names
15.2.1.3.9.9. Spend Share For Each Supplier
15.2.1.3.9.10. Capacity Expansion Plans
15.2.1.3.9.11. Innovation
15.2.1.3.9.12. Cost Structure & Business Overview
15.2.1.3.10. TriMas Corporation
15.2.1.3.10.1. Company Overview
15.2.1.3.10.2. Revenue
15.2.1.3.10.3. Strategy
15.2.1.3.10.4. Manufacturing Plant Capacities
15.2.1.3.10.5. Annual Production and Sales By Product Type
15.2.1.3.10.6. Different SKUs offered (variants by design & by color)
15.2.1.3.10.7. Key Clientele
15.2.1.3.10.8. No. of customers and their names
15.2.1.3.10.9. Spend Share For Each Supplier
15.2.1.3.10.10. Capacity Expansion Plans
15.2.1.3.10.11. Innovation
15.2.1.3.10.12. Cost Structure & Business Overview
Section 16. Key Takeaways
16.1. Identification of Potential Market Spaces
16.1.1. By Product Type
16.1.2. By Pump Dosage
16.1.3. By End-use
16.1.4. By Distribution Channel
16.1.5. By Geography
16.2. Prevailing Market Risks
16.3. Preferred Sales & Marketing Strategy
List of Tables
Table 1: Global Liquid Dispensing Pump Market, Volume Size and Forecast, By Product Type, Million Units, 2018 - 2030
Table 2: Global Liquid Dispensing Pump Market, Value Size and Forecast, By Product Type, US$ Mn, 2018 - 2030
Table 3: Global Liquid Dispensing Pump Market, Volume Size and Forecast, By Pump Dosage, Million Units, 2018 - 2030
Table 4: Global Liquid Dispensing Pump Market, Value Size and Forecast, By Pump Dosage, US$ Mn, 2018 - 2030
Table 5: Global Liquid Dispensing Pump Market, Volume Size and Forecast, By End-use, Million Units, 2018 - 2030
Table 6: Global Liquid Dispensing Pump Market, Value Size and Forecast, By End-use, US$ Mn, 2018 - 2030
Table 7: Global Liquid Dispensing Pump Market, Volume Size and Forecast, By Region, Million Units, 2018 - 2030
Table 8: Global Liquid Dispensing Pump Market, Value Size and Forecast, By Region, US$ Mn, 2018 - 2030
Table 9: North America Liquid Dispensing Pump Market, Volume Size and Forecast, By Product Type, Million Units, 2018 - 2030
Table 10: North America Liquid Dispensing Pump Market, Value Size and Forecast, By Product Type, US$ Mn, 2018 - 2030
Table 11: North America Liquid Dispensing Pump Market, Volume Size and Forecast, By Pump Dosage, Million Units, 2018 - 2030
Table 12: North America Liquid Dispensing Pump Market, Value Size and Forecast, By Pump Dosage, US$ Mn, 2018 - 2030
Table 13: North America Liquid Dispensing Pump Market, Volume Size and Forecast, By End-use, Million Units, 2018 - 2030
Table 14: North America Liquid Dispensing Pump Market, Value Size and Forecast, By End-use, US$ Mn, 2018 - 2030
Table 15: North America Liquid Dispensing Pump Market, Volume Size and Forecast, By Country, Million Units, 2018 - 2030
Table 16: North America Liquid Dispensing Pump Market, Value Size and Forecast, By Country, US$ Mn, 2018 - 2030
Table 17: Europe Liquid Dispensing Pump Market, Volume Size and Forecast, By Product Type, Million Units, 2018 - 2030
Table 18: Europe Liquid Dispensing Pump Market, Value Size and Forecast, By Product Type, US$ Mn, 2018 - 2030
Table 19: Europe Liquid Dispensing Pump Market, Volume Size and Forecast, By Pump Dosage, Million Units, 2018 - 2030
Table 20: Europe Liquid Dispensing Pump Market, Value Size and Forecast, By Pump Dosage, US$ Mn, 2018 - 2030
Table 21: Europe Liquid Dispensing Pump Market, Volume Size and Forecast, By End-use, Million Units, 2018 - 2030
Table 22: Europe Liquid Dispensing Pump Market, Value Size and Forecast, By End-use, US$ Mn, 2018 - 2030
Table 23: Europe Liquid Dispensing Pump Market, Volume Size and Forecast, By Country, Million Units, 2018 - 2030
Table 24: Europe Liquid Dispensing Pump Market, Value Size and Forecast, By Country, US$ Mn, 2018 - 2030
Table 25: Asia Pacific Liquid Dispensing Pump Market, Volume Size and Forecast, By Product Type, Million Units, 2018 - 2030
Table 26: Asia Pacific Liquid Dispensing Pump Market, Value Size and Forecast, By Product Type, US$ Mn, 2018 - 2030
Table 27: Asia Pacific Liquid Dispensing Pump Market, Volume Size and Forecast, By Pump Dosage, Million Units, 2018 - 2030
Table 28: Asia Pacific Liquid Dispensing Pump Market, Value Size and Forecast, By Pump Dosage, US$ Mn, 2018 - 2030
Table 29: Asia Pacific Liquid Dispensing Pump Market, Volume Size and Forecast, By End-use, Million Units, 2018 - 2030
Table 30: Asia Pacific Liquid Dispensing Pump Market, Value Size and Forecast, By End-use, US$ Mn, 2018 - 2030
Table 31: Asia Pacific Liquid Dispensing Pump Market, Volume Size and Forecast, By Country, Million Units, 2018 - 2030
Table 32: Asia Pacific Liquid Dispensing Pump Market, Value Size and Forecast, By Country, US$ Mn, 2018 - 2030
Table 33: Middle East & Africa Liquid Dispensing Pump Market, Volume Size and Forecast, By Product Type, Million Units, 2018 - 2030
Table 34: Middle East & Africa Liquid Dispensing Pump Market, Value Size and Forecast, By Product Type, US$ Mn, 2018 - 2030
Table 35: Middle East & Africa Liquid Dispensing Pump Market, Volume Size and Forecast, By Pump Dosage, Million Units, 2018 - 2030
Table 36: Middle East & Africa Liquid Dispensing Pump Market, Value Size and Forecast, By Pump Dosage, US$ Mn, 2018 - 2030
Table 37: Middle East & Africa Liquid Dispensing Pump Market, Volume Size and Forecast, By End-use, Million Units, 2018 - 2030
Table 38: Middle East & Africa Liquid Dispensing Pump Market, Value Size and Forecast, By End-use, US$ Mn, 2018 - 2030
Table 39: Middle East & Africa Liquid Dispensing Pump Market, Volume Size and Forecast, By Country, Million Units, 2018 - 2030
Table 40: Middle East & Africa Liquid Dispensing Pump Market, Value Size and Forecast, By Country, US$ Mn, 2018 - 2030
Table 41: South America Liquid Dispensing Pump Market, Volume Size and Forecast, By Product Type, Million Units, 2018 - 2030
Table 42: South America Liquid Dispensing Pump Market, Value Size and Forecast, By Product Type, US$ Mn, 2018 - 2030
Table 43: South America Liquid Dispensing Pump Market, Volume Size and Forecast, By Pump Dosage, Million Units, 2018 - 2030
Table 44: South America Liquid Dispensing Pump Market, Value Size and Forecast, By Pump Dosage, US$ Mn, 2018 - 2030
Table 45: South America Liquid Dispensing Pump Market, Volume Size and Forecast, By End-use, Million Units, 2018 - 2030
Table 46: South America Liquid Dispensing Pump Market, Value Size and Forecast, By End-use, US$ Mn, 2018 - 2030
Table 47: South America Liquid Dispensing Pump Market, Volume Size and Forecast, By Country, Million Units, 2018 - 2030
Table 48: South America Liquid Dispensing Pump Market, Value Size and Forecast, By Country, US$ Mn, 2018 - 2030
List of Figures
Figure 1: Global Liquid Dispensing Pump Market, Volume Size and Forecast, By Product Type, Million Units, 2018 - 2030
Figure 2: Global Liquid Dispensing Pump Market, Value Size and Forecast, By Product Type, US$ Mn, 2018 - 2030
Figure 3: Global Liquid Dispensing Pump Market, Incremental Opportunity, By Product Type, US$ Mn, 2020 - 2030
Figure 4: Global Liquid Dispensing Pump Market, Volume Size and Forecast, By Pump Dosage, Million Units, 2018 - 2030
Figure 5: Global Liquid Dispensing Pump Market, Value Size and Forecast, By Pump Dosage, US$ Mn, 2018 - 2030
Figure 6: Global Liquid Dispensing Pump Market, Incremental Opportunity, By Pump Dosage, US$ Mn, 2020 - 2030
Figure 7: Global Liquid Dispensing Pump Market, Volume Size and Forecast, By End-use, Million Units, 2018 - 2030
Figure 8: Global Liquid Dispensing Pump Market, Value Size and Forecast, By End-use, US$ Mn, 2018 - 2030
Figure 9: Global Liquid Dispensing Pump Market, Incremental Opportunity, By End-use, US$ Mn, 2020 - 2030
Figure 10: Global Liquid Dispensing Pump Market, Volume Size and Forecast, By Region, Million Units, 2018 - 2030
Figure 11: Global Liquid Dispensing Pump Market, Value Size and Forecast, By Region, US$ Mn, 2018 - 2030
Figure 12: Global Liquid Dispensing Pump Market, Incremental Opportunity, By Region, US$ Mn, 2020 - 2030
Figure 13: North America Liquid Dispensing Pump Market, Volume Size and Forecast, By Product Type, Million Units, 2018 - 2030
Figure 14: North America Liquid Dispensing Pump Market, Value Size and Forecast, By Product Type, US$ Mn, 2018 - 2030
Figure 15: North America Liquid Dispensing Pump Market, Incremental Opportunity, By Product Type, US$ Mn, 2020 - 2030
Figure 16: North America Liquid Dispensing Pump Market, Volume Size and Forecast, By Pump Dosage, Million Units, 2018 - 2030
Figure 17: North America Liquid Dispensing Pump Market, Value Size and Forecast, By Pump Dosage, US$ Mn, 2018 - 2030
Figure 18: North America Liquid Dispensing Pump Market, Incremental Opportunity, By Pump Dosage, US$ Mn, 2020 - 2030
Figure 19: North America Liquid Dispensing Pump Market, Volume Size and Forecast, By End-use, Million Units, 2018 - 2030
Figure 20: North America Liquid Dispensing Pump Market, Value Size and Forecast, By End-use, US$ Mn, 2018 - 2030
Figure 21: North America Liquid Dispensing Pump Market, Incremental Opportunity, By End-use, US$ Mn, 2020 - 2030
Figure 22: North America Liquid Dispensing Pump Market, Volume Size and Forecast, By Country, Million Units, 2018 - 2030
Figure 23: North America Liquid Dispensing Pump Market, Value Size and Forecast, By Country, US$ Mn, 2018 - 2030
Figure 24: North America Liquid Dispensing Pump Market, Incremental Opportunity, By Country, US$ Mn, 2020 - 2030
Figure 25: Europe Liquid Dispensing Pump Market, Volume Size and Forecast, By Product Type, Million Units, 2018 - 2030
Figure 26: Europe Liquid Dispensing Pump Market, Value Size and Forecast, By Product Type, US$ Mn, 2018 - 2030
Figure 27: Europe Liquid Dispensing Pump Market, Incremental Opportunity, By Product Type, US$ Mn, 2020 - 2030
Figure 28: Europe Liquid Dispensing Pump Market, Volume Size and Forecast, By Pump Dosage, Million Units, 2018 - 2030
Figure 29: Europe Liquid Dispensing Pump Market, Value Size and Forecast, By Pump Dosage, US$ Mn, 2018 - 2030
Figure 30: Europe Liquid Dispensing Pump Market, Incremental Opportunity, By Pump Dosage, US$ Mn, 2020 - 2030
Figure 31: Europe Liquid Dispensing Pump Market, Volume Size and Forecast, By End-use, Million Units, 2018 - 2030
Figure 32: Europe Liquid Dispensing Pump Market, Value Size and Forecast, By End-use, US$ Mn, 2018 - 2030
Figure 33: Europe Liquid Dispensing Pump Market, Incremental Opportunity, By End-use, US$ Mn, 2020 - 2030
Figure 34: Europe Liquid Dispensing Pump Market, Volume Size and Forecast, By Country, Million Units, 2018 - 2030
Figure 35: Europe Liquid Dispensing Pump Market, Value Size and Forecast, By Country, US$ Mn, 2018 - 2030
Figure 36: Europe Liquid Dispensing Pump Market, Incremental Opportunity, By Country, US$ Mn, 2020 - 2030
Figure 37: Asia Pacific Liquid Dispensing Pump Market, Volume Size and Forecast, By Product Type, Million Units, 2018 - 2030
Figure 38: Asia Pacific Liquid Dispensing Pump Market, Value Size and Forecast, By Product Type, US$ Mn, 2018 - 2030
Figure 39: Asia Pacific Liquid Dispensing Pump Market, Incremental Opportunity, By Product Type, US$ Mn, 2020 - 2030
Figure 40: Asia Pacific Liquid Dispensing Pump Market, Volume Size and Forecast, By Pump Dosage, Million Units, 2018 - 2030
Figure 41: Asia Pacific Liquid Dispensing Pump Market, Value Size and Forecast, By Pump Dosage, US$ Mn, 2018 - 2030
Figure 42: Asia Pacific Liquid Dispensing Pump Market, Incremental Opportunity, By Pump Dosage, US$ Mn, 2020 - 2030
Figure 43: Asia Pacific Liquid Dispensing Pump Market, Volume Size and Forecast, By End-use, Million Units, 2018 - 2030
Figure 44: Asia Pacific Liquid Dispensing Pump Market, Value Size and Forecast, By End-use, US$ Mn, 2018 - 2030
Figure 45: Asia Pacific Liquid Dispensing Pump Market, Incremental Opportunity, By End-use, US$ Mn, 2020 - 2030
Figure 46: Asia Pacific Liquid Dispensing Pump Market, Volume Size and Forecast, By Country, Million Units, 2018 - 2030
Figure 47: Asia Pacific Liquid Dispensing Pump Market, Value Size and Forecast, By Country, US$ Mn, 2018 - 2030
Figure 48: Asia Pacific Liquid Dispensing Pump Market, Incremental Opportunity, By Country, US$ Mn, 2020 - 2030
Figure 49: Middle East & Africa Liquid Dispensing Pump Market, Volume Size and Forecast, By Product Type, Million Units, 2018 - 2030
Figure 50: Middle East & Africa Liquid Dispensing Pump Market, Value Size and Forecast, By Product Type, US$ Mn, 2018 - 2030
Figure 51: Middle East & Africa Liquid Dispensing Pump Market, Incremental Opportunity, By Product Type, US$ Mn, 2020 - 2030
Figure 52: Middle East & Africa Liquid Dispensing Pump Market, Volume Size and Forecast, By Pump Dosage, Million Units, 2018 - 2030
Figure 53: Middle East & Africa Liquid Dispensing Pump Market, Value Size and Forecast, By Pump Dosage, US$ Mn, 2018 - 2030
Figure 54: Middle East & Africa Liquid Dispensing Pump Market, Incremental Opportunity, By Pump Dosage, US$ Mn, 2020 - 2030
Figure 55: Middle East & Africa Liquid Dispensing Pump Market, Volume Size and Forecast, By End-use, Million Units, 2018 - 2030
Figure 56: Middle East & Africa Liquid Dispensing Pump Market, Value Size and Forecast, By End-use, US$ Mn, 2018 - 2030
Figure 57: Middle East & Africa Liquid Dispensing Pump Market, Incremental Opportunity, By End-use, US$ Mn, 2020 - 2030
Figure 58: Middle East & Africa Liquid Dispensing Pump Market, Volume Size and Forecast, By Country, Million Units, 2018 - 2030
Figure 59: Middle East & Africa Liquid Dispensing Pump Market, Value Size and Forecast, By Country, US$ Mn, 2018 - 2030
Figure 60: Middle East & Africa Liquid Dispensing Pump Market, Incremental Opportunity, By Country, US$ Mn, 2020 - 2030
Figure 61: South America Liquid Dispensing Pump Market, Volume Size and Forecast, By Product Type, Million Units, 2018 - 2030
Figure 62: South America Liquid Dispensing Pump Market, Value Size and Forecast, By Product Type, US$ Mn, 2018 - 2030
Figure 63: South America Liquid Dispensing Pump Market, Incremental Opportunity, By Product Type, US$ Mn, 2020 - 2030
Figure 64: South America Liquid Dispensing Pump Market, Volume Size and Forecast, By Pump Dosage, Million Units, 2018 - 2030
Figure 65: South America Liquid Dispensing Pump Market, Value Size and Forecast, By Pump Dosage, US$ Mn, 2018 - 2030
Figure 66: South America Liquid Dispensing Pump Market, Incremental Opportunity, By Pump Dosage, US$ Mn, 2020 - 2030
Figure 67: South America Liquid Dispensing Pump Market, Volume Size and Forecast, By End-use, Million Units, 2018 - 2030
Figure 68: South America Liquid Dispensing Pump Market, Value Size and Forecast, By End-use, US$ Mn, 2018 - 2030
Figure 69: South America Liquid Dispensing Pump Market, Incremental Opportunity, By End-use, US$ Mn, 2020 - 2030
Figure 70: South America Liquid Dispensing Pump Market, Volume Size and Forecast, By Country, Million Units, 2018 - 2030
Figure 71: South America Liquid Dispensing Pump Market, Value Size and Forecast, By Country, US$ Mn, 2018 - 2030
Figure 72: South America Liquid Dispensing Pump Market, Incremental Opportunity, By Country, US$ Mn, 2020 - 2030
Copyright © Transparency Market Research, Inc. All Rights reserved
Trust Online

Liquid Dispensing Pump Market
