Lactose Market: Consumers’ Search for ‘Added Nutrition’ to Create Promising Opportunities
Lactose has been attracting the interest of the nutraceuticals and pharmaceuticals industry in recent times, as the global demographic continued to embrace the health & wellness trend. Our latest research finds that sales of lactose grew in excess of US$ 1.5 billion in 2018, and are set to record a Y-o-Y growth of over 3.5% in 2019. As the consumers’ quest for consuming more nutrition outside of their routine food grows, lactose evolves as the only source of galactose that meets the neural and immunological requirements of consumers. However, the fact that lactose intolerance found in millions of consumers dims the otherwise impressive scramble of lactose, which remains an uphill battle for the lactose manufacturers.
Lactose Market to Harvest Opportunities Sown by Customization of Products and Watered by ‘On-the-Go’ Culture
Surge in the demand for lactose in food and beverages industries cannot be ruled out as trends of customized products continue to accelerate the already robust traction. Recent studies in dairy science and manufacturing technologies have paved way for the development of better, safer, and economical lactose-based solutions, which resonate with evolving preferences of consumers. Efforts of lactose manufacturers to alter the carbohydrate, fat, and cholesterol levels in dairy products that cater to specific consumer demands, will continue favor growth of the lactose market
The fitness trend has been on a notable rise, and more individuals have been partaking in sports and physical activities, be it to meet the weight loss goals or improve endurance. Additionally, focus on ‘taste’ and ‘flavor’ has been moving them past the consumption of milk and streaming a new trend of calcium-fortified beverages induced with lactose. This trend syncs with the ‘on-the-go’ culture adopted by consumers as beverages such as fruit juices, soya milk, soft drinks, sports drink, and even water can undergo the calcium fortification process with contents of lactose.
Calcium-fortified beverages have received a green signal from consumers, and manufacturers operating in food and beverages industry are inspired to expend more efforts towards the diversification of their lactose-based products; preserves and spreads are their latest offerings with lactose.
Lactose Sales in North America Buoyed by Growing Consumer Consciousness on Beauty & Health
Concentration of dietary supplements industry in North America and Europe has played a pivotal role in underpinning the growth of lactose market. Consumers’ behavior of ditching the conventional dairy products for their daily recommended nutrition intake has expended lactose manufacturers’ effort towards making the intake of nutrition as easy as popping a pill, which is received well by consumers of the region. Apart from adult nutrition, lactose has even touched the child nutrition arena with the development of infant formula that caters to the dual-working household demography. Consistent efforts put forth by lactose manufacturers to upgrade their infant nutrition products by offering the ease of swallowing and enhancing taste that closely mimics the human milk are seamlessly strengthening the customer base for the lactose market.
As ‘eat to look fit’ mantra has caused a transition among consumers towards dietary supplements, F&B and cosmetics industries are enumerating applications for lactose. Concerns apropos of dietary fat and cholesterol have caused a switch from conventionally consumed milk to processed milk and dairy products that are altered with only the required nutrients and lactose forms it very basis. This has offered leeway to manufacturers for fostering product innovation by launching ‘consumer-centric’ lactose-induced food and beverages. Marketing becomes effortless for lactose-based products as awareness regarding the anti-aging benefits of lactose either availed by consumption or application on the skin and hair grows among consumers.
Multiple Players, Different Strategies, One Target - Competition Intensity to Turn up a Notch in Lactose Market
The competition present in the lactose market is at multiple levels. The top spots in the market are occupied by a handful of global players that account for a sizeable share of about 40-50%. With a view to armor their position in the market, quality remains their key weapon and the competition remains less intense in the top space. Collaborations with regional suppliers and distributors aid them to strengthen and widen their customer base. In contrast, players constituting the other tiers are investing to multiply their R&D centers and create an appealing product portfolio. Considering the broad scope of application that lactose boasts currently and the pace at which innovations are fueled, it is likely that the competition in the lactose market will only become intense during the forecast period.
The companies profiled in this study include BASF SE, E.I. du Pont de Nemours and Company, Fonterra Co-Operative Group Ltd., Glanbia Plc, Kerry Plc, Merck KGaA, Koninklijke FrieslandCampina N.V., Agropur Co-Operative, Alpavit Käserei Champignon Hofmeister GmbH & Co. KG, Avantor, Inc., Arla Foods, Tnuva Group, Zeria Pharmaceutical Co., Ltd., Hilmar Cheese Company, Inc., Hoogwegt Groep B.V., Meggle Group, Armor Pharma, Lactose Limited, Milei GmbH, Proliant Inc., Saputo Inc., and Tatua Co-Operative Dairy Company Ltd.
Lactose Market is expected to reach US$ 2,697.3 Mn in 2029
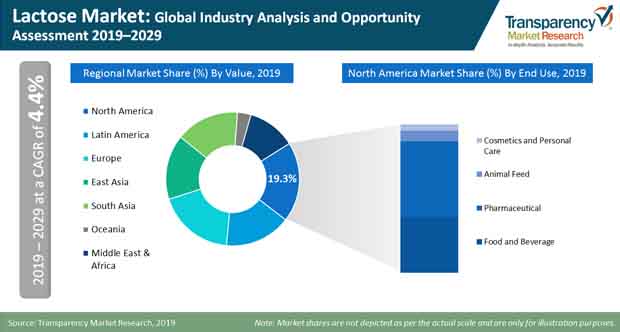
Lactose Market is estimated to rise at a CAGR of 4.4% during forecast period
Rising demand for lactose in food and beverages industries is expected to drive the Lactose Market
North America is more attractive for vendors in the Lactose Market
Key players of Lactose Market are BASF SE, E.I. du Pont de Nemours and Company, Fonterra Co-Operative Group Ltd., Glanbia Plc, Kerry Plc, Merck KGaA, Koninklijke FrieslandCampina N.V., Agropur Co-Operative, Alpavit Käserei Champignon Hofmeister GmbH & Co. KG, Avantor, Inc., Arla Foods, Tnuva Group, Zeria Pharmaceutical Co., Ltd., Hilmar Cheese Company, Inc., Hoogwegt Groep B.V., Meggle Group, Armor Pharma, Lactose Limited, Milei GmbH, Proliant Inc., Saputo Inc., and Tatua Co-Operative Dairy Comp
1. Global Lactose Market - Executive Summary
1.1. Global Lactose Market Country Analysis
1.2. Vertical Specific Market Penetration
1.3. Application – Product Mapping
1.4. Opportunity Assessment- Winning & Loosing Components
1.5. Proprietary Wheel of Fortune
1.6. TMR Analysis and Recommendations
2. Market Overview
2.1. Market Introduction
2.2. Market Definition
2.3. Market Taxonomy
3. Market Tendencies & Latest Buzz
3.1. Frugality: Product habit or passing fad?
3.2. Attractive segments for all
3.3. Transformed product attribute
3.4. Product and strategy in-synced
3.5. Anchoring potential markets
3.6. International Harmonization
4. Product Launch Track & Trends
4.1. Key Product Launches in last three years
4.2. Product launch frequency
4.3. Type of launches
4.4. Regions and countries in focus
4.5. Available alternatives
5. Risk, Marketing and STP Analysis
5.1. Associated Risk
5.1.1. Pertaining to regulatory framework and approvals
5.1.2. Related to standards and certifications for health concerns
5.1.3. Increasing supply chain volatility
5.1.4. Omni Channel & 21st Century Retailing
5.2. Opportunity
5.2.1. Innovative advertisement campaign
5.2.2. Untapped emerging market
5.2.3. Integrated market strategies
5.2.4. Price and Product Differentiation strategies
6. Market Dynamics
6.1. Macro-economic Factors
6.1.1. Rise in Consumption of Food Items across Globe
6.1.2. Global and Regional Per Capita Food Consumption (kcal per capita per day)
6.1.3. Population of Key Countries
6.1.4. Food and Beverage Industry Overview
6.1.5. Business Environment Outlook
6.1.6. Regional Production Vs. Consumption Outlook
6.1.7. Global Modern Trade Penetration and Grocery Market by Key Countries
6.1.8. Change in Consumer Price Indexes (Percentage Change) 2019 (Forecast)
6.1.9. Global Retail Dynamics
6.1.10. Global Trade Scenario
6.2. Trend Analysis- Impact on Time Line (2019-2029)
6.3. Forecast Factors - Relevance & Impact
6.3.1. Dairy Production Outlook
6.3.2. Trade Tariffs and Regulation Outlook
6.3.3. Production/Processing Capacity Growth
6.3.4. Pharmaceutical Industry Outlook
6.4. Market Dynamics
6.4.1. Drivers
6.4.2. Restraints
6.4.3. Opportunity
7. Key Regulations and Claims
7.1. Regulation by Region
7.2. FDA/USDA Regulation
7.3. Food Packaging Claims
7.4. Labeling and Claims
7.5. Import/Export Regulations
8. What to expect: The Winning Recipe & Challenges Assessment
8.1. Product Positioning Metrics
8.2. Product Utilization in High-Growth End Use Applications
8.3. Quality Certifications and Claims Impact Analysis
9. Supply Chain Analysis
9.1. Profitability Margin Analysis
9.2. List of Active Market Participants
9.2.1. List of Key Manufacturers
9.2.2. List of End User Companies
10. Global Lactose Market Pricing Analysis
10.1. Price Point Assessment by Nature
10.2. Regional Average Pricing Analysis
10.2.1. North America
10.2.2. Latin America
10.2.3. Europe
10.2.4. East Asia
10.2.5. South Asia
10.2.6. Oceania
10.2.7. Middle East & Africa
10.3. Price Forecast till 2029
10.4. Factors Influencing Pricing
11. Global Lactose Market Analysis and Forecast
11.1. Market Size Analysis (2014-2018) and Forecast (2019-2029)
11.1.1. Market Value (US$ Mn) and Volume (Tons) and Y-o-Y Growth
11.1.2. Absolute $ Opportunity
11.2. Global Lactose Market Scenario Forecast (Optimistic, Likely and Conservative Market Conditions)
11.2.1. Forecast Factors and Relevance of Impact
11.2.2. Regional Lactose Market Business Performance Summary
12. Global Lactose Market Analysis Form
12.1. Introduction
12.1.1. Y-o-Y Growth Comparison Form
12.1.2. Basis Point Share (BPS) Analysis Form
12.2. Lactose Market Size (US$ Mn) and Volume (MT) Analysis (2014-2018) & Forecast (2019-2029) Form
12.2.1. Powder
12.2.2. Granule
12.3. Market Attractiveness Analysis Form
13. Global Lactose Market Analysis By End Use
13.1. Introduction
13.1.1. Y-o-Y Growth Comparison By End Use
13.1.2. Basis Point Share (BPS) Analysis By End Use
13.2. Lactose Market Size (US$ Mn) and Volume (MT) Analysis (2014-2018) & Forecast (2019-2029) By End Use
13.2.1. Food and Beverage
13.2.2.1. Bakery
13.2.2.2. Confectionery
13.2.2.3. Functional Food
13.2.2. Pharmaceutical
13.2.3. Animal Feed
13.2.4. Cosmetics and Personal Care
13.3. Market Attractiveness Analysis By End Use
14. Global Lactose Market Analysis and Forecast, By Region
14.1. Introduction
14.1.1. Basis Point Share (BPS) Analysis By Region
14.1.2. Y-o-Y Growth Projections By Region
14.2. Lactose Market Size (US$ Mn) and Volume (MT) & Forecast (2019-2029) Analysis By Region
14.2.1. North America
14.2.2. Latin America
14.2.3. Europe
14.2.4. East Asia
14.2.5. South Asia
14.2.6. Oceania
14.2.7. Middle East and Africa
14.3. Market Attractiveness Analysis By Region
15. North America Lactose Market Analysis and Forecast
15.1. Introduction
15.1.1. Basis Point Share (BPS) Analysis By Country
15.1.2. Y-o-Y Growth Projections By Country
15.2. Lactose Market Size (Value (US$) and Volume (MT) Analysis (2014-2018) and Forecast (2019-2029)
15.2.1. Market Attractiveness By Country
15.2.1.1. U.S.
15.2.1.2. Canada
15.2.2. By Form
15.2.3. By End Use
15.3. Market Attractiveness Analysis
15.3.1. By Country
15.3.2. By Form
15.3.3. By End Use
15.4. Drivers and Restraints: Impact Analysis
16. Latin America Lactose Market Analysis and Forecast
16.1. Introduction
16.1.1. Basis Point Share (BPS) Analysis By Country
16.1.2. Y-o-Y Growth Projections By Country
16.1.3. Key Regulations
16.2. Lactose Market Size (Value (US$) and Volume (MT) Analysis (2014-2018) and Forecast (2019-2029)
16.2.1. By Country
16.2.1.1. Brazil
16.2.1.2. Mexico
16.2.1.3. Chile
16.2.1.4. Peru
16.2.1.5. Argentina
16.2.1.6. Rest of Latin America
16.2.2. By Product Type
16.2.3. By Application
16.3. Market Attractiveness Analysis
16.3.1. By Country
16.3.2. By Form
16.3.3. By End Use
16.4. Drivers and Restraints: Impact Analysis
17. Europe Lactose Market Analysis and Forecast
17.1. Introduction
17.1.1. Basis Point Share (BPS) Analysis By Country
17.1.2. Y-o-Y Growth Projections By Country
17.1.3. Key Regulations
17.2. Lactose Market Size (Value (US$) and Volume (MT) Analysis (2014-2018) and Forecast (2019-2029)
17.2.1. By Country
17.2.1.1. Poland
17.2.1.2. Germany
17.2.1.3. Italy
17.2.1.4. Spain
17.2.1.5. France
17.2.1.3. U.K.
17.2.1.4. BENELUX
17.2.1.5. Nordic
17.2.1.6. Russia
17.2.1.7. Rest of Europe
17.2.2. By Form
17.2.3. By End Use
17.3. Market Attractiveness Analysis
17.3.1. By Country
17.3.2. By Form
17.3.3. By End Use
17.4. Drivers and Restraints: Impact Analysis
18. East Asia Lactose Market Analysis and Forecast
18.1. Introduction
18.1.1. Basis Point Share (BPS) Analysis By Country
18.1.2. Y-o-Y Growth Projections By Country
18.1.3. Key Regulations
18.2. Lactose Market Size (Value (US$) and Volume (MT) Analysis (2014-2018) and Forecast (2019-2029)
18.2.1. By Country
18.2.1.1. China
18.2.1.2. Japan
18.2.1.3. South Korea
18.2.2. By Form
18.2.3. By End Use
18.3. Market Attractiveness Analysis
18.3.1. By Country
18.3.2. By Form
18.3.3. By End Use
19.4. Drivers and Restraints: Impact Analysis
19. South Asia Lactose Market Analysis and Forecast
19.1. Introduction
19.1.1. Basis Point Share (BPS) Analysis By Country
19.1.2. Y-o-Y Growth Projections By Country
19.1.3. Key Regulations
19.2. Lactose Market Size (Value (US$) and Volume (MT) Analysis (2014-2018) and Forecast (2019-2029)
19.2.1. By Country
19.2.1.1. Indonesia
19.2.1.2. Malaysia
19.2.1.3. Singapore
19.2.1.4. India
19.2.1.5. Taiwan
19.2.1.6. Thailand
19.2.1.7. Rest of South Asia
19.2.2. By Form
19.2.3. By End Use
19.3. Market Attractiveness Analysis
19.3.1. By Country
19.3.2. By Form
19.3.3. By End Use
19.4. Drivers and Restraints: Impact Analysis
20. Oceania Lactose Market Analysis and Forecast
20.1. Introduction
20.1.1. Basis Point Share (BPS) Analysis By Country
20.1.2. Y-o-Y Growth Projections By Country
20.1.3. Key Regulations
20.2. Lactose Market Size (Value (US$) and Volume (MT) Analysis (2014-2018) and Forecast (2019-2029)
20.2.1. By Country
20.2.1.1. Australia
20.2.1.2. New Zealand
20.2.2. By Form
20.2.3. By End Use
20.3. Market Attractiveness Analysis
20.3.1. By Country
20.3.2. By Application
20.3.3. By End Use
20.4. Drivers and Restraints: Impact Analysis
21. Middle East and Africa (MEA) Lactose Market Analysis and Forecast
21.1. Introduction
21.1.1. Basis Point Share (BPS) Analysis By Country
21.1.2. Y-o-Y Growth Projections By Country
21.1.3. Key Regulations
21.2. Lactose Market Size (Value (US$) and Volume (MT) Analysis (2014-2018) and Forecast (2019-2029)
21.2.1. By Country
21.2.1.1. Turkey
21.2.1.2. GCC
21.2.1.3. South Africa
21.2.1.4. Rest of MEA
21.2.2. By Form
21.2.3. By End Use
21.3. Market Attractiveness Analysis
21.3.1. By Country
21.3.2. By Form
21.3.3. By End Use
21.4. Drivers and Restraints: Impact Analysis
21.5. Drivers and Restraints: Impact Analysis
22. Competition Assessment
22.1. Global Lactose Market Competition - a Dashboard View
22.2. Global Lactose Market Structure Analysis
22.3. Global Lactose Market Company Share Analysis
22.3.1. For Tier 1 Market Players, 2018
22.3.2. Company Market Share Analysis of Top 10 Players, By Region
23. Brand Assessment
23.1. Brand Identity (Brand as Product, Brand as Organization, Brand as Person, Brand as Symbol)
23.2. Lactose Audience and Positioning (Demographic Segmentation, Geographic Segmentation, Psychographic Segmentation, Situational Segmentation)
23.3. Brand Strategy
24. Competition Deep-dive (Manufacturers/Suppliers)
24.1. Friesland Foods Domo
24.1.1. Overview
24.1.2. Product Portfolio
24.1.3. Sales Footprint
24.1.4. Production Footprint
24.1.5. Channel Footprint
24.1.5.1. Distributors List
24.1.5.2. Sales Channel (Clients)
24.1.6. Strategy Overview
24.1.6.1. Marketing Strategy
24.1.6.2. Culture Strategy
24.1.6.3. Channel Strategy
24.1.7. SWOT Analysis
24.1.8. Financial Analysis
24.1.9. Revenue Share
24.1.9.1. By Formulation Type
24.1.9.2. By Region
24.1.10. Key Clients
24.1.11. Analyst Comments
24.2. Agropur Inc.
24.3. Alpavit Käserei Champignon Hofmeister GmbH & Co. KG
24.4. Armor Pharma
24.5. Avantor, Inc.
24.6. Arla Food
24.7. Ba'emek Advanced Technologies Ltd (Tnuva Group)
24.8. BASF SE
24.9. Biofac A/S (Zeria Pharmaceutical Co., Ltd.)
24.10. Danisco A/S. (DuPont Nutrition & Health)
24.11. Fonterra Co-Operative Group
24.12. Glanbia plc
24.13. Hilmar Ingredients
24.14. Hoogwegt Groep B.V.
24.15. Kerry plc
24.16. Lactose (India) Limited
24.17. Meggle Group
24.18. Merck KgaA
24.19. Milei GmbH
24.20. Proliant Inc.
24.21. Saputo Inc.
24.22. Tatua Co-operative Dairy Company Ltd.
24.23. Other on additional request
25. Recommendation- Critical Success Factors
26. Research Methodology
27. Assumptions & Acronyms Used
Table 01: Global Lactose Market Market Value (US$ Mn) and Forecast by Region, 2019–2029
Table 02: Global Lactose Market Market Volume (Metric Tons) and Forecast by Region, 2019–2029
Table 03: Global Lactose Market Market Value (US$ Mn) and Forecast by End Use, 2019–2029
Table 04: Global Lactose Market Market Volume (Metric Tons) and Forecast by End Use, 2019–2029
Table 05: Global Lactose Market Market Value (US$ Mn) and Forecast by Form, 2019–2029
Table 06: Global Lactose Market Market Volume (Metric Tons) and Forecast by Form, 2019–2029
Table 7: North America Lactose Market Market Value (US$ Mn) and Forecast by Country, 2019–2029
Table 8: North America Lactose Market Market Volume (Metric Tons) and Forecast by Country, 2019–2029
Table 9: North America Lactose Market Market Value (US$ Mn) and Forecast by End Use, 2019–2029
Table 10: North America Lactose Market Market Volume (Metric Tons) and Forecast by End Use, 2019–2029
Table 11: North America Lactose Market Market Value (US$ Mn) and Forecast by Form, 2019–2029
Table 12: North America Lactose Market Market Volume (Metric Tons) and Forecast by Form, 2019–2029
Table 13: Latin America Lactose Market Market Value (US$ Mn) and Forecast by Country, 2019–2029
Table 14: Latin America Lactose Market Market Volume (Metric Tons) and Forecast by Country, 2019–2029
Table 15: Latin America Lactose Market Market Value (US$ Mn) and Forecast by End Use, 2019–2029
Table 16: Latin America Lactose Market Market Volume (Metric Tons) and Forecast by End Use, 2019–2029
Table 17: Latin America Lactose Market Market Value (US$ Mn) and Forecast by Form, 2019–2029
Table 18: Latin America Lactose Market Market Volume (Metric Tons) and Forecast by Form, 2019–2029
Table 19: Europe Lactose Market Market Value (US$ Mn) and Forecast by Country, 2019–2029
Table 20: Europe Lactose Market Market Volume (Metric Tons) and Forecast by Country, 2019–2029
Table 21: Europe Lactose Market Market Value (US$ Mn) and Forecast by End Use, 2019–2029
Table 22: Europe Lactose Market Market Volume (Metric Tons) and Forecast by End Use, 2019–2029
Table 23: Europe Lactose Market Market Value (US$ Mn) and Forecast by Form, 2019–2029
Table 24: Europe Lactose Market Market Volume (Metric Tons) and Forecast by Form, 2019–2029
Table 25: East Asia Lactose Market Market Value (US$ Mn) and Forecast by Country, 2019–2029
Table 26: East Asia Lactose Market Market Volume (Metric Tons) and Forecast by Country, 2019–2029
Table 27: East Asia Lactose Market Market Value (US$ Mn) and Forecast by End Use, 2019–2029
Table 28: East Asia Lactose Market Market Volume (Metric Tons) and Forecast by End Use, 2019–2029
Table 29: East Asia Lactose Market Market Value (US$ Mn) and Forecast by Form, 2019–2029
Table 30: East Asia Lactose Market Market Volume (Metric Tons) and Forecast by Form, 2019–2029
Table 31: South Asia Lactose Market Market Value (US$ Mn) and Forecast by Country, 2019–2029
Table 32: South Asia Lactose Market Market Volume (Metric Tons) and Forecast by Country, 2019–2029
Table 33: South Asia Lactose Market Market Value (US$ Mn) and Forecast by End Use, 2019–2029
Table 34: South Asia Lactose Market Market Volume (Metric Tons) and Forecast by End Use, 2019–2029
Table 35: South Asia Lactose Market Market Value (US$ Mn) and Forecast by Form, 2019–2029
Table 36: South Asia Lactose Market Market Volume (Metric Tons) and Forecast by Form, 2019–2029
Table 37: Oceania Lactose Market Market Value (US$ Mn) and Forecast by Country, 2019–2029
Table 38: Oceania Lactose Market Market Volume (Metric Tons) and Forecast by Country, 2019–2029
Table 39: Oceania Lactose Market Market Value (US$ Mn) and Forecast by End Use, 2019–2029
Table 40: Oceania Lactose Market Market Volume (Metric Tons) and Forecast by End Use, 2019–2029
Table 41: Oceania Lactose Market Market Value (US$ Mn) and Forecast by Form, 2019–2029
Table 42: Oceania Lactose Market Market Volume (Metric Tons) and Forecast by Form, 2019–2029
Table 43: Middle East & Africa Lactose Market Market Value (US$ Mn) and Forecast by Country, 2019–2029
Table 44: Middle East & Africa Lactose Market Market Volume (Metric Tons) and Forecast by Country, 2019–2029
Table 45: Middle East & Africa Lactose Market Market Value (US$ Mn) and Forecast by End Use, 2019–2029
Table 46: Middle East & Africa Lactose Market Market Volume (Metric Tons) and Forecast by End Use, 2019–2029
Table 47: Middle East & Africa Lactose Market Market Value (US$ Mn) and Forecast by Form, 2019–2029
Table 48: Middle East & Africa Lactose Market Market Volume (Metric Tons) and Forecast by Form, 2019–2029
Figure 01: Global Lactose Market Value (US$ Mn) and Volume (MT) Forecast, 2019–2029
Figure 02: Global Lactose Market Absolute $ Opportunity (US$ Mn), 2019?2029
Figure 03: Global Lactose Market Value (US$ Mn) and % Growth by Region, 2019 & 2029
Figure 04: Global Lactose Market Y-o-Y Growth Rate by Region, 2019 - 2029
Figure 05: Global Lactose Market Value (US$ Mn) and % Growth by End Use, 2019 & 2029
Figure 06: Global Lactose Market Y-o-Y Growth Rate by End Use, 2019 - 2029
Figure 07: Global Lactose Market Value (US$ Mn) and % Growth by Form, 2019 & 2029
Figure 08: Global Lactose Market Y-o-Y Growth Rate by Form, 2019 - 2029
Figure 9: Global Lactose Market Attractiveness Analysis by Region, 2019 - 2029
Figure 10: Global Lactose Market Attractiveness Analysis by End Use, 2019 - 2029
Figure 11: Global Lactose Market Attractiveness Analysis by Form, 2019 - 2029
Figure 12: North America Lactose Market Value (US$ Mn) and % Growth by Country, 2019 & 2029
Figure 13: North America Lactose Market Y-o-Y Growth Rate by Country, 2019 - 2029
Figure 14: North America Lactose Market Value (US$ Mn) and % Growth by End Use, 2019 & 2029
Figure 15: North America Lactose Market Y-o-Y Growth Rate by End Use, 2019 - 2029
Figure 16: North America Lactose Market Value (US$ Mn) and % Growth by Form, 2019 & 2029
Figure 17: North America Lactose Market Y-o-Y Growth Rate by Form, 2019 - 2029
Figure 18: North America Lactose Market Attractiveness Analysis by Region, 2019 - 2029
Figure 19: North America Lactose Market Attractiveness Analysis by End Use, 2019 - 2029
Figure 20: North America Lactose Market Attractiveness Analysis by Form, 2019 - 2029
Figure 21: Latin America Lactose Market Value (US$ Mn) and % Growth by Country, 2019 & 2029
Figure 22: Latin America Lactose Market Y-o-Y Growth Rate by Country, 2019 - 2029
Figure 23: Latin America Lactose Market Value (US$ Mn) and % Growth by End Use, 2019 & 2029
Figure 24: Latin America Lactose Market Y-o-Y Growth Rate by End Use, 2019 - 2029
Figure 25: Latin America Lactose Market Value (US$ Mn) and % Growth by Form, 2019 & 2029
Figure 26: Latin America Lactose Market Attractiveness Analysis by Region, 2019 - 2029
Figure 27: Latin America Lactose Market Attractiveness Analysis by End Use, 2019 - 2029
Figure 28: Latin America Lactose Market Attractiveness Analysis by Form, 2019 - 2029
Figure 29: Europe Lactose Market Value (US$ Mn) and % Growth by Country, 2019 & 2029
Figure 30: Europe Lactose Market Y-o-Y Growth Rate by Country, 2019 - 2029
Figure 31: Europe Lactose Market Value (US$ Mn) and % Growth by End Use, 2019 & 2029
Figure 32: Europe Lactose Market Y-o-Y Growth Rate by End Use, 2019 - 2029
Figure 33: Europe Lactose Market Value (US$ Mn) and % Growth by Form, 2019 & 2029
Figure 34: Europe Lactose Market Y-o-Y Growth Rate by Form, 2019 - 2029
Figure 35: Europe Lactose Market Attractiveness Analysis by Region, 2019 - 2029
Figure 36: Europe Lactose Market Attractiveness Analysis by End Use, 2019 - 2029
Figure 37: Europe Lactose Market Attractiveness Analysis by Form, 2019 - 2029
Figure 38: East Asia Lactose Market Value (US$ Mn) and % Growth by Country, 2019 & 2029
Figure 39: East Asia Lactose Market Y-o-Y Growth Rate by Country, 2019 - 2029
Figure 40: East Asia Lactose Market Value (US$ Mn) and % Growth by End Use, 2019 & 2029
Figure 41: East Asia Lactose Market Y-o-Y Growth Rate by End Use, 2019 - 2029
Figure 42: East Asia Lactose Market Value (US$ Mn) and % Growth by Form, 2019 & 2029
Figure 43: East Asia Lactose Market Y-o-Y Growth Rate by Form, 2019 - 2029
Figure 44: East Asia Lactose Market Attractiveness Analysis by Region, 2019 - 2029
Figure 45: East Asia Lactose Market Attractiveness Analysis by End Use, 2019 - 2029
Figure 46: East Asia Lactose Market Attractiveness Analysis by Form, 2019 - 2029
Figure 47: South Asia Lactose Market Value (US$ Mn) and % Growth by Country, 2019 & 2029
Figure 48: South Asia Lactose Market Y-o-Y Growth Rate by Country, 2019 - 2029
Figure 49: South Asia Lactose Market Value (US$ Mn) and % Growth by End Use, 2019 & 2029
Figure 50: South Asia Lactose Market Y-o-Y Growth Rate by End Use, 2019 - 2029
Figure 51: South Asia Lactose Market Value (US$ Mn) and % Growth by Form, 2019 & 2029
Figure 52: South Asia Lactose Market Y-o-Y Growth Rate by Form, 2019 - 2029
Figure 53: South Asia Lactose Market Attractiveness Analysis by Region, 2019 - 2029
Figure 54: South Asia Lactose Market Attractiveness Analysis by End Use, 2019 - 2029
Figure 55: South Asia Lactose Market Attractiveness Analysis by Form, 2019 - 2029
Figure 56: Oceania Lactose Market Value (US$ Mn) and % Growth by Country, 2019 & 2029
Figure 57: Oceania Lactose Market Y-o-Y Growth Rate by Country, 2019 - 2029
Figure 58: Oceania Lactose Market Value (US$ Mn) and % Growth by End Use, 2019 & 2029
Figure 59: Oceania Lactose Market Y-o-Y Growth Rate by End Use, 2019 - 2029
Figure 60: Oceania Lactose Market Value (US$ Mn) and % Growth by Form, 2019 & 2029
Figure 61: Oceania Lactose Market Attractiveness Analysis by Region, 2019 - 2029
Figure 62: Middle East & Africa Lactose Market Value (US$ Mn) and % Growth by Country, 2019 & 2029
Figure 63: Middle East & Africa Lactose Market Y-o-Y Growth Rate by Country, 2019 - 2029
Figure 64: Middle East & Africa Lactose Market Value (US$ Mn) and % Growth by End Use, 2019 & 2029
Figure 65: Middle East & Africa Lactose Market Y-o-Y Growth Rate by End Use, 2019 - 2029
Figure 66: Middle East & Africa Lactose Market Value (US$ Mn) and % Growth by Form, 2019 & 2029
Figure 67: Middle East & Africa Lactose Market Y-o-Y Growth Rate by Form, 2019 - 2029
Figure 68: Middle East & Africa Lactose Market Attractiveness Analysis by Region, 2019 - 2029
Figure 69: Middle East & Africa Lactose Market Attractiveness Analysis by End Use, 2019 - 2029
Figure 70: Middle East & Africa Lactose Market Attractiveness Analysis by Form, 2019 - 2029
Copyright © Transparency Market Research, Inc. All Rights reserved
Trust Online

Lactose Market Forecast Report, 2019-2029
