Analysts’ Viewpoint on Laboratory Furniture Market Scenario
Europe and Asia Pacific are the most mature laboratory furniture markets. The market in Europe is growing due to a substantial rise in number of clinical, diagnostic, dental, and chemical laboratories owing to rising concerns about health after the COVID-19 pandemic, thereby driving the demand for laboratory furniture. In Europe and Asia Pacific, presence of key players characterizes the laboratory furniture market. Companies operating in the laboratory furniture market are focusing on material quality, durability, modification, sales service, and after-sales services to keep their businesses growing. Moreover, across regions, the increasing trend of setting up laboratories in schools, institutions, and colleges fuels the laboratory furniture market.
Laboratory furniture, such as laboratory benches and cabinets, forensic cabinets, apparel dispensers, carts, chemical cabinets, and drawers, are used in various laboratories such as chemical, clinical, dental, school, electronics, or computer and research laboratories.
Laboratory furniture is specially designed to keep technicians in comfortable and supported positions to prevent any stress injuries and ensure technicians remain highly productive while working. Designers of lab furniture are adopting a new approach to design labs using modern furniture that is modular and can assist in future proofing an existing design. Modular furniture such as storage units, cabinets, and shelves can be re-constructed using simple tools.
Rise in safety regulations is boosting the demand for laboratory testing services. Additionally, the hygiene needs of an increasing geriatric population and rising incidence of health issues are further driving the demand for lab-tested products. Better awareness about product quality and demand for lab-tested products among people across the globe have led to enactment of safety standards and regulations for product quality and durability by various governments. Some of the factors encouraging the usage of laboratory furniture are the capability to withstand chemicals, moisture, and impact, besides the fact that these modern furniture are specially designed to make work easier, and assist in utilizing space efficiently.
Increasing government spending on education and laboratory expansion is prompting the purchase of laboratory furniture by school and college administration. Government funding for developing medical infrastructure is growing. Growth in medical infrastructure has been one of the key reasons for the rising demand for laboratory furniture. For instance, The European Commission announced completion of the project entitled “Modernizing Schools with Science Laboratories in Primary Education.” The project is valued at around Euro 5 Mn for the establishment of laboratories in primary and secondary schools to educate students. This kind of funding is projected to rise in the near future, and is expected to propel the laboratory furniture market.
Market players are likely to introduce technological features to laboratory furniture by integrating cloud-based systems for temperature regulation and real-time monitoring. For instance, updated laboratory furniture including incubators and freezers are fitted with wireless probes to monitor door status. Growing environmental awareness has bolstered the adoption of eco-friendly materials among lab furniture manufacturers. Increasing usage of sustainable materials such as stainless steel, which not only increases the life of the furniture but also makes recycling possible, is an important and consistent trend that would continue to influence the growth of the laboratory furniture market. Additionally, introduction of adjustable workbenches, laboratory tables, and desks that are more ergonomic, which further prevent neck & back ache, is estimated to help boost the laboratory furniture market size.
In terms of type, the laboratory stools & benches segment held a major share in terms of both value and volume, and the segment is expected to grow at a notable CAGR during the forecast period. Laboratories have different workstations such as hoods, and medium or high benches, and their height level determines the height of the lab chair. Laboratory chairs are available in different height ranges and materials. There are also laboratory stools with 360-degree pneumatic height adjustment, ideal for clinical facilities and university labs. Lab furniture is made from metal welded tubular steel, modular steel, or epoxy powder-coated steel. Metal is easy to maintain, durable, and resists corrosion, chemicals, and abrasions.
Europe, North America, and Asia Pacific are expected to lead the global market during the forecast Europe dominated the global laboratory furniture market closely followed by North America and Asia Pacific. Europe held a dominant share owing to the increasing demand for medical furniture in the region. Additionally, well-developed medical infrastructure in Europe is further attributed to the major share held by the region of the global laboratory furniture market.
Asia Pacific and North America also account for a dominant share of the global laboratory furniture market share. The laboratory furniture market share held by Asia Pacific is anticipated to rise significantly during the forecast period due to a rising population coupled with growth in medical infrastructure in the region. The Government of India supports education projects with the goal of building ‘thinking skills’ that equip children with the ability to quickly learn. Successful integrated projects such as the Teacher Resource Laboratory project (TRL) in Uttar Pradesh and the Innovator’s Laboratory in Bengaluru are some examples.
Detailed profiles of players in the laboratory furniture market have been provided in the report to evaluate their financials, key product offerings, recent developments, and strategies. Majority of firms are spending significant amounts on comprehensive research and development activities, primarily to develop innovative products. Expansion of product portfolios and mergers and acquisitions are the key strategies adopted by lab furniture suppliers and manufacturers.
Key players operating in the global laboratory furniture market are FRIATEC GmbH, GE Healthcare Services, Kewaunee Scientific, LOC Scientific, MERCI, s.r.o, Mott Manufacturing Ltd., PSA Laboratory Furniture LLC, Symbiote, Thermofisher Scientific, and WALDNER Group.
Each of these players has been profiled in the global laboratory furniture market report based on parameters such as company overview, financial overview, business strategies, product portfolio, business segments, and recent developments
|
Attribute |
Detail |
|
Market Size Value in 2021 (Base Year) |
USD 930.6 Mn |
|
Market Forecast Value in 2031 |
USD 1.81 Bn |
|
Growth Rate (CAGR) |
6.3% |
|
Forecast Period |
2022-2031 |
|
Quantitative Units |
US$ Mn for value, Thousand units for volume |
|
Market Analysis |
Global qualitative analysis includes drivers, restraints, opportunities, key trends, key market indicators, Porter’s Five Forces analysis, value chain analysis, SWOT analysis, etc. Furthermore, at the regional level, qualitative analysis includes key trends, price trends, and key supplier analysis. |
|
Competition Landscape |
Market Player – Competition Dashboard and Revenue Share Analysis 2021 Company Profiles (Details – Company Overview, Sales Area/Geographical Presence, Revenue, COVID-19 Response, Strategy & Business Overview) |
|
Regions Covered |
|
|
Market Segmentation |
|
|
Companies Profile |
|
|
Customization Scope |
Available upon Request |
|
Pricing |
Available upon Request |
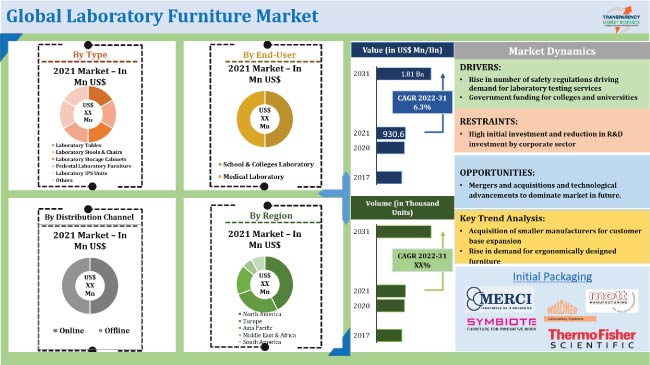
The laboratory furniture market stood at US$ 930.6 Mn in 2021
The laboratory furniture market is expected to reach US$ 1.81 Bn by 2031.
Rise in number of safety regulations and government funding for colleges and universities
The laboratory stools & benches segment accounted for highest share of the laboratory furniture market in 2021
The laboratory furniture market in Europe held 35.3% share of global market in 2021.
FRIATEC GmbH, GE Healthcare Services, Kewaunee Scientific, LOC Scientific, MERCI, s.r.o, Mott Manufacturing Ltd., PSA Laboratory Furniture LLC, Symbiote, Thermofisher Scientific, and WALDNER Group.
1. Preface
1.1. Market Definition and Scope
1.2. Market Segmentation
1.3. Key Research Objectives
1.4. Research Highlights
2. Assumptions
3. Research Methodology
4. Executive Summary
5. Market Overview
5.1. Introduction
5.2. Market Dynamics
5.2.1. Drivers
5.2.2. Restraints
5.2.3. Opportunities
5.3. Key Trends Analysis
5.3.1. Demand Side Analysis
5.3.2. Supply Side Analysis
5.4. Key Market Indicators
5.4.1. Overall Furniture Industry Overview
5.5. Covid-19 Impact Analysis
5.6. Regulatory Framework
5.7. Porter’s Five Forces Analysis
5.8. Value Chain Analysis
5.9. Industry SWOT Analysis
5.10. Global Laboratory Furniture Market Analysis and Forecast, 2017 - 2031
5.10.1. Market Revenue Projections (US$ Mn)
5.10.2. Market Revenue Projections (000’ Units)
6. Global Laboratory Furniture Market Analysis and Forecast, by Type
6.1. Laboratory Furniture Market Size (US$ Mn, Thousand Units) Forecast, by Type, 2017 - 2031
6.1.1. Laboratory Tables
6.1.2. Laboratory Stools & Benches
6.1.3. Laboratory Desk & Storage Cabinets
6.1.4. Pedestal Laboratory Furniture
6.1.5. Laboratory IPS Units
6.1.6. Storage Cabinets & Racks
6.1.7. Others
6.2. Incremental Opportunity, By Type
7. Global Laboratory Furniture Market Analysis and Forecast, by End-user
7.1. Laboratory Furniture Market Size (US$ Mn, Thousand Units) Forecast, by End-user, 2017 - 2031
7.1.1. School & Colleges Laboratory
7.1.2. Medical Laboratory
7.2. Incremental Opportunity, By End-user
8. Global Laboratory Furniture Market Analysis and Forecast, by Distribution Channel
8.1. Laboratory Furniture Market Size (US$ Mn, Thousand Units) Forecast, by Distribution Channel, 2017 - 2031
8.1.1. Online
8.1.2. Offline
8.2. Incremental Opportunity, By Distribution Channel
9. Global Laboratory Furniture Market Analysis and Forecast, by Region
9.1. Laboratory Furniture Market Size (US$ Mn, Thousand Units), by Region, 2017 - 2031
9.1.1. North America
9.1.2. Europe
9.1.3. Asia Pacific
9.1.4. Middle East & Africa
9.1.5. South America
9.2. Global Incremental Opportunity, by Region
10. North America Laboratory Furniture Market Analysis and Forecast
10.1. Regional Snapshot
10.2. Impact Analysis of COVID – 19
10.3. Price Trend Analysis
10.3.1. Weighted Average Price
10.4. Laboratory Furniture Market Size (US$ Mn, Thousand Units) Forecast, by Type, 2017 - 2031
10.4.1. Laboratory Tables
10.4.2. Laboratory Stools & Benches
10.4.3. Laboratory Desk & Storage Cabinets
10.4.4. Pedestal Laboratory Furniture
10.4.5. Laboratory IPS Units
10.4.6. Storage Cabinets & Racks
10.4.7. Others
10.5. Laboratory Furniture Market Size (US$ Mn, Thousand Units) Forecast, by End-user, 2017 - 2031
10.5.1. School & Colleges Laboratory
10.5.2. Medical Laboratory
10.6. Laboratory Furniture Market Size (US$ Mn, Thousand Units) Forecast, by Distribution Channel, 2017 - 2031
10.6.1. Online
10.6.2. Offline
10.7. Laboratory Furniture Market Size (US$ Mn and 000’ Units) Forecast, by Country/Sub-Region, 2017 - 2031
10.7.1. U.S.
10.7.2. Canada
10.7.3. Rest of North America
10.8. Incremental Opportunity Analysis
11. Europe Laboratory Furniture Market Analysis and Forecast
11.1. Regional Snapshot
11.2. Impact Analysis of COVID – 19
11.3. Price Trend Analysis
11.3.1. Weighted Average Price
11.4. Laboratory Furniture Market Size (US$ Mn, Thousand Units) Forecast, by Type, 2017 - 2031
11.4.1. Laboratory Tables
11.4.2. Laboratory Stools & Benches
11.4.3. Laboratory Desk & Storage Cabinets
11.4.4. Pedestal Laboratory Furniture
11.4.5. Laboratory IPS Units
11.4.6. Storage Cabinets & Racks
11.4.7. Others
11.5. Laboratory Furniture Market Size (US$ Mn, Thousand Units) Forecast, by End-user, 2017 - 2031
11.5.1. School & Colleges Laboratory
11.5.2. Medical Laboratory
11.6. Laboratory Furniture Market Size (US$ Mn, Thousand Units) Forecast, by Distribution Channel, 2017 - 2031
11.6.1. Online
11.6.2. Offline
11.7. Laboratory Furniture Market Size (US$ Mn, Thousand Units) Forecast, by Country/Sub-Region, 2017 - 2031
11.7.1. U.K.
11.7.2. Germany
11.7.3. France
11.7.4. Poland
11.7.5. Rest of Europe
11.8. Incremental Opportunity Analysis
12. Asia Pacific Laboratory Furniture Market Analysis and Forecast
12.1. Regional Snapshot
12.2. Impact Analysis of COVID – 19
12.3. Price Trend Analysis
12.3.1. Weighted Average Price
12.4. Laboratory Furniture Market Size (US$ Mn, Thousand Units) Forecast, by Type, 2017 - 2031
12.4.1. Laboratory Tables
12.4.2. Laboratory Stools & Benches
12.4.3. Laboratory Desk & Storage Cabinets
12.4.4. Pedestal Laboratory Furniture
12.4.5. Laboratory IPS Units
12.4.6. Storage Cabinets & Racks
12.4.7. Others
12.5. Laboratory Furniture Market Size (US$ Mn, Thousand Units) Forecast, by End-user, 2017 - 2031
12.5.1. School & Colleges Laboratory
12.5.2. Medical Laboratory
12.6. Laboratory Furniture Market Size (US$ Mn, Thousand Units) Forecast, by Distribution Channel, 2017 - 2031
12.6.1. Online
12.6.2. Offline
12.7. Laboratory Furniture Market Size (US$ Mn and 000’ Units) Forecast, by Country/Sub-Region, 2017 - 2031
12.7.1. China
12.7.2. India
12.7.3. Japan
12.7.4. Rest of Asia Pacific
12.8. Incremental Opportunity Analysis
13. Middle East & Africa Laboratory Furniture Market Analysis and Forecast
13.1. Regional Snapshot
13.2. Impact Analysis of COVID – 19
13.3. Price Trend Analysis
13.3.1. Weighted Average Price
13.4. Laboratory Furniture Market Size (US$ Mn, Thousand Units) Forecast, by Type, 2017 - 2031
13.4.1. Laboratory Tables
13.4.2. Laboratory Stools & Benches
13.4.3. Laboratory Desk & Storage Cabinets
13.4.4. Pedestal Laboratory Furniture
13.4.5. Laboratory IPS Units
13.4.6. Storage Cabinets & Racks
13.4.7. Others
13.5. Laboratory Furniture Market Size (US$ Mn, Thousand Units) Forecast, by End-user, 2017 - 2031
13.5.1. School & Colleges Laboratory
13.5.2. Medical Laboratory
13.6. Laboratory Furniture Market Size (US$ Mn, Thousand Units) Forecast, by Distribution Channel, 2017 - 2031
13.6.1. Online
13.6.2. Offline
13.7. Laboratory Furniture Market Size (US$ Mn and 000’ Units) Forecast, by Country/Sub-Region, 2017 - 2031
13.7.1. GCC
13.7.2. South Africa
13.7.3. Rest of Middle East & Africa
13.8. Incremental Opportunity Analysis
14. South America Laboratory Furniture Market Analysis and Forecast
14.1. Regional Snapshot
14.2. Impact Analysis of COVID – 19
14.3. Price Trend Analysis
14.3.1. Weighted Average Price
14.4. Laboratory Furniture Market Size (US$ Mn, Thousand Units) Forecast, by Type, 2017 - 2031
14.4.1. Laboratory Tables
14.4.2. Laboratory Stools & Benches
14.4.3. Laboratory Desk & Storage Cabinets
14.4.4. Pedestal Laboratory Furniture
14.4.5. Laboratory IPS Units
14.4.6. Storage Cabinets & Racks
14.4.7. Others
14.5. Laboratory Furniture Market Size (US$ Mn, Thousand Units) Forecast, by End-user, 2017 - 2031
14.5.1. School & Colleges Laboratory
14.5.2. Medical Laboratory
14.6. Laboratory Furniture Market Size (US$ Mn, Thousand Units) Forecast, by Distribution Channel, 2017 - 2031
14.6.1. Online
14.6.2. Offline
14.7. Laboratory Furniture Market Size (US$ Mn and 000’ Units) Forecast, by Country/Sub-Region, 2017 - 2031
14.7.1. Brazil
14.7.2. Rest of South America
14.8. Incremental Opportunity Analysis
15. Competition Landscape
15.1. Market Player – Competition Dashboard
15.2. Market Share Analysis (%)-2021
15.3. Company Profiles (Details – Company Overview, Sales Area/Geographical Presence, Manufacturing Location, Revenue, Strategy & Business Process Overview)
15.3.1. Aakar Scientific Pvt. Ltd.
15.3.1.1. Company Overview
15.3.1.2. Sales Area/Geographical Presence
15.3.1.3. Manufacturing Location
15.3.1.4. Revenue
15.3.1.5. Strategy & Business Process Overview
15.3.2. Compagnie de Saint-Gobain S.A.
15.3.2.1. Company Overview
15.3.2.2. Sales Area/Geographical Presence
15.3.2.3. Manufacturing Location
15.3.2.4. Revenue
15.3.2.5. Strategy & Business Process Overview
15.3.3. HEMCO Corporation
15.3.3.1. Company Overview
15.3.3.2. Sales Area/Geographical Presence
15.3.3.3. Manufacturing Location
15.3.3.4. Revenue
15.3.3.5. Strategy & Business Process Overview
15.3.4. Innovative Inc.
15.3.4.1. Company Overview
15.3.4.2. Sales Area/Geographical Presence
15.3.4.3. Manufacturing Location
15.3.4.4. Revenue
15.3.4.5. Strategy & Business Process Overview
15.3.5. Kewaunee Labway India Pvt. Ltd
15.3.5.1. Company Overview
15.3.5.2. Sales Area/Geographical Presence
15.3.5.3. Manufacturing Location
15.3.5.4. Revenue
15.3.5.5. Strategy & Business Process Overview
15.3.6. Kewaunee Scientific Corporation
15.3.6.1. Company Overview
15.3.6.2. Sales Area/Geographical Presence
15.3.6.3. Manufacturing Location
15.3.6.4. Revenue
15.3.6.5. Strategy & Business Process Overview
15.3.7. Kottermann GmbH
15.3.7.1. Company Overview
15.3.7.2. Sales Area/Geographical Presence
15.3.7.3. Manufacturing Location
15.3.7.4. Revenue
15.3.7.5. Strategy & Business Process Overview
15.3.8. MOTT Manufacturing Ltd.
15.3.8.1. Company Overview
15.3.8.2. Sales Area/Geographical Presence
15.3.8.3. Manufacturing Location
15.3.8.4. Revenue
15.3.8.5. Strategy & Business Process Overview
15.3.9. PSA Laboratory Furniture LLC
15.3.9.1. Company Overview
15.3.9.2. Sales Area/Geographical Presence
15.3.9.3. Manufacturing Location
15.3.9.4. Revenue
15.3.9.5. Strategy & Business Process Overview
15.3.10. Yamato Scientific co., ltd
15.3.10.1. Company Overview
15.3.10.2. Sales Area/Geographical Presence
15.3.10.3. Manufacturing Location
15.3.10.4. Revenue
15.3.10.5. Strategy & Business Process Overview
16. Key Takeaways
16.1. Identification of Potential Market Spaces
16.1.1. By Type
16.1.2. By End-user
16.1.3. By Distribution Channel
16.1.4. By Region
16.2. Understanding the Procurement Process of Users
16.3. Prevailing Market Risks
16.4. Preferred Sales & Marketing Strategy
List of Tables
Table 1: Global Laboratory Furniture Market by Type, US$ Mn, 2017-2031
Table 2: Global Laboratory Furniture Market by Type, Thousand Units, 2017-2031
Table 3: Global Laboratory Furniture Market by End-user, US$ Mn, 2017-2031
Table 4: Global Laboratory Furniture Market by End-user, Thousand Units, 2017-2031
Table 5: Global Laboratory Furniture Market by Distribution Channel, US$ Mn, 2017-2031
Table 6: Global Laboratory Furniture Market by Distribution Channel, Thousand Units, 2017-2031
Table 7: Global Laboratory Furniture Market by Region, US$ Mn, 2017-2031
Table 8: Global Laboratory Furniture Market by Region, Thousand Units, 2017-2031
Table 9: North America Laboratory Furniture Market by Type, US$ Mn, 2017-2031
Table 10: North America Laboratory Furniture Market by Type, Thousand Units, 2017-2031
Table 11: North America Laboratory Furniture Market by End-user, US$ Mn, 2017-2031
Table 12: North America Laboratory Furniture Market by End-user, Thousand Units, 2017-2031
Table 13: North America Laboratory Furniture Market by Distribution Channel, US$ Mn, 2017-2031
Table 14: North America Laboratory Furniture Market by Distribution Channel, Thousand Units, 2017-2031
Table 15: North America Laboratory Furniture Market by Country/Sub-Region, US$ Mn, 2017-2031
Table 16: North America Laboratory Furniture Market by Country/Sub-Region, Thousand Units, 2017-2031
Table 17: Europe Laboratory Furniture Market by Type, US$ Mn, 2017-2031
Table 18: Europe Laboratory Furniture Market by Type, Thousand Units, 2017-2031
Table 19: Europe Laboratory Furniture Market by End-user, US$ Mn, 2017-2031
Table 20: Europe Laboratory Furniture Market by End-user, Thousand Units, 2017-2031
Table 21: Europe Laboratory Furniture Market by Distribution Channel, US$ Mn, 2017-2031
Table 22: Europe Laboratory Furniture Market by Distribution Channel, Thousand Units, 2017-2031
Table 23: Europe Laboratory Furniture Market by Country/Sub-Region, US$ Mn, 2017-2031
Table 24: Europe Laboratory Furniture Market by Country/Sub-Region, Thousand Units, 2017-2031
Table 25: Asia Pacific Laboratory Furniture Market by Type, US$ Mn, 2017-2031
Table 26: Asia Pacific Laboratory Furniture Market by Type, Thousand Units, 2017-2031
Table 27: Asia Pacific Laboratory Furniture Market by End-user, US$ Mn, 2017-2031
Table 28: Asia Pacific Laboratory Furniture Market by End-user, Thousand Units, 2017-2031
Table 29: Asia Pacific Laboratory Furniture Market by Distribution Channel, US$ Mn, 2017-2031
Table 30: Asia Pacific Laboratory Furniture Market by Distribution Channel, Thousand Units, 2017-2031
Table 31: Asia Pacific Laboratory Furniture Market by Country/Sub-Region, US$ Mn, 2017-2031
Table 32: Asia Pacific Laboratory Furniture Market by Country/Sub-Region, Thousand Units, 2017-2031
Table 33: Middle East & Africa Laboratory Furniture Market by Type, US$ Mn, 2017-2031
Table 34: Middle East & Africa Laboratory Furniture Market by Type, Thousand Units, 2017-2031
Table 35: Middle East & Africa Laboratory Furniture Market by End-user, US$ Mn, 2017-2031
Table 36: Middle East & Africa Laboratory Furniture Market by End-user, Thousand Units, 2017-2031
Table 37: Middle East & Africa Laboratory Furniture Market by Distribution Channel, US$ Mn, 2017-2031
Table 38: Middle East & Africa Laboratory Furniture Market by Distribution Channel, Thousand Units, 2017-2031
Table 39: Middle East & Africa Laboratory Furniture Market by Country/Sub-Region, US$ Mn, 2017-2031
Table 40: Middle East & Africa Laboratory Furniture Market by Country/Sub-Region, Thousand Units, 2017-2031
Table 41: South America Laboratory Furniture Market by Type, US$ Mn, 2017-2031
Table 42: South America Laboratory Furniture Market by Type, Thousand Units, 2017-2031
Table 43: South America Laboratory Furniture Market by End-user, US$ Mn, 2017-2031
Table 44: South America Laboratory Furniture Market by End-user, Thousand Units, 2017-2031
Table 45: South America Laboratory Furniture Market by Distribution Channel, US$ Mn, 2017-2031
Table 46: South America Laboratory Furniture Market by Distribution Channel, Thousand Units, 2017-2031
Table 47: South America Laboratory Furniture Market by Country/Sub-Region, US$ Mn, 2017-2031
Table 48: South America Laboratory Furniture Market by Country/Sub-Region, Thousand Units, 2017-2031
List of Figures
Figure 1: Global Laboratory Furniture Market by Type, US$ Mn, 2017-2031
Figure 2: Global Laboratory Furniture Market by Type, Thousand Units, 2017-2031
Figure 3: Global Laboratory Furniture Market by Type, 2022-2031
Figure 4: Global Laboratory Furniture Market by End-user, US$ Mn, 2017-2031
Figure 5: Global Laboratory Furniture Market by End-user, Thousand Units, 2017-2031
Figure 6: Global Laboratory Furniture Market by End-user, 2022-2031
Figure 7: Global Laboratory Furniture Market by Distribution Channel, US$ Mn, 2017-2031
Figure 8: Global Laboratory Furniture Market by Distribution Channel, Thousand Units, 2017-2031
Figure 9: Global Laboratory Furniture Market by Distribution Channel, 2022-2031
Figure 10: Global Laboratory Furniture Market by Region, US$ Mn, 2017-2031
Figure 11: Global Laboratory Furniture Market by Region, Thousand Units, 2017-2031
Figure 12: Global Laboratory Furniture Market by Region,2022-2031
Figure 13: North America Laboratory Furniture Market by Type, US$ Mn, 2017-2031
Figure 14: North America Laboratory Furniture Market by Type, Thousand Units, 2017-2031
Figure 15: North America Laboratory Furniture Market by Type, 2022-2031
Figure 16: North America Laboratory Furniture Market by End-user, US$ Mn, 2017-2031
Figure 17: North America Laboratory Furniture Market by End-user, Thousand Units, 2017-2031
Figure 18: North America Laboratory Furniture Market by End-user, 2022-2031
Figure 19: North America Laboratory Furniture Market by Distribution Channel, US$ Mn, 2017-2031
Figure 20: North America Laboratory Furniture Market by Distribution Channel, Thousand Units, 2017-2031
Figure 21: North America Laboratory Furniture Market by Distribution Channel, 2022-2031
Figure 22: North America Laboratory Furniture Market by Country/Sub-Region, US$ Mn, 2017-2031
Figure 23: North America Laboratory Furniture Market by Country/Sub-Region, Thousand Units, 2017-2031
Figure 24: North America Laboratory Furniture Market by Country/Sub-Region, 2022-2031
Figure 25: Europe Laboratory Furniture Market by Type, US$ Mn, 2017-2031
Figure 26: Europe Laboratory Furniture Market by Type, Thousand Units, 2017-2031
Figure 27: Europe Laboratory Furniture Market by Type, 2022-2031
Figure 28: Europe Laboratory Furniture Market by End-user, US$ Mn, 2017-2031
Figure 29: Europe Laboratory Furniture Market by End-user, Thousand Units, 2017-2031
Figure 30: Europe Laboratory Furniture Market by End-user, 2022-2031
Figure 31: Europe Laboratory Furniture Market by Distribution Channel, US$ Mn, 2017-2031
Figure 32: Europe Laboratory Furniture Market by Distribution Channel, Thousand Units, 2017-2031
Figure 33: Europe Laboratory Furniture Market by Distribution Channel, 2022-2031
Figure 34: Europe Laboratory Furniture Market by Country/Sub-Region, US$ Mn, 2017-2031
Figure 35: Europe Laboratory Furniture Market by Country/Sub-Region, Thousand Units, 2017-2031
Figure 36: Europe Laboratory Furniture Market by Country/Sub-Region, 2022-2031
Figure 37: Asia Pacific Laboratory Furniture Market by Type, US$ Mn, 2017-2031
Figure 38: Asia Pacific Laboratory Furniture Market by Type, Thousand Units, 2017-2031
Figure 39: Asia Pacific Laboratory Furniture Market by Type, 2022-2031
Figure 40: Asia Pacific Laboratory Furniture Market by End-user, US$ Mn, 2017-2031
Figure 41: Asia Pacific Laboratory Furniture Market by End-user, Thousand Units, 2017-2031
Figure 42: Asia Pacific Laboratory Furniture Market by End-user, 2022-2031
Figure 43: Asia Pacific Laboratory Furniture Market by Distribution Channel, US$ Mn, 2017-2031
Figure 44: Asia Pacific Laboratory Furniture Market by Distribution Channel, Thousand Units, 2017-2031
Figure 45: Asia Pacific Laboratory Furniture Market by Distribution Channel, 2022-2031
Figure 46: Asia Pacific Laboratory Furniture Market by Country/Sub-Region, US$ Mn, 2017-2031
Figure 47: Asia Pacific Laboratory Furniture Market by Country/Sub-Region, Thousand Units, 2017-2031
Figure 48: Asia Pacific Laboratory Furniture Market by Country/Sub-Region, 2022-2031
Figure 49: Middle East & Africa Laboratory Furniture Market by Type, US$ Mn, 2017-2031
Figure 50: Middle East & Africa Laboratory Furniture Market by Type, Thousand Units, 2017-2031
Figure 51: Middle East & Africa Laboratory Furniture Market by Type, 2022-2031
Figure 52: Middle East & Africa Laboratory Furniture Market by End-user, US$ Mn, 2017-2031
Figure 53: Middle East & Africa Laboratory Furniture Market by End-user, Thousand Units, 2017-2031
Figure 54: Middle East & Africa Laboratory Furniture Market by End-user, 2022-2031
Figure 55: Middle East & Africa Laboratory Furniture Market by Distribution Channel, US$ Mn, 2017-2031
Figure 56: Middle East & Africa Laboratory Furniture Market by Distribution Channel, Thousand Units, 2017-2031
Figure 57: Middle East & Africa Laboratory Furniture Market by Distribution Channel, 2022-2031
Figure 58: Middle East & Africa Laboratory Furniture Market by Country/Sub-Region, US$ Mn, 2017-2031
Figure 59: Middle East & Africa Laboratory Furniture Market by Country/Sub-Region, Thousand Units, 2017-2031
Figure 60: Middle East & Africa Laboratory Furniture Market by Country/Sub-Region, 2022-2031
Figure 61: South America Laboratory Furniture Market by Type, US$ Mn, 2017-2031
Figure 62: South America Laboratory Furniture Market by Type, Thousand Units, 2017-2031
Figure 63: South America Laboratory Furniture Market by Type, 2022-2031
Figure 64: South America Laboratory Furniture Market by End-user, US$ Mn, 2017-2031
Figure 65: South America Laboratory Furniture Market by End-user, Thousand Units, 2017-2031
Figure 66: South America Laboratory Furniture Market by End-user, 2022-2031
Figure 67: South America Laboratory Furniture Market by Distribution Channel, US$ Mn, 2017-2031
Figure 68: South America Laboratory Furniture Market by Distribution Channel, Thousand Units, 2017-2031
Figure 69: South America Laboratory Furniture Market by Distribution Channel, 2022-2031
Figure 70: South America Laboratory Furniture Market by Country/Sub-Region, US$ Mn, 2017-2031
Figure 71: South America Laboratory Furniture Market by Country/Sub-Region, Thousand Units, 2017-2031
Figure 72: South America Laboratory Furniture Market by Country/Sub-Region, 2022-2031
Copyright © Transparency Market Research, Inc. All Rights reserved
Trust Online

Laboratory Furniture Market
