Kaposi Sarcoma Market: Snapshot
Kaposi sarcoma (KS) refers to a type of cancer that develops from the cells lining blood vessels or lymph nodes. The cancer usually appears as tumors on mucosal surfaces or on the skin, but can also develop in body parts such as the digestive tract, or the lungs. The abnormal KS cells cause brown, purple, or red blotches on the skin, called lesions.
The global Kaposi sarcoma market features a rising number of regional vendors commanding prominent shares in their respective regional territories. Owing to the looming patent expiries of several blockbuster drugs, the market is expected to witness the entry of several new companies producing generics. The situation also presents immense growth opportunities for leading companies with new drug formulations in the next few years.
Transparency Market Research states that the global Kaposi sarcoma market will exhibit a modest 2.2% CAGR over the period between 2016 and 2024, rising from a valuation of US$118.5 mn in 2015 to US$143.2 mn by 2024.
Chemotherapy Continues to Remain Most Preferred Course of Treatment despite High Cost
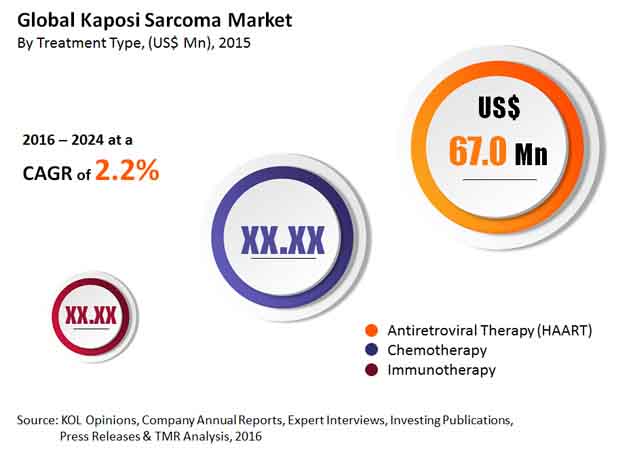
The key treatment methods for Kaposi sarcoma include immunotherapy, chemotherapy, and antiretroviral therapy. Of these, the segment of antiretroviral therapy emerged at the leading segment owing to the high incidence rate of AIDS-related Kaposi sarcoma. The segment will continue to grow at an encouraging pace in the next few years as well.
Over the report’s forecast period, however, the segment of chemotherapy is expected to exhibit growth at the most promising pace, chiefly owing to the high treatment cost and the high preference given to the treatment method by immunocompetent patients. Some of the most popular chemotherapy drugs in the market are vincristine, docetaxel, paclitaxel, bleomicin, daunorubicin, and liposomal doxorubicin. Although the high preference to this treatment method, its high cost could emerge as a key deterrent to patient population across some regions, especially across developing and less developed economies across Asia Pacific and Africa, limiting its growth prospects.
North America to Retain Dominance in Global Market despite a Low Rate of Prevalence of Kaposi Sarcoma
From a geographical standpoint, North America is presently the leading contributor of revenue to the global Kaposi sarcoma market. The region holds a leading position in the global market owing to the presence of some of the world’s leading vendors in the field and the rising costs of drugs. The North America market for Kaposi sarcoma also benefits from the high rate of diagnosis of the condition and the easy availability of drugs. The region features a low incidence rate of the disease but has been witnessing a shortage in supply of drugs required for its treatment, leading to a wide demand-supply gap and subsequently significant scope of growth.
Over the report’s forecast period, the market is expected to witness the most promising rate of growth in the Middle East and Africa region. The region is expected to lead to the heightened demand for Kaposi sarcoma drugs owing to the high rate of incidence of the disease. The high rate of prevalence of HIV/AIDS is and thus the increased prevalence of AIDS induced Kaposi sarcoma in Eastern Africa is also a key driving factor, along with the fact that awareness among people is low.
Some of the leading players operating in the immensely consolidated vendor landscape of the global Kaposi sarcoma market are Johnson & Johnson, Merck & Co., Inc., Bristol Myers Squibb, Hoffman-La Roche, Inc., Pfizer, Inc., GlaxoSmithKline plc, and Eli Lilly and Co.
Alarming Rise in Cancer Cases to Accelerate the Growth of the Kaposi Sarcoma Market
Cancer has affected many people around the globe. Various cancer types are responsible for a large number of fatalities across the world. Kaposi Sarcoma is one of them. The rising prevalence of Kaposi Sarcoma across many individuals will serve as a prominent growth-generating factor for the global Kaposi Sarcoma market during the assessment period of 2016-2024.
1. Preface
1.1. Market Definition and Scope
1.2. Market Segmentation
1.3. Key Research Objectives
1.4. Research Highlights
2. Assumptions and Research Methodology
3. Executive Summary: Global Kaposi sarcoma market
4. Market Overview
4.1. Introduction
4.2. Key market indicators
4.3. Regulatory scenario
4.4. Market Dynamics
4.4.1. Drivers
4.4.2. Restraints
4.4.3. Opportunities
4.5. Value Chain Analysis
5. Global Kaposi Sarcoma Market, by Treatment
5.1. Key Findings
5.2. Global Kaposi Sarcoma Market, by Type of Treatment, (US$ Mn), 2014–2024
5.2.1. Chemotherapy
5.2.1.1. Liposomal Anthracyclines
5.2.1.2. Alkaloids
5.2.2. Immunotherapy
5.2.3. HAART
5.3. Global Kaposi Sarcoma Market Attractiveness, by Treatment, 2015
6. Global Kaposi Sarcoma Market, by Distribution Channel
6.1. Global Kaposi Sarcoma Market, by Distribution Channel, (US$ Mn), 2014–2024
6.1.1. Hospitals
6.1.2. Cancer Research Institutes
6.1.3. Multispecialty Clinics
6.1.4. Ambulatory Surgical Centers
6.2. Global Kaposi Sarcoma Market Attractiveness, by Distribution Channel, 2015
7. Global Kaposi Sarcoma Market, by Region
7.1. Global Kaposi Sarcoma Market, by Region, (US$ Mn), 2014–2024
7.1.1. North America
7.1.2. Europe
7.1.3. Asia Pacific
7.1.4. Latin America
7.1.5. Middle East and Africa
7.2. Global Kaposi Sarcoma Market Attractiveness, by Region, 2015
8. Global Kaposi Sarcoma Market, Pipeline Analysis
8.1. Overview
8.2. List of Early Stage Drug Candidates
9. North America Kaposi Sarcoma Market
9.1. North America Kaposi Sarcoma Market, by Type of Treatment, (US$), 2014–2024
9.1.1. Chemotherapy
9.1.2. Immunotherapy
9.1.3. HAART
9.2. North America Kaposi Sarcoma Market, by Distribution Channel, (US$), 2014–2024
9.2.1. Hospitals
9.2.2. Cancer Research Institutes
9.2.3. Multispecialty Clinics
9.2.4. Ambulatory Surgical Centers
9.3. North America Kaposi Sarcoma Market, by Country, (US$), 2014–2024
9.3.1. U.S.
9.3.2. Canada
9.4. Market Attractiveness, by Type of Treatment, 2015
9.5. Market Attractiveness, by Country, 2015
10. Europe Kaposi Sarcoma Market
10.1. Europe Kaposi Sarcoma Market, by Type of Treatment, (US$), 2014–2024
10.1.1. Chemotherapy
10.1.2. Immunotherapy
10.1.3. HAART
10.2. Europe Kaposi Sarcoma Market, by Distribution Channel, (US$), 2014–2024
10.2.1. Hospitals
10.2.2. Cancer Research Institutes
10.2.3. Multispecialty Clinics
10.2.4. Ambulatory Surgical Centers
10.3. EuropeKaposi Sarcoma Market, by Country, (US$), 2014–2024
10.3.1. U.K.
10.3.2. Germany
10.3.3. Rest of Europe
10.4. Market Attractiveness, by Type of Treatment, 2015
10.5. Market Attractiveness, by Country, 2015
11. Asia Pacific Kaposi Sarcoma Market
11.1. Asia Pacific Kaposi Sarcoma Market, by Type of Treatment, (US$), 2014–2024
11.1.1. Chemotherapy
11.1.2. Immunotherapy
11.1.3. HAART
11.2. Asia Pacific Kaposi Sarcoma Market, by Distribution Channel, (US$), 2014–2024
11.2.1. Hospitals
11.2.2. Cancer Research Institutes
11.2.3. Multispecialty Clinics
11.2.4. Ambulatory Surgical Centers
11.3. Asia Pacific Kaposi Sarcoma Market, by Country, (US$), 2014–2024
11.3.1. China
11.3.2. Japan
11.3.3. India
11.3.4. Australia
11.3.5. Rest of Asia Pacific
11.4. Market Attractiveness, by Type of Treatment, 2015
11.5. Market Attractiveness, by Country, 2015
12. Latin America Kaposi Sarcoma Market
12.1. Latin America Kaposi Sarcoma Market, by Type of Treatment, (US$), 2014–2024
12.1.1. Chemotherapy
12.1.2. Immunotherapy
12.1.3. HAART
12.2. Latin America Kaposi Sarcoma Market, by Distribution Channel, (US$), 2014–2024
12.2.1. Hospitals
12.2.2. Cancer Research Institutes
12.2.3. Multispecialty Clinics
12.2.4. Ambulatory Surgical Centers
12.3. Latin America Kaposi Sarcoma Market, by Country, (US$), 2014–2024
12.3.1. Brazil
12.3.2. Mexico
12.3.3. Rest of Latin America
12.4. Market Attractiveness, by Type of Treatment, 2015
12.5. Market Attractiveness, by Country, 2015
13. Middle East and Africa Kaposi Sarcoma Market
13.1. Middle East and Africa Kaposi Sarcoma Market, by Type of Treatment, (US$), 2014–2024
13.1.1. Chemotherapy
13.1.2. Immunotherapy
13.1.3. HAART
13.2. Middle East and Africa Kaposi Sarcoma Market, by Distribution Channel, (US$), 2014–2024
13.2.1. Hospitals
13.2.2. Cancer Research Institutes
13.2.3. Multispecialty Clinics
13.2.4. Ambulatory Surgical Centers
13.3. Middle East and Africa Kaposi Sarcoma Market, by Country, (US$), 2014–2024
13.3.1. U.A.E.
13.3.2. South African Republic
13.3.3. Rest of Middle East and Africa
13.4. Market Attractiveness, by Type of Treatment, 2015
13.5. Market Attractiveness, by Country, 2015
14. Global Kaposi Sarcoma Market Analysis, By Services
14.1. Radiation Therapy
14.2. Surgery
15. Competitive Landscape
15.1. Growth-Share Matrix of Companies, 2015
15.2. Market Share Analysis, 2015
15.3. Company Profiles
15.3.1. Bristol-Myers Squibb Company
15.3.1.1. Company Overview
15.3.1.2. Business Overview
15.3.1.3. Product Portfolio
15.3.1.4. Financial Overview
15.3.1.5. Recent Developments
15.3.2. Eli Lilly and Company
15.3.2.1. Company Overview
15.3.2.2. Business Overview
15.3.2.3. Product Portfolio
15.3.2.4. Financial Overview
15.3.2.5. Recent Developments
15.3.3. F. Hoffmann-La Roche Ltd.
15.3.3.1. Company Overview
15.3.3.2. Business Overview
15.3.3.3. Product Portfolio
15.3.3.4. Financial Overview
15.3.3.5. Recent Developments
15.3.4. GlaxoSmithKline plc
15.3.4.1. Company Overview
15.3.4.2. Business Overview
15.3.4.3. Product Portfolio
15.3.4.4. Financial Overview
15.3.4.5. Recent Developments
15.3.5. Johnson & Johnson
15.3.5.1. Company Overview
15.3.5.2. Business Overview
15.3.5.3. Product Portfolio
15.3.5.4. Financial Overview
15.3.5.5. Recent Developments
15.3.6. Merck & Co., Inc.
15.3.6.1. Company Overview
15.3.6.2. Business Overview
15.3.6.3. Product Portfolio
15.3.6.4. Financial Overview
15.3.6.5. Recent Developments
15.3.7. Pfizer, Inc.
15.3.7.1. Company Overview
15.3.7.2. Business Overview
15.3.7.3. Product Portfolio
15.3.7.4. Financial Overview
15.3.7.5. Recent Developments
16. Recommendations
List of Tables
Table 1 Global Kaposi Sarcoma Market, By Type of Treatment Snapshot (2014 - 2024)
Table 2 Global Market, By Distribution Channel, Snapshot (2014 - 2024)
Table 3 Global Market, By Geography Snapshot (2014 - 2024)
Table 4 Global Market, by Type of Treatment, (US$ Mn), 2014–2024
Table 5 Global Market, by Distribution Channel, (US$ Mn), 2014–2024
Table 6 Global Kaposi Sarcoma Market, by Region, (US$ Mn), 2014–2024
Table 7 Pipeline Analysis
Table 8 North America Kaposi Sarcoma Market, by Type of Treatment, (US$), 2014–2024
Table 9 North America Market, by Distribution Channel, (US$), 2014– 2024
Table 10 North America Market, by Country, (US$), 2014–2024
Table 11 Europe Kaposi Sarcoma Market, by Type of Treatment, (US$), 2014–2024
Table 12 Europe Market, by Distribution Channel, (US$), 2014–2024
Table 13 Europe Market, by Country, (US$), 2014–2024
Table 14 Asia Pacific Kaposi Sarcoma Market, by Type of Treatment, (US$), 2014–2024
Table 15 Asia Pacific Market, by Distribution Channel, (US$), 2014–2024
Table 16 Asia Pacific Market, by Country, (US$), 2014–2024
Table 17 Latin America Kaposi Sarcoma Market, by Type of Treatment (US$), 2014–2024
Table 18 Latin America Market, by Distribution Channel (US$), 2014–2024
Table 19 Latin America Market, by Country (US$), 2014–2024
Table 20 Middle East & Africa Kaposi Sarcoma Market, by Type of Treatment, (US$), 2014–2024
Table 21 Middle East & Africa Market, by Distribution Channel, (US$), 2014–2024
Table 22 Middle East & Africa Market, by Country, (US$), 2014–2024
Table 23 Radiotherapy and Surgery (Average cost and Number of procedures)
List of Figures
Figure 1 Market Segmentation
Figure 2 Global Kaposi Sarcoma Market Revenue by Type of Treatment, (US$ Mn), 2014–2024
Figure 3 Global Market Revenue, by Distribution Channel, (US$ Mn), 2014–2024
Figure 4 Global Market Revenue, by Geography, (US$ Mn), 2014–2024
Figure 5 Value Chain Analysis
Figure 6 Global Liposomal Anthracyclines Market for Kaposi Sarcoma, (US$ Mn), 2014–2024
Figure 7 Global Alkaloids Market, (US$ Mn), 2014–2024
Figure 8 Global Kaposi Sarcoma Market Attractiveness, by Treatment, 2015
Figure 9 Global Market Attractiveness, by Distribution Channel, 2015
Figure 10 Global Market Attractiveness, by Region, 2015
Figure 11 North America Kaposi Sarcoma Market Attractiveness, by Type of Treatment, 2015
Figure 12 North America Market Attractiveness, by Country, 2015
Figure 13 Europe Kaposi Sarcoma Market Attractiveness, by Treatment, 2015
Figure 14 Europe Market Attractiveness, by Country, 2015
Figure 15 Asia Pacific Kaposi Sarcoma Market Attractiveness, by Type of Treatment, 2015
Figure 16 Asia Pacific Kaposi Sarcoma Market Attractiveness, by Country, 2015
Figure 17 Latin America Market Attractiveness, by Type of Treatment, 2015
Figure 18 Latin America Market Attractiveness, by Country, 2015
Figure 19 Middle East and Africa Kaposi Sarcoma Market Attractiveness, by Treatment, 2015
Figure 20 Middle East and Africa Market Attractiveness, by Country, 2015
Figure 21 Growth Share Matrix, By Key Players (2015)
Figure 22 Market Share Analysis by Key Companies (Value %), 2015
Figure 23 Bristol-Myers Squibb Company Financial Overview (US$ Mn), 2013–2015
Figure 24 Bristol-Myers Squibb Company Revenues by Segment, 2015 (%)
Figure 25 Eli Lilly and Company Financial Overview (US$ Mn), 2013–2015
Figure 26 Eli Lilly and Company Human Pharmaceutical Products sub-segment revenues 2015 (%)
Figure 27 F. Hoffmann-La Roche Ltd. Financial Overview (US$ Mn), 2013–2015
Figure 28 F. Hoffmann-La Roche Ltd. Pharmaceutical sub-segment revenues 2015 (%)
Figure 29 GlaxoSmithKline plc Financial Overview (US$ Mn), 2013–2015
Figure 30 Johnson & Johnson Financial Overview (US$ Mn), 2013–2015
Figure 31 Johnson & Johnson Pharmaceutical sub-segment revenues, 2015 (%)
Figure 32 Merck & Co., Inc. Financial Overview (US$ Mn), 2013–2015
Figure 33 Merck & Co., Inc. Pharmaceutical sub-segment revenues, 2015 (%)
Figure 34 Pfizer, Inc. Financial Overview (US$ Mn), 2013–2015
Figure 35 Pfizer, Inc. Global Vaccines, Oncology, and Consumer Healthcare sub-segment Revenues 2015 (%)
Copyright © Transparency Market Research, Inc. All Rights reserved
Trust Online

Kaposi Sarcoma Market
