The sudden outbreak of the COVID-19 (coronavirus) has exposed the vulnerabilities of several end markets. Hence, companies are treating the life-threatening virus as a wake-up call to streamline their business activities to improve the quality of life of individuals. With the help of extensive studies, companies are increasing the applicability of ion exchange membranes in various end-use cases such as wastewater treatment, desalination, and electrodialysis, among others. Though companies in the ion exchange membrane market are not directly contributing toward the betterment of the society amidst the COVID-19 crisis, stakeholders are using this period as an opportunity to review the strategies for business planning and expansion.
Since most stakeholders in the ion exchange membrane market are spending their time in home isolation, companies are capitalizing on the halt in business activities to come up with investment strategies in innovative technologies. They are increasing focus in cost-efficient ion exchange membrane technologies that are capable of reviving market growth after the end of the COVID-19 pandemic.
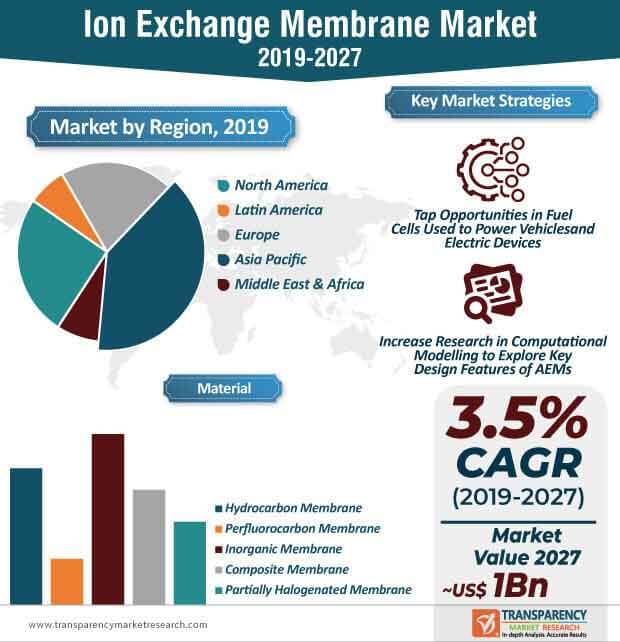
Fuel cells have become one of the biggest hot topics in the ion exchange membrane market. Companies in the market landscape are supporting the production of fuel cells by increasing R&D activities associated with anion exchange membranes (AEMs). As such, the revenue of AEMs is projected for exponential growth in the ion exchange membrane market, where the global value is estimated to reach ~US$ 1 Bn by the end of 2027. Hence, companies are increasing the applicability of fuel cells to power vehicles and electronic devices such as computers and mobile phones.
AEMs are being highly publicized to improve the efficiency of petrol engines in vehicles. AEM fuel cells are replacing proton exchange membranes (PEMs) in the ion exchange membrane market, owing to the former’s advantage of operating under alkaline or basic conditions. Thus, advantageous attributes of AEMs are being highly preferred by companies who are achieving mass production of AEM fuel cells.
Today, wind and solar are one of the fastest-growing energy sources in the world. Gradual depletion of fossil fuels has triggered the demand for renewable energy alternatives in various energy sectors. However, fluctuating energy outputs of renewable energy solutions pose as a barrier for growth of the ion exchange membrane market. This explains why the market for ion exchange membranes is estimated to progress at a sluggish CAGR of 3.5%. Hence, manufacturers are innovating through alkaline metal-air batteries integrated with AEMs to improve stability of electrical grids.
Cation exchange membranes and AEMs are acquiring prominence in zinc-air battery applications. As such, cation exchange membranes are predicted to dictate the second-highest revenue among all charge types in the market landscape. Various advantages of AEMs such as minimizing zincate ion permeation toward the air electrode are generating incremental opportunities for companies in the ion exchange membrane market. Apart from zinc-air batteries, manufacturers are increasing the applicability of cation exchange membranes and AEMs in vanadium redox flow batteries.
Companies in the ion exchange membrane market are focusing on inorganic strategies such as partnerships to gain market penetration. For instance, in May 2029, CAPLINQ— a specialty chemicals company, announced to enter a definitive agreement with the global leader of ion exchange materials, Ionomr, to become the latter’s ‘European Market Partner’ to promote Ionomr products. Thus, strategic partnerships are fueling production activities in the ion exchange membrane market, which is estimated to reach an output of ~8,900 square meters by the end of 2027.
The market for ion exchange membranes is largely consolidated, resulting in high competition among leading players to supply durable and high-performance membranes. They are increasing their production capabilities to develop ion exchange membranes that are stable in both acidic and highly basic environments. Manufacturers are unlocking business potentials in AEM electrolyzers and fuel cells that eliminate the need for expensive materials such as platinum.
Analysts’ Viewpoint
Companies in the ion exchange membrane market are increasing efforts to review their business strategies by focusing on onsite recovery of chemicals for heavy industries post the COVID-19 pandemic. Companies are increasing their manufacturing capabilities to produce proton and cation exchange membranes that hold promising potential as a hydrocarbon-based solution to PEM electrolyzers and fuel cells.
Innovation in fuel cells is a prominent trend in the market landscape. However, the degradation of cations in high pH conditions of fuel cells pose a limitation in the applicability of AEMs. Hence, companies should combine AEMs with different aliphatic or aromatic polymers to prepare AEMs with high conductivity and excellent alkaline stability.
Ion Exchange Membrane Market: Overview
Key Growth Drivers of Ion Exchange Membrane Market
Major Challenges for Ion Exchange Membrane Market
Lucrative Opportunities for Ion Exchange Membrane Market
Asia Pacific to Dominate Ion Exchange Membrane Market
High Demand for Anion Exchange Membranes
Inorganic Material Holds Major Share of Ion Exchange Membrane Market
Presence of Large Number of Domestic Players in Ion Exchange Membrane Market
It was valued at US$ 1.3 Bn in 2023
It is projected to grow at a CAGR of 6.3% from 2024 to 2034
Rise in wastewater treatment activities and expansion in oil & gas sector
Inorganic membrane was the largest material segment in 2023
Asia Pacific was the most lucrative region in 2023
3M, AGC Engineering Co., Ltd., DuPont, Evergreen Technologies Pvt Ltd., FUJIFILM Holdings Corporation, SUEZ Group, Ion Exchange India Ltd., LANXESS, Liaoning Yichen Membrane Technology Co., Ltd., and Merck KGaA
1. Executive Summary
1.1. North America Acid Phosphates Market Snapshot
1.2. Key Market Trends
1.3. Current Market & Future Potential
1.4. TMR’s Growth Opportunity Wheel
2. Market Overview
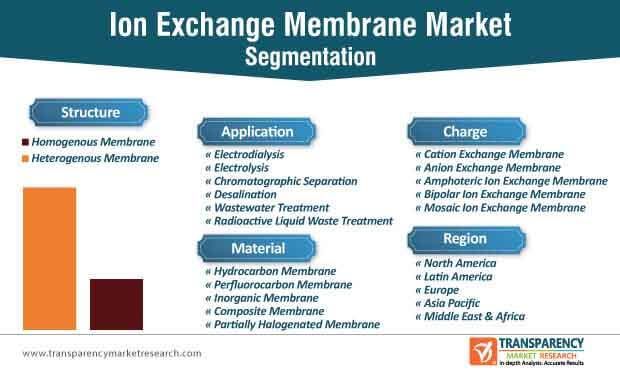
2.1. Market Segmentation
2.2. Market Indicators
2.3. Market Definitions
2.4. Market Trends
2.5. Market Dynamics
2.6. Market Dynamics
2.6.1. Drivers
2.6.2. Restraints
2.6.3. Opportunities
2.7. Porter’s Five Forces Analysis
2.8. Value Chain
2.8.1. List of Suppliers
2.9. Global Ion Exchange Membrane Market Analysis and Forecast, 2018–2027
3. Acid Phosphates Price Trend Analysis, 2018–2027
3.1. By Charge
4. Global Ion Exchange Membrane Market Analysis and Forecast, by Charge, 2018–2027
4.1. Key Findings
4.2. Introduction & Definition
4.3. Global Ion Exchange Membrane Market Volume (Thousand Square Meters) and Value (US$ Mn) Forecast, by Charge, 2018-2027
4.3.1. Cation Exchange Membrane
4.3.2. Anion Exchange Membrane
4.3.3. Amphoteric Ion Exchange Membrane
4.3.4. Bipolar Ion Exchange Membrane
4.3.5. Mosaic Ion Exchange Membrane
5. Global Ion Exchange Membrane Market Analysis and Forecast, by Material, 2018–2027
5.1. Key Findings
5.2. Introduction & Definition
5.3. Global Ion Exchange Membrane Market Volume (Thousand Square Meters) and Value (US$ Mn) Forecast, by Material, 2018–2027
5.3.1. Hydrocarbon Membrane
5.3.2. Perfluorocarbon Membrane
5.3.3. Inorganic Membrane
5.3.4. Composite Membrane
5.3.5. Partially Halogenated Membrane
5.4. Global Ion Exchange Membrane Market Attractiveness, by Material
6. Global Ion Exchange Membrane Market Analysis and Forecast, by Structure, 2018–2027
6.1. Key Findings
6.2. Introduction & Definition
6.3. Global Ion Exchange Membrane Market Volume (Thousand Square Meters) and Value (US$ Mn) Forecast, by Structure, 2018–2027
6.3.1. Homogenous Membrane
6.3.2. Heterogenous Membrane
6.4. Global Ion Exchange Membrane Market Attractiveness, by Structure
7. Global Ion Exchange Membrane Market Analysis and Forecast, by Application, 2018–2027
7.1. Key Findings
7.2. Introduction & Definition
7.3. Global Ion Exchange Membrane Market Volume (Thousand Square Meters) and Value (US$ Mn) Forecast, by Application, 2018–2027
7.3.1. Electrodialysis
7.3.2. Electrolysis
7.3.3. Chromatographic Separation
7.3.4. Desalination
7.3.5. Wastewater Treatment
7.3.6. Radioactive Liquid Waste Treatment
7.4. Global Ion Exchange Membrane Market Attractiveness, by Application
8. Global Ion Exchange Membrane Market Analysis and Forecast, by Region, 2018–2027
8.1. Key Findings
8.2. Global Ion Exchange Membrane Market Volume (Thousand Square Meters) and Value (US$ Mn) Forecast, by Region, 2018–2027
8.2.1. North America
8.2.2. Europe
8.2.3. Asia Pacific
8.2.4. Middle East & Africa
8.2.5. Latin America
8.3. Global Ion Exchange Membrane Market Attractiveness, by Region
9. North America Ion Exchange Membrane Market Analysis and Forecast, 2018–2027
9.1. Key Findings
9.2. North America Ion Exchange Membrane Market Volume (Thousand Square Meters) and Value (US$ Mn) Forecast, by Charge, 2018–2027
9.3. North America Ion Exchange Membrane Market Volume (Thousand Square Meters) and Value (US$ Mn) Forecast, by Material, 2018-2027
9.4. North America Ion Exchange Membrane Market Volume (Thousand Square Meters) and Value (US$ Mn) Forecast, by Structure, 2018–2027
9.5. North America Ion Exchange Membrane Market Volume (Thousand Square Meters) and Value (US$ Mn) Forecast, by Application, 2018–2027
9.5.1. U.S. Ion Exchange Membrane Market Volume (Thousand Square Meters) and Value (US$ Mn) Forecast, by Charge, 2018–2027
9.5.2. U.S. Ion Exchange Membrane Market Volume (Thousand Square Meters) and Value (US$ Mn) Forecast, by Material, 2018-2027
9.5.3. U.S. Ion Exchange Membrane Market Volume (Thousand Square Meters) and Value (US$ Mn) Forecast, by Structure, 2018–2027
9.5.4. U.S. Ion Exchange Membrane Market Volume (Thousand Square Meters) and Value (US$ Mn) Forecast, by Application, 2018–2027
9.5.5. Canada Ion Exchange Membrane Market Volume (Thousand Square Meters) and Value (US$ Mn) Forecast, by Charge, 2018–2027
9.5.6. Canada Ion Exchange Membrane Market Volume (Thousand Square Meters) and Value (US$ Mn) Forecast, by Material, 2018-2027
9.5.7. Canada Ion Exchange Membrane Market Volume (Thousand Square Meters) and Value (US$ Mn) Forecast, by Structure, 2018–2027
9.5.8. Canada Ion Exchange Membrane Market Volume (Thousand Square Meters) and Value (US$ Mn) Forecast, by Application, 2018–2027
9.6. North America Ion Exchange Membrane Market Attractiveness Analysis
10. Europe Ion Exchange Membrane Market Analysis and Forecast, 2018–2027
10.1. Key Findings
10.2. Europe Ion Exchange Membrane Market Volume (Thousand Square Meters) and Value (US$ Mn) Forecast, by Charge, 2018–2027
10.3. Europe Ion Exchange Membrane Market Volume (Thousand Square Meters) and Value (US$ Mn) Forecast, by Material, 2018-2027
10.4. Europe Ion Exchange Membrane Market Volume (Thousand Square Meters) and Value (US$ Mn) Forecast, by Structure, 2018–2027
10.5. Europe Ion Exchange Membrane Market Volume (Thousand Square Meters) and Value (US$ Mn) Forecast, by Application, 2018–2027
10.5.1. Germany Ion Exchange Membrane Market Volume (Thousand Square Meters) and Value (US$ Mn) Forecast, by Charge, 2018–2027
10.5.2. Germany Ion Exchange Membrane Market Volume (Thousand Square Meters) and Value (US$ Mn) Forecast, by Material, 2018-2027
10.5.3. Germany Ion Exchange Membrane Market Volume (Thousand Square Meters) and Value (US$ Mn) Forecast, by Structure, 2018–2027
10.5.4. Germany Ion Exchange Membrane Market Volume (Thousand Square Meters) and Value (US$ Mn) Forecast, by Application, 2018–2027
10.5.5. France Ion Exchange Membrane Market Volume (Thousand Square Meters) and Value (US$ Mn) Forecast, by Charge, 2018–2027
10.5.6. France Ion Exchange Membrane Market Volume (Thousand Square Meters) and Value (US$ Mn) Forecast, by Material, 2018-2027
10.5.7. France Ion Exchange Membrane Market Volume (Thousand Square Meters) and Value (US$ Mn) Forecast, by Structure, 2018–2027
10.5.8. France Ion Exchange Membrane Market Volume (Thousand Square Meters) and Value (US$ Mn) Forecast, by Application, 2018–2027
10.5.9. U.K. Ion Exchange Membrane Market Volume (Thousand Square Meters) and Value (US$ Mn) Forecast, by Charge, 2018–2027
10.5.10. U.K. Ion Exchange Membrane Market Volume (Thousand Square Meters) and Value (US$ Mn) Forecast, by Material, 2018-2027
10.5.11. U.K. Ion Exchange Membrane Market Volume (Thousand Square Meters) and Value (US$ Mn) Forecast, by Structure, 2018–2027
10.5.12. U.K. Ion Exchange Membrane Market Volume (Thousand Square Meters) and Value (US$ Mn) Forecast, by Application, 2018–2027
10.5.13. Italy Ion Exchange Membrane Market Volume (Thousand Square Meters) and Value (US$ Mn) Forecast, by Charge, 2018–2027
10.5.14. Italy Ion Exchange Membrane Market Volume (Thousand Square Meters) and Value (US$ Mn) Forecast, by Material, 2018-2027
10.5.15. Italy Ion Exchange Membrane Market Volume (Thousand Square Meters) and Value (US$ Mn) Forecast, by Structure, 2018–2027
10.5.16. Italy Ion Exchange Membrane Market Volume (Thousand Square Meters) and Value (US$ Mn) Forecast, by Application, 2018–2027
10.5.17. Spain Ion Exchange Membrane Market Volume (Thousand Square Meters) and Value (US$ Mn) Forecast, by Charge, 2018–2027
10.5.18. Spain Ion Exchange Membrane Market Volume (Thousand Square Meters) and Value (US$ Mn) Forecast, by Material, 2018-2027
10.5.19. Spain Ion Exchange Membrane Market Volume (Thousand Square Meters) and Value (US$ Mn) Forecast, by Structure, 2018–2027
10.5.20. Spain Ion Exchange Membrane Market Volume (Thousand Square Meters) and Value (US$ Mn) Forecast, by Application, 2018–2027
10.5.21. Rest of Europe Ion Exchange Membrane Market Volume (Thousand Square Meters) and Value (US$ Mn) Forecast, by Charge, 2018–2027
10.5.22. Rest of Europe Ion Exchange Membrane Market Volume (Thousand Square Meters) and Value (US$ Mn) Forecast, by Material, 2018-2027
10.5.23. Rest of Europe Ion Exchange Membrane Market Volume (Thousand Square Meters) and Value (US$ Mn) Forecast, by Structure, 2018–2027
10.5.24. Rest of Europe Ion Exchange Membrane Market Volume (Thousand Square Meters) and Value (US$ Mn) Forecast, by Application, 2018–2027
10.6. Europe Ion Exchange Membrane Market Attractiveness Analysis
11. Asia Pacific Ion Exchange Membrane Market Analysis and Forecast, 2018–2027
11.1. Key Findings
11.2. Asia Pacific Ion Exchange Membrane Market Volume (Thousand Square Meters) and Value (US$ Mn) Forecast, by Charge, 2018–2027
11.3. Asia Pacific Ion Exchange Membrane Market Volume (Thousand Square Meters) and Value (US$ Mn) Forecast, by Material, 2018-2027
11.4. Asia Pacific Ion Exchange Membrane Market Volume (Thousand Square Meters) and Value (US$ Mn) Forecast, by Structure, 2018–2027
11.5. Asia Pacific Ion Exchange Membrane Market Volume (Thousand Square Meters) and Value (US$ Mn) Forecast, by Application, 2018–2027
11.5.1. China Ion Exchange Membrane Market Volume (Thousand Square Meters) and Value (US$ Mn) Forecast, by Charge, 2018–2027
11.5.2. China Ion Exchange Membrane Market Volume (Thousand Square Meters) and Value (US$ Mn) Forecast, by Material, 2018-2027
11.5.3. China Ion Exchange Membrane Market Volume (Thousand Square Meters) and Value (US$ Mn) Forecast, by Structure, 2018–2027
11.5.4. China Ion Exchange Membrane Market Volume (Thousand Square Meters) and Value (US$ Mn) Forecast, by Application, 2018–2027
11.5.5. India Ion Exchange Membrane Market Volume (Thousand Square Meters) and Value (US$ Mn) Forecast, by Charge, 2018–2027
11.5.6. India Ion Exchange Membrane Market Volume (Thousand Square Meters) and Value (US$ Mn) Forecast, by Material, 2018-2027
11.5.7. India Ion Exchange Membrane Market Volume (Thousand Square Meters) and Value (US$ Mn) Forecast, by Structure, 2018–2027
11.5.8. India Ion Exchange Membrane Market Volume (Thousand Square Meters) and Value (US$ Mn) Forecast, by Application, 2018–2027
11.5.9. Japan Ion Exchange Membrane Market Volume (Thousand Square Meters) and Value (US$ Mn) Forecast, by Charge, 2018–2027
11.5.10. Japan Ion Exchange Membrane Market Volume (Thousand Square Meters) and Value (US$ Mn) Forecast, by Material, 2018-2027
11.5.11. Japan Ion Exchange Membrane Market Volume (Thousand Square Meters) and Value (US$ Mn) Forecast, by Structure, 2018–2027
11.5.12. Japan Ion Exchange Membrane Market Volume (Thousand Square Meters) and Value (US$ Mn) Forecast, by Application, 2018–2027
11.5.13. ASEAN Ion Exchange Membrane Market Volume (Thousand Square Meters) and Value (US$ Mn) Forecast, by Charge, 2018–2027
11.5.14. ASEAN Ion Exchange Membrane Market Volume (Thousand Square Meters) and Value (US$ Mn) Forecast, by Material, 2018-2027
11.5.15. ASEAN Ion Exchange Membrane Market Volume (Thousand Square Meters) and Value (US$ Mn) Forecast, by Structure, 2018–2027
11.5.16. ASEAN Ion Exchange Membrane Market Volume (Thousand Square Meters) and Value (US$ Mn) Forecast, by Application, 2018–2027
11.5.17. Rest of Asia Pacific Ion Exchange Membrane Market Volume (Thousand Square Meters) and Value (US$ Mn) Forecast, by Charge, 2018–2027
11.5.18. Rest of Asia Pacific Ion Exchange Membrane Market Volume (Thousand Square Meters) and Value (US$ Mn) Forecast, by Material, 2018-2027
11.5.19. Rest of Asia Pacific Ion Exchange Membrane Market Volume (Thousand Square Meters) and Value (US$ Mn) Forecast, by Structure, 2018–2027
11.5.20. Rest of Asia Pacific Ion Exchange Membrane Market Volume (Thousand Square Meters) and Value (US$ Mn) Forecast, by Application, 2018–2027
11.6. Asia Pacific Ion Exchange Membrane Market Attractiveness Analysis
12. Latin America Ion Exchange Membrane Market Analysis and Forecast, 2018–2027
12.1. Key Findings
12.2. Latin America Ion Exchange Membrane Market Volume (Thousand Square Meters) and Value (US$ Mn) Forecast, by Charge, 2018–2027
12.3. Latin America Ion Exchange Membrane Market Volume (Thousand Square Meters) and Value (US$ Mn) Forecast, by Material, 2018-2027
12.4. Latin America Ion Exchange Membrane Market Volume (Thousand Square Meters) and Value (US$ Mn) Forecast, by Structure, 2018–2027
12.5. Latin America Ion Exchange Membrane Market Volume (Thousand Square Meters) and Value (US$ Mn) Forecast, by Application, 2018–2027
12.5.1. Brazil Ion Exchange Membrane Market Volume (Thousand Square Meters) and Value (US$ Mn) Forecast, by Charge, 2018–2027
12.5.2. Brazil Ion Exchange Membrane Market Volume (Thousand Square Meters) and Value (US$ Mn) Forecast, by Material, 2018-2027
12.5.3. Brazil Ion Exchange Membrane Market Volume (Thousand Square Meters) and Value (US$ Mn) Forecast, by Structure, 2018–2027
12.5.4. Brazil Ion Exchange Membrane Market Volume (Thousand Square Meters) and Value (US$ Mn) Forecast, by Application, 2018–2027
12.5.5. Mexico Ion Exchange Membrane Market Volume (Thousand Square Meters) and Value (US$ Mn) Forecast, by Charge, 2018–2027
12.5.6. Mexico Ion Exchange Membrane Market Volume (Thousand Square Meters) and Value (US$ Mn) Forecast, by Material, 2018-2027
12.5.7. Mexico Ion Exchange Membrane Market Volume (Thousand Square Meters) and Value (US$ Mn) Forecast, by Structure, 2018–2027
12.5.8. Mexico Ion Exchange Membrane Market Volume (Thousand Square Meters) and Value (US$ Mn) Forecast, by Application, 2018–2027
12.5.9. Rest of Latin America Ion Exchange Membrane Market Volume (Thousand Square Meters) and Value (US$ Mn) Forecast, by Charge, 2018–2027
12.5.10. Rest of Latin America Ion Exchange Membrane Market Volume (Thousand Square Meters) and Value (US$ Mn) Forecast, by Material, 2018-2027
12.5.11. Rest of Latin America Ion Exchange Membrane Market Volume (Thousand Square Meters) and Value (US$ Mn) Forecast, by Structure, 2018–2027
12.5.12. Rest of Latin America Ion Exchange Membrane Market Volume (Thousand Square Meters) and Value (US$ Mn) Forecast, by Application, 2018–2027
12.6. Latin America Ion Exchange Membrane Market Attractiveness Analysis
13. Middle East & Africa Ion Exchange Membrane Market Analysis and Forecast, 2018–2027
13.1. Key Findings
13.2. Middle East & Africa Ion Exchange Membrane Market Volume (Thousand Square Meters) and Value (US$ Mn) Forecast, by Charge, 2018–2027
13.3. Middle East & Africa Ion Exchange Membrane Market Volume (Thousand Square Meters) and Value (US$ Mn) Forecast, by Material, 2018-2027
13.4. Middle East & Africa Ion Exchange Membrane Market Volume (Thousand Square Meters) and Value (US$ Mn) Forecast, by Structure, 2018–2027
13.5. Middle East & Africa Ion Exchange Membrane Market Volume (Thousand Square Meters) and Value (US$ Mn) Forecast, by Application, 2018–2027
13.5.1. GCC Ion Exchange Membrane Market Volume (Thousand Square Meters) and Value (US$ Mn) Forecast, by Charge, 2018–2027
13.5.2. GCC Ion Exchange Membrane Market Volume (Thousand Square Meters) and Value (US$ Mn) Forecast, by Material, 2018-2027
13.5.3. GCC Ion Exchange Membrane Market Volume (Thousand Square Meters) and Value (US$ Mn) Forecast, by Structure, 2018–2027
13.5.4. GCC Ion Exchange Membrane Market Volume (Thousand Square Meters) and Value (US$ Mn) Forecast, by Application, 2018–2027
13.5.5. Egypt Ion Exchange Membrane Market Volume (Thousand Square Meters) and Value (US$ Mn) Forecast, by Charge, 2018–2027
13.5.6. Egypt Ion Exchange Membrane Market Volume (Thousand Square Meters) and Value (US$ Mn) Forecast, by Material, 2018-2027
13.5.7. Egypt Ion Exchange Membrane Market Volume (Thousand Square Meters) and Value (US$ Mn) Forecast, by Structure, 2018–2027
13.5.8. Egypt Ion Exchange Membrane Market Volume (Thousand Square Meters) and Value (US$ Mn) Forecast, by Application, 2018–2027
13.5.9. South Africa Ion Exchange Membrane Market Volume (Thousand Square Meters) and Value (US$ Mn) Forecast, by Charge, 2018–2027
13.5.10. South Africa Ion Exchange Membrane Market Volume (Thousand Square Meters) and Value (US$ Mn) Forecast, by Material, 2018-2027
13.5.11. South Africa Ion Exchange Membrane Market Volume (Thousand Square Meters) and Value (US$ Mn) Forecast, by Structure, 2018–2027
13.5.12. South Africa Ion Exchange Membrane Market Volume (Thousand Square Meters) and Value (US$ Mn) Forecast, by Application, 2018–2027
13.5.13. Radioactive Liquid Waste Treatment
13.5.14. Rest of Middle East & Africa Ion Exchange Membrane Market Volume (Thousand Square Meters) and Value (US$ Mn) Forecast, by Charge, 2018–2027
13.5.15. Rest of Middle East & Africa Ion Exchange Membrane Market Volume (Thousand Square Meters) and Value (US$ Mn) Forecast, by Material, 2018-2027
13.5.16. Rest of Middle East & Africa Ion Exchange Membrane Market Volume (Thousand Square Meters) and Value (US$ Mn) Forecast, by Structure, 2018–2027
13.5.17. Rest of Middle East & Africa Ion Exchange Membrane Market Volume (Thousand Square Meters) and Value (US$ Mn) Forecast, by Application, 2018–2027
13.6. Middle East & Africa Ion Exchange Membrane Market Attractiveness Analysis
14. Competition Landscape
14.1. Market Share Analysis, by Company (2018)
14.2. Market Footprint Analysis, by Region
14.3. Company Profiles (Details – Overview, Financials, Recent Developments, Strategy)
14.3.1. DuPont Inc.
14.3.1.1. Headquarters, Year of Establishment, Revenue, Key Management, Number of Employees
14.3.1.2. Company Description
14.3.1.3. Business Overview
14.3.1.4. Financial Overview
14.3.1.5. Strategic Overview
14.3.2. The DOW Chemical Company
14.3.2.1. Headquarters, Year of Establishment, Revenue, Key Management, Number of Employees
14.3.2.2. Company Description
14.3.2.3. Business Overview
14.3.2.4. Financial Overview
14.3.2.5. Strategic Overview
14.3.3. LANXESS AG
14.3.3.1. Headquarters, Year of Establishment, Revenue, Key Management, Number of Employees
14.3.3.2. Company Description
14.3.3.3. Business Overview
14.3.3.4. Financial Overview
14.3.3.5. Strategic Overview
14.3.4. The Chemours Company
14.3.4.1. Headquarters, Year of Establishment, Revenue, Key Management, Number of Employees
14.3.4.2. Company Description
14.3.4.3. Business Overview
14.3.4.4. Financial Overview
14.3.4.5. Strategic Overview
14.3.5. 3M
14.3.5.1. Headquarters, Year of Establishment, Revenue, Key Management, Number of Employees
14.3.5.2. Company Description
14.3.5.3. Business Overview
14.3.5.4. Financial Overview
14.3.5.5. Strategic Overview
14.3.6. Toray Industries Inc.
14.3.6.1. Headquarters, Year of Establishment, Revenue, Key Management, Number of Employees
14.3.6.2. Company Description
14.3.6.3. Business Overview
14.3.6.4. Financial Overview
14.3.6.5. Strategic Overview
14.3.7. SUEZ S.A.
14.3.7.1. Headquarters, Year of Establishment, Revenue, Key Management, Number of Employees
14.3.7.2. Company Description
14.3.7.3. Business Overview
14.3.7.4. Financial Overview
14.3.7.5. Strategic Overview
14.3.8. Merck KGaA
14.3.8.1. Headquarters, Year of Establishment, Revenue, Key Management, Number of Employees
14.3.8.2. Company Description
14.3.8.3. Business Overview
14.3.8.4. Financial Overview
14.3.8.5. Strategic Overview
14.3.9. Liaoning Yichen Membrane Technology Co., Ltd.
14.3.9.1. Headquarters, Year of Establishment, Key Management
14.3.9.2. Company Description
14.3.9.3. Business Overview
14.3.10. Ionomr Innovations Inc.
14.3.10.1. Headquarters, Year of Establishment, Key Management
14.3.10.2. Company Description
14.3.10.3. Business Overview
14.3.11. FUMATECH BWT GmbH
14.3.11.1. Headquarters, Year of Establishment, Key Management
14.3.11.2. Company Description
14.3.11.3. Business Overview
14.3.12. Fujifilm Manufacturing Europe B.V.
14.3.12.1. Headquarters, Year of Establishment, Key Management
14.3.12.2. Company Description
14.3.12.3. Business Overview
14.3.13. AGC Chemicals Americas, Inc.
14.3.13.1. Headquarters, Year of Establishment, Key Management
14.3.13.2. Company Description
14.3.13.3. Business Overview
14.3.14. ASTOM Corporation
14.3.14.1. Headquarters, Year of Establishment, Key Management
14.3.14.2. Company Description
14.3.14.3. Business Overview
14.3.15. ResinTech Inc.
14.3.15.1. Headquarters, Year of Establishment, Key Management
14.3.15.2. Company Description
14.3.15.3. Business Overview
14.3.16. Ion Exchange Ltd.
14.3.16.1. Headquarters, Year of Establishment, Key Management
14.3.16.2. Company Description
14.3.16.3. Business Overview
15. Primary Research - Key Insights
16. Appendix
List of Tables
Table 1 Global Ion Exchange Membrane Market Volume (Thousand Square Meters) and Value (US$ Mn) Forecast, by Charge, 2018–2027
Table 2 Global Ion Exchange Membrane Market Volume (Thousand Square Meters) and Value (US$ Mn) Forecast, by Material, 2018–2027
Table 3 Global Ion Exchange Membrane Market Volume (Thousand Square Meters) and Value (US$ Mn) Forecast, by Structure, 2018–2027
Table 4 Global Ion Exchange Membrane Market Volume (Thousand Square Meters) and Value (US$ Mn) Forecast, by Application, 2018–2027
Table 5 Global Ion Exchange Membrane Market Volume (Thousand Square Meters) and Value (US$ Mn) Forecast, by Region, 2018–2027
Table 6 North America Ion Exchange Membrane Market Volume (Thousand Square Meters) and Value (US$ Mn) Forecast, by Charge, 2018–2027
Table 7 North America Ion Exchange Membrane Market Volume (Thousand Square Meters) and Value (US$ Mn) Forecast, by Material, 2018–2027
Table 8 North America Ion Exchange Membrane Market Volume (Thousand Square Meters) and Value (US$ Mn) Forecast, by Structure, 2018–2027
Table 9 North America Ion Exchange Membrane Market Volume (Thousand Square Meters) and Value (US$ Mn) Forecast, by Application, 2018–2027
Table 10 North America Ion Exchange Membrane Market Volume (Thousand Square Meters) and Value (US$ Mn) Forecast, by Country, 2018–2027
Table 11 U.S. Ion Exchange Membrane Market Volume (Thousand Square Meters) and Value (US$ Mn) Forecast, by Charge, 2018–2027
Table 12 U.S. Ion Exchange Membrane Market Volume (Thousand Square Meters) and Value (US$ Mn) Forecast, by Material, 2018–2027
Table 13 U.S. Ion Exchange Membrane Market Volume (Thousand Square Meters) and Value (US$ Mn) Forecast, by Structure, 2018–2027
Table 14 U.S. Ion Exchange Membrane Market Volume (Thousand Square Meters) and Value (US$ Mn) Forecast, by Application, 2018–2027
Table 15 Canada Ion Exchange Membrane Market Volume (Thousand Square Meters) and Value (US$ Mn) Forecast, by Charge, 2018–2027
Table 16 Canada Ion Exchange Membrane Market Volume (Thousand Square Meters) and Value (US$ Mn) Forecast, by Material, 2018–2027
Table 17 Canada Ion Exchange Membrane Market Volume (Thousand Square Meters) and Value (US$ Mn) Forecast, by Structure, 2018–2027
Table 18 Canada Ion Exchange Membrane Market Volume (Thousand Square Meters) and Value (US$ Mn) Forecast, by Application, 2018–2027
Table 19 Europe Ion Exchange Membrane Market Volume (Thousand Square Meters) and Value (US$ Mn) Forecast, by Charge, 2018–2027
Table 20 Europe Ion Exchange Membrane Market Volume (Thousand Square Meters) and Value (US$ Mn) Forecast, by Material, 2018–2027
Table 21 Europe Ion Exchange Membrane Market Volume (Thousand Square Meters) and Value (US$ Mn) Forecast, by Structure, 2018–2027
Table 22 Europe Ion Exchange Membrane Market Volume (Thousand Square Meters) and Value (US$ Mn) Forecast, by Application, 2018–2027
Table 23 Europe Ion Exchange Membrane Market Volume (Thousand Square Meters) and Value (US$ Mn) Forecast, by Country and Sub-region, 2018–2027
Table 24 Germany Ion Exchange Membrane Market Volume (Thousand Square Meters) and Value (US$ Mn) Forecast, by Charge, 2018–2027
Table 25 Germany Ion Exchange Membrane Market Volume (Thousand Square Meters) and Value (US$ Mn) Forecast, by Material, 2018–2027
Table 26 Germany Ion Exchange Membrane Market Volume (Thousand Square Meters) and Value (US$ Mn) Forecast, by Structure, 2018–2027
Table 27 Germany Ion Exchange Membrane Market Volume (Thousand Square Meters) and Value (US$ Mn) Forecast, by Application, 2018–2027
Table 28 France Ion Exchange Membrane Market Volume (Thousand Square Meters) and Value (US$ Mn) Forecast, by Charge, 2018–2027
Table 29 France Ion Exchange Membrane Market Volume (Thousand Square Meters) and Value (US$ Mn) Forecast, by Material, 2018–2027
Table 30 France Ion Exchange Membrane Market Volume (Thousand Square Meters) and Value (US$ Mn) Forecast, by Structure, 2018–2027
Table 31 France Ion Exchange Membrane Market Volume (Thousand Square Meters) and Value (US$ Mn) Forecast, by Application, 2018–2027
Table 32 U.K. Ion Exchange Membrane Market Volume (Thousand Square Meters) and Value (US$ Mn) Forecast, by Charge, 2018–2027
Table 33 U.K. Ion Exchange Membrane Market Volume (Thousand Square Meters) and Value (US$ Mn) Forecast, by Material, 2018–2027
Table 34 U.K. Ion Exchange Membrane Market Volume (Thousand Square Meters) and Value (US$ Mn) Forecast, by Structure, 2018–2027
Table 35 U.K. Ion Exchange Membrane Market Volume (Thousand Square Meters) and Value (US$ Mn) Forecast, by Application, 2018–2027
Table 36 Italy Ion Exchange Membrane Market Volume (Thousand Square Meters) and Value (US$ Mn) Forecast, by Charge, 2018–2027
Table 37 Italy Ion Exchange Membrane Market Volume (Thousand Square Meters) and Value (US$ Mn) Forecast, by Material, 2018–2027
Table 38 Italy Ion Exchange Membrane Market Volume (Thousand Square Meters) and Value (US$ Mn) Forecast, by Structure, 2018–2027
Table 39 Italy Ion Exchange Membrane Market Volume (Thousand Square Meters) and Value (US$ Mn) Forecast, by Application, 2018–2027
Table 40 Spain Ion Exchange Membrane Market Volume (Thousand Square Meters) and Value (US$ Mn) Forecast, by Charge, 2018–2027
Table 41 Spain Ion Exchange Membrane Market Volume (Thousand Square Meters) and Value (US$ Mn) Forecast, by Material, 2018–2027
Table 42 Spain Ion Exchange Membrane Market Volume (Thousand Square Meters) and Value (US$ Mn) Forecast, by Structure, 2018–2027
Table 43 Spain Ion Exchange Membrane Market Volume (Thousand Square Meters) and Value (US$ Mn) Forecast, by Application, 2018–2027
Table 44 Rest of Europe Ion Exchange Membrane Market Volume (Thousand Square Meters) and Value (US$ Mn) Forecast, by Charge, 2018–2027
Table 45 Rest of Europe Ion Exchange Membrane Market Volume (Thousand Square Meters) and Value (US$ Mn) Forecast, by Material, 2018–2027
Table 46 Rest of Europe Ion Exchange Membrane Market Volume (Thousand Square Meters) and Value (US$ Mn) Forecast, by Structure, 2018–2027
Table 47 Rest of Europe Ion Exchange Membrane Market Volume (Thousand Square Meters) and Value (US$ Mn) Forecast, by Application, 2018–2027
Table 48 Asia Pacific Ion Exchange Membrane Market Volume (Thousand Square Meters) and Value (US$ Mn) Forecast, by Charge, 2018–2027
Table 49 Asia Pacific Ion Exchange Membrane Market Volume (Thousand Square Meters) and Value (US$ Mn) Forecast, by Material, 2018–2027
Table 50 Asia Pacific Ion Exchange Membrane Market Volume (Thousand Square Meters) and Value (US$ Mn) Forecast, by Structure, 2018–2027
Table 51 Asia Pacific Ion Exchange Membrane Market Volume (Thousand Square Meters) and Value (US$ Mn) Forecast, by Application, 2018–2027
Table 52 Asia Pacific Ion Exchange Membrane Market Volume (Thousand Square Meters) and Value (US$ Mn) Forecast, by Country and Sub-region, 2018–2027
Table 53 China Ion Exchange Membrane Market Volume (Thousand Square Meters) and Value (US$ Mn) Forecast, by Charge, 2018–2027
Table 54 China Ion Exchange Membrane Market Volume (Thousand Square Meters) and Value (US$ Mn) Forecast, by Material, 2018–2027
Table 55 China Ion Exchange Membrane Market Volume (Thousand Square Meters) and Value (US$ Mn) Forecast, by Structure, 2018–2027
Table 56 China Ion Exchange Membrane Market Volume (Thousand Square Meters) and Value (US$ Mn) Forecast, by Application, 2018–2027
Table 57 Japan Ion Exchange Membrane Market Volume (Thousand Square Meters) and Value (US$ Mn) Forecast, by Charge, 2018–2027
Table 58 Japan Ion Exchange Membrane Market Volume (Thousand Square Meters) and Value (US$ Mn) Forecast, by Material, 2018–2027
Table 59 Japan Ion Exchange Membrane Market Volume (Thousand Square Meters) and Value (US$ Mn) Forecast, by Structure, 2018–2027
Table 60 Japan Ion Exchange Membrane Market Volume (Thousand Square Meters) and Value (US$ Mn) Forecast, by Application, 2018–2027
Table 61 India Ion Exchange Membrane Market Volume (Thousand Square Meters) and Value (US$ Mn) Forecast, by Charge, 2018–2027
Table 62 India Ion Exchange Membrane Market Volume (Thousand Square Meters) and Value (US$ Mn) Forecast, by Material, 2018–2027
Table 63 India Ion Exchange Membrane Market Volume (Thousand Square Meters) and Value (US$ Mn) Forecast, by Structure, 2018–2027
Table 64 India Ion Exchange Membrane Market Volume (Thousand Square Meters) and Value (US$ Mn) Forecast, by Application, 2018–2027
Table 65 ASEAN Ion Exchange Membrane Market Volume (Thousand Square Meters) and Value (US$ Mn) Forecast, by Charge, 2018–2027
Table 66 ASEAN Ion Exchange Membrane Market Volume (Thousand Square Meters) and Value (US$ Mn) Forecast, by Material, 2018–2027
Table 67 ASEAN Ion Exchange Membrane Market Volume (Thousand Square Meters) and Value (US$ Mn) Forecast, by Structure, 2018–2027
Table 68 ASEAN Ion Exchange Membrane Market Volume (Thousand Square Meters) and Value (US$ Mn) Forecast, by Application, 2018–2027
Table 69 Rest of Asia Pacific Ion Exchange Membrane Market Volume (Thousand Square Meters) and Value (US$ Mn) Forecast, by Charge, 2018–2027
Table 70 Rest of Asia Pacific Ion Exchange Membrane Market Volume (Thousand Square Meters) and Value (US$ Mn) Forecast, by Material, 2018–2027
Table 71 Rest of Asia Pacific Ion Exchange Membrane Market Volume (Thousand Square Meters) and Value (US$ Mn) Forecast, by Structure, 2018–2027
Table 72 Rest of Asia Pacific Ion Exchange Membrane Market Volume (Thousand Square Meters) and Value (US$ Mn) Forecast, by Application, 2018–2027
Table 73 Latin America Ion Exchange Membrane Market Volume (Thousand Square Meters) and Value (US$ Mn) Forecast, by Charge, 2018–2027
Table 74 Latin America Ion Exchange Membrane Market Volume (Thousand Square Meters) and Value (US$ Mn) Forecast, by Material, 2018–2027
Table 75 Latin America Ion Exchange Membrane Market Volume (Thousand Square Meters) and Value (US$ Mn) Forecast, by Structure, 2018–2027
Table 76 Latin America Ion Exchange Membrane Market Volume (Thousand Square Meters) and Value (US$ Mn) Forecast, by Application, 2018–2027
Table 77 Latin America Ion Exchange Membrane Market Volume (Thousand Square Meters) and Value (US$ Mn) Forecast, by Country and Sub-region, 2018–2027
Table 78 Brazil Ion Exchange Membrane Market Volume (Thousand Square Meters) and Value (US$ Mn) Forecast, by Charge, 2018–2027
Table 79 Brazil Ion Exchange Membrane Market Volume (Thousand Square Meters) and Value (US$ Mn) Forecast, by Material, 2018–2027
Table 80 Brazil Ion Exchange Membrane Market Volume (Thousand Square Meters) and Value (US$ Mn) Forecast, by Structure, 2018–2027
Table 81 Brazil Ion Exchange Membrane Market Volume (Thousand Square Meters) and Value (US$ Mn) Forecast, by Application, 2018–2027
Table 82 Mexico Ion Exchange Membrane Market Volume (Thousand Square Meters) and Value (US$ Mn) Forecast, by Charge, 2018–2027
Table 83 Mexico Ion Exchange Membrane Market Volume (Thousand Square Meters) and Value (US$ Mn) Forecast, by Material, 2018–2027
Table 84 Mexico Ion Exchange Membrane Market Volume (Thousand Square Meters) and Value (US$ Mn) Forecast, by Structure, 2018–2027
Table 85 Mexico Ion Exchange Membrane Market Volume (Thousand Square Meters) and Value (US$ Mn) Forecast, by Application, 2018–2027
Table 86 Rest of Latin America Ion Exchange Membrane Market Volume (Thousand Square Meters) and Value (US$ Mn) Forecast, by Charge, 2018–2027
Table 87 Rest of Latin America Ion Exchange Membrane Market Volume (Thousand Square Meters) and Value (US$ Mn) Forecast, by Material, 2018–2027
Table 88 Rest of Latin America Ion Exchange Membrane Market Volume (Thousand Square Meters) and Value (US$ Mn) Forecast, by Structure, 2018–2027
Table 89 Rest of Latin America Ion Exchange Membrane Market Volume (Thousand Square Meters) and Value (US$ Mn) Forecast, by Application, 2018–2027
Table 90 Middle East and Africa Ion Exchange Membrane Market Volume (Thousand Square Meters) and Value (US$ Mn) Forecast, by Charge, 2018–2027
Table 91 Middle East and Africa Ion Exchange Membrane Market Volume (Thousand Square Meters) and Value (US$ Mn) Forecast, by Material, 2018–2027
Table 92 Middle East and Africa Ion Exchange Membrane Market Volume (Thousand Square Meters) and Value (US$ Mn) Forecast, by Structure, 2018–2027
Table 93 Middle East and Africa Ion Exchange Membrane Market Volume (Thousand Square Meters) and Value (US$ Mn) Forecast, by Application, 2018–2027
Table 94 Middle East and Africa Ion Exchange Membrane Market Volume (Thousand Square Meters) and Value (US$ Mn) Forecast, by Country and Sub-region, 2018–2027
Table 95 GCC Ion Exchange Membrane Market Volume (Thousand Square Meters) and Value (US$ Mn) Forecast, by Charge, 2018–2027
Table 96 GCC Ion Exchange Membrane Market Volume (Thousand Square Meters) and Value (US$ Mn) Forecast, by Material, 2018–2027
Table 97 GCC Ion Exchange Membrane Market Volume (Thousand Square Meters) and Value (US$ Mn) Forecast, by Structure, 2018–2027
Table 98 GCC Ion Exchange Membrane Market Volume (Thousand Square Meters) and Value (US$ Mn) Forecast, by Application, 2018–2027
Table 99 Egypt Ion Exchange Membrane Market Volume (Thousand Square Meters) and Value (US$ Mn) Forecast, by Charge, 2018–2027
Table 100 Egypt Ion Exchange Membrane Market Volume (Thousand Square Meters) and Value (US$ Mn) Forecast, by Material, 2018–2027
Table 101 Egypt Ion Exchange Membrane Market Volume (Thousand Square Meters) and Value (US$ Mn) Forecast, by Structure, 2018–2027
Table 102 Egypt Ion Exchange Membrane Market Volume (Thousand Square Meters) and Value (US$ Mn) Forecast, by Application, 2018–2027
Table 103 South Africa Ion Exchange Membrane Market Volume (Thousand Square Meters) and Value (US$ Mn) Forecast, by Charge, 2018–2027
Table 104 South Africa Ion Exchange Membrane Market Volume (Thousand Square Meters) and Value (US$ Mn) Forecast, by Material, 2018–2027
Table 105 South Africa Ion Exchange Membrane Market Volume (Thousand Square Meters) and Value (US$ Mn) Forecast, by Structure, 2018–2027
Table 106 South Africa Ion Exchange Membrane Market Volume (Thousand Square Meters) and Value (US$ Mn) Forecast, by Application, 2018–2027
Table 107 Rest of Middle East and Africa Ion Exchange Membrane Market Volume (Thousand Square Meters) and Value (US$ Mn) Forecast, by Charge, 2018–2027
Table 108 Rest of Middle East and Africa Ion Exchange Membrane Market Volume (Thousand Square Meters) and Value (US$ Mn) Forecast, by Material, 2018–2027
Table 109 Rest of Middle East and Africa Ion Exchange Membrane Market Volume (Thousand Square Meters) and Value (US$ Mn) Forecast, by Structure, 2018–2027
Table 110 Rest of Middle East and Africa Ion Exchange Membrane Market Volume (Thousand Square Meters) and Value (US$ Mn) Forecast, by Application, 2018–2027
List of Figures
Figure 1 Global Ion Exchange Membrane Price Trend, by Charge, 2018–2027 (US$/Square Meter)
Figure 2 Global Ion Exchange Membrane Market Volume (Thousand Square Meters) and Value (US$ Mn) Forecast, 2019–2027
Figure 3 Global Ion Exchange Membrane Market Value Share, by Charge, 2018, 2023, and 2027
Figure 4 Global Ion Exchange Membrane Market Attractiveness, by Charge
Figure 5 Global Ion Exchange Membrane Market Value Share, by Material, 2018, 2023, and 2027
Figure 6 Global Ion Exchange Membrane Market Attractiveness, by Material
Figure 7 Global Ion Exchange Membrane Market Value Share, by Structure, 2018, 2023, and 2027
Figure 8 Global Ion Exchange Membrane Market Attractiveness, by Structure
Figure 9 Global Ion Exchange Membrane Market Value Share, by Application, 2018, 2023, and 2027
Figure 10 Global Ion Exchange Membrane Market Attractiveness, by Application
Figure 11 Global Ion Exchange Membrane Market Value Share, by Region, 2018, 2023, and 2027
Figure 12 Global Ion Exchange Membrane Market Attractiveness, by Region
Figure 13 North America Ion Exchange Membrane Market Value Share, by Charge, 2018, 2023, and 2027
Figure 14 North America Ion Exchange Membrane Market Attractiveness, by Charge
Figure 15 North America Ion Exchange Membrane Market Value Share, by Material, 2018, 2023, and 2027
Figure 16 North America Ion Exchange Membrane Market Attractiveness, by Material
Figure 17 North America Ion Exchange Membrane Market Value Share, by Structure, 2018, 2023, and 2027
Figure 18 North America Ion Exchange Membrane Market Attractiveness, by Structure
Figure 19 North America Ion Exchange Membrane Market Value Share, by Application, 2018, 2023, and 2027
Figure 20 North America Ion Exchange Membrane Market Attractiveness, by Application
Figure 21 North America Ion Exchange Membrane Market Value Share, by Country, 2018, 2023, and 2027
Figure 22 North America Ion Exchange Membrane Market Attractiveness, by Country
Figure 23 Europe Ion Exchange Membrane Market Value Share, by Charge, 2018, 2023, and 2027
Figure 24 Europe Ion Exchange Membrane Market Attractiveness, by Charge
Figure 25 Europe Ion Exchange Membrane Market Value Share, by Material, 2018, 2023, and 2027
Figure 26 Europe Ion Exchange Membrane Market Attractiveness, by Material
Figure 27 Europe Ion Exchange Membrane Market Value Share, by Structure, 2018, 2023, and 2027
Figure 28 Europe Ion Exchange Membrane Market Attractiveness, by Structure
Figure 29 Europe Ion Exchange Membrane Market Value Share, by Application, 2018, 2023, and 2027
Figure 30 Europe Ion Exchange Membrane Market Attractiveness, by Application
Figure 31 Europe Ion Exchange Membrane Market Value Share, by Country and Sub-region, 2018, 2023, and 2027
Figure 32 Europe Ion Exchange Membrane Market Attractiveness, by Country and Sub-region
Figure 33 Asia Pacific Ion Exchange Membrane Market Value Share, by Charge, 2018, 2023, and 2027
Figure 34 Asia Pacific Ion Exchange Membrane Market Attractiveness, by Charge
Figure 35 Asia Pacific Ion Exchange Membrane Market Value Share, by Material, 2018, 2023, and 2027
Figure 36 Asia Pacific Ion Exchange Membrane Market Attractiveness, by Material
Figure 37 Asia Pacific Ion Exchange Membrane Market Value Share, by Structure, 2018, 2023, and 2027
Figure 38 Asia Pacific Ion Exchange Membrane Market Attractiveness, by Structure
Figure 39 Asia Pacific Ion Exchange Membrane Market Value Share, by Application, 2018, 2023, and 2027
Figure 40 Asia Pacific Ion Exchange Membrane Market Attractiveness, by Application
Figure 41 Asia Pacific Ion Exchange Membrane Market Value Share, by Country and Sub-region, 2018, 2023, and 2027
Figure 42 Asia Pacific Ion Exchange Membrane Market Attractiveness, by Country and Sub-region
Figure 43 Latin America Ion Exchange Membrane Market Value Share, by Charge, 2018, 2023, and 2027
Figure 44 Latin America Ion Exchange Membrane Market Attractiveness, by Charge
Figure 45 Latin America Ion Exchange Membrane Market Value Share, by Material, 2018, 2023, and 2027
Figure 46 Latin America Ion Exchange Membrane Market Attractiveness, by Material
Figure 47 Latin America Ion Exchange Membrane Market Value Share, by Structure, 2018, 2023, and 2027
Figure 48 Latin America Ion Exchange Membrane Market Attractiveness, by Structure
Figure 49 Latin America Ion Exchange Membrane Market Value Share, by Application, 2018, 2023, and 2027
Figure 50 Latin America Ion Exchange Membrane Market Attractiveness, by Application
Figure 51 Latin America Ion Exchange Membrane Market Value Share, by Country and Sub-region, 2018, 2023, and 2027
Figure 52 Latin America Ion Exchange Membrane Market Attractiveness, by Country and Sub-region
Figure 53 Middle East and Africa Ion Exchange Membrane Market Value Share, by Charge, 2018, 2023, and 2027
Figure 54 Middle East and Africa Ion Exchange Membrane Market Attractiveness, by Charge
Figure 55 Middle East and Africa Ion Exchange Membrane Market Value Share, by Material, 2018, 2023, and 2027
Figure 56 Middle East and Africa Ion Exchange Membrane Market Attractiveness, by Material
Figure 57 Middle East and Africa Ion Exchange Membrane Market Value Share, by Structure, 2018, 2023, and 2027
Figure 58 Middle East and Africa Ion Exchange Membrane Market Attractiveness, by Structure
Figure 59 Middle East and Africa Ion Exchange Membrane Market Value Share, by Application, 2018, 2023, and 2027
Figure 60 Middle East and Africa Ion Exchange Membrane Market Attractiveness, by Application
Figure 61 Middle East and Africa Ion Exchange Membrane Market Value Share, by Country and Sub-region, 2018, 2023, and 2027
Figure 62 Middle East and Africa Ion Exchange Membrane Market Attractiveness, by Country and Sub-region
Figure 63 Ion Exchange Membrane Company Market Share Analysis, 2018
Copyright © Transparency Market Research, Inc. All Rights reserved
Trust Online

Ion Exchange Membrane Market, Forecast, 2019 - 2027
