Reports
Reports
North America hydraulic fluid connectors market is witnessing robust growth as a result of the U.S.'s industrial primacy. Canada is benefiting from new mechanization in agriculture and industrial companies, thereby increasing adoption of fully mechanized industrial automation; growing demand for high-performance manufacturer branded connectors.

Product innovation is the core driver of increased demand in the North America hydraulic fluid connectors market due to more operational efficiency, mechanical fit maintenance, and adherence to strict environmental standards that exist in many industrialized locations and industries. The transition to automation, expanding infrastructure for future demand, and sustainable product transition are calling for leak-free, long-lasting, connectors for sensors.
Hydraulic fluid connectors are foundational components of every hydraulic system, functioning to allow high-pressure fluids to be transferred securely among hoses, tubes, and the other components in the system. Examples of connectors include hoses, fittings, adapters, quick disconnect couplings, and their respective clamps and accessories.
Each connector’s design maintains integrity under high fluid pressure while permitting the connection to flow without leakage. Connectors are designed to meet extreme conditions that include extreme pressure, extreme temperature, and extreme environmental conditions. Hydraulics continue to be used in a variety of verticals such as construction, agriculture, oil & gas, aerospace, automotive, mining, and manufacturing.
While hydraulic connectors may be developed for each specifying component of the working fluid. Materials could be inclusive of steel, stainless steel, brass, aluminum, and advanced polymers. Material selection depends on fluid compatibility, operating pressure, and exposure to corrosion or abrasion. Connectors utilize commonly accepted and standardized thread types (SAE, ISO, DIN, BSP, JIC, ORFS, etc.) for facilitating universal interaction across various applications.
| Attribute | Detail |
|---|---|
| North America Hydraulic Fluid Connectors Market Drivers |
|
Construction is booming in the United States, which drives a lot of demand for hydraulic fluid connectors. As the U.S. Census Bureau shows - Construction spending increased by over US$ 400 Bn from 2021 (US$1.7 Tn) to 2024 (US$ 2.1 Tn), and investing aggressively in new residential, commercial, and infrastructure projects is proving to be a good defense against an overall economic downturn.
The large hydraulic machines - excavators, loaders, cranes, etc. - heavily rely on hydraulic systems and connectors. High-pressure hoses and fittings have high operational safety risks, so connectors successfully aiding quick disconnect and leak-proof operation help in increasing efficiency and safety.
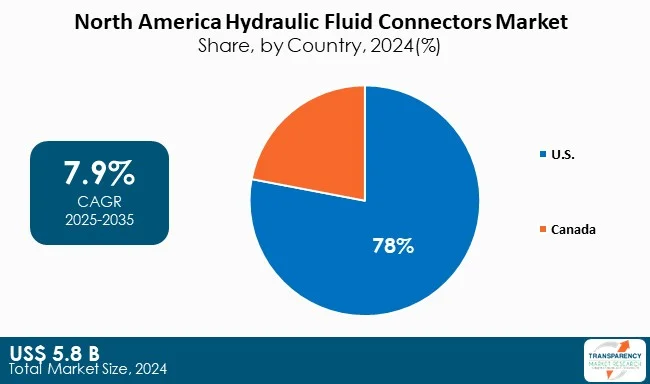
The Infrastructure Investment and Jobs Act (IIJA), signed into law in November of 2021, provides US$ 1.2 Tn through 2031, which helps drive future demand for connections to hydraulic-driven equipment in road, bridge, and energy projects, with the U.S. comprising nearly 78% of North America hydraulic fluid connectors market share. The continued investment will help ensure continued projects for connections, hoses, fittings, and quick disconnects among suppliers.
Suppliers that provide connectors with strong value propositions of durability, leak-free efficiency (coated surface on hose end connector for leak-free durability), and/or industry standards for connectors will benefit by riding the increased demand-offer in conjunction with timely availability supplemented by demand.
Statistics Canada reports that Canadian farm equipment sales exceeded US$ 3.1 Bn in 2023, with tremendous growth in tractors, harvesters, and sprayers, which have a stronger reliance on hydraulic systems.
The modern equipment is designed for efficient, safe, and flexible operation under advanced hydraulic hoses, fittings, and couplings that enhance farmers' and agricultural service buyers' operational efficiencies under different climate conditions across Canada. The Canadian Agricultural Partnership (Canadian $3 Bn, 2018–2025), amongst the other government-supported programs, are designed to help farmers adopt new technologies on their farms, thus propelling demand for reliable connectors.
Canadian's proportion of the North America hydraulic fluid connectors market is about 11.0%. However, the focus on modernizing farm machinery represents a specific yet growing opportunity. Manufacturers that supply abrasion resistant hoses and quick couplings designed for cold applications are gaining market acceptance along the agricultural belt of Canada.

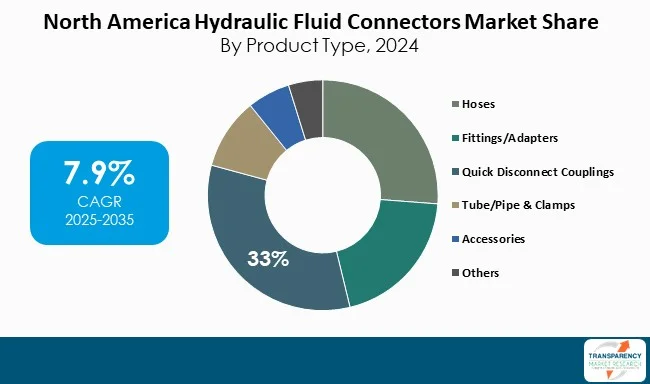
Quick disconnect couplings (QDCs) are dominating the North America hydraulic fluid connectors market with a share of 33% in 2024. QDCs are favored by end-users largely due to the increased demand for quick, safe, and leak-free connections in mobile and industrial hydraulic applications.
In the U. S. construction industry where spending exceeds US$ 2.1 Tn in 2024, QDCs are typically found in excavators, loaders, and lifting equipment. In the Canadian agricultural industry, QDCs are used to allow the operator to rapidly attach and detach sprayer or harvester attachments, improving task time, and efficiency during peak harvest time. QDCs are also preferred due to their low-spill designs and compliance with environmental regulatory requirements in sectors the oil & gas vertical, where accidental hydraulic leaks pose both - safety and compliance issues.

| Attribute | Detail |
|---|---|
| Leading Country | U.S. is the leading country in the North America Hydraulic Fluid Connectors market |
The United States held nearly 78% share in 2024, driven by its strong industrial base and extensive end-use adoption. The country’s manufacturing sector, valued at US$ 2.5 Tn in 2023 (U.S. Bureau of Economic Analysis), is a major consumer of hydraulic systems for presses, machine tools, and factory automation, each requiring reliable connectors for high-pressure fluid transfer.
The U.S. energy industry further contributes to demand, with shale oil and gas production exceeding 12.9 million barrels per day in 2023 (EIA), thereby making durable hoses and fittings in drilling and hydraulic fracturing equipment imperative. Additionally, the U.S. defense sector, with a US$ 842 Bn budget in 2024, does invest heavily in hydraulic-intensive systems such as armored vehicles and aircraft ground support.
Parker Hannifin Corporation leads the North America hydraulic fluid connectors market with the widest range of hoses, fittings, quick couplings, and adapters in the industry. With its historical innovations and broad applications, Parker Hannifin sets the standard for reliability, efficiency, and performance in hydraulic connector solutions.
Gates incorporates its large product availability and robust aftermarket to ascertain reliability across mobile and industrial hydraulic applications. By focusing on high-pressure hose and coupling systems, Gates does drive market growth in hydraulic connectors across construction, agriculture, and energy verticals.
Danfoss Power Solutions, Swagelok Company, Cameron International Corporation, RYCO Hydraulics Pty. Ltd., Manuli Hydraulics, Kurt Hydraulics, Brennan Industries, ITI Corporation, and SPX Corporation are some other leading companies in the North America hydraulic fluid connectors market.
Each of these players has been profiled in the North America hydraulic fluid connectors market research report based on parameters such as company overview, financial overview, business strategies, product portfolio, business segments, and recent developments.
| Attribute | Detail |
|---|---|
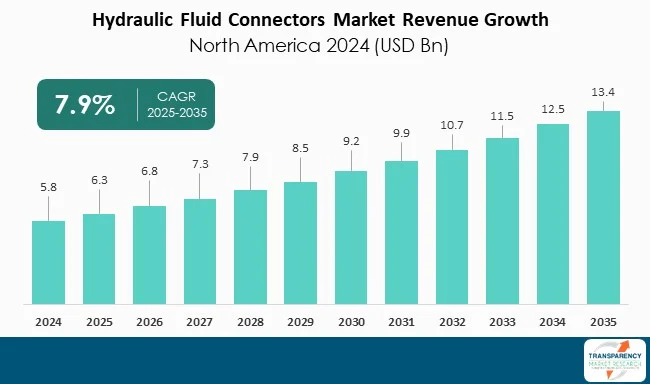
| Market Size Value in 2024 | US$ 5.8 Bn |
| Market Forecast Value in 2035 | US$ 13.4 Bn |
| Growth Rate (CAGR) | 7.9% |
| Forecast Period | 2025–2035 |
| Historical Data Available for | 2020-2023 |
| Quantitative Units | US$ Bn for Value & Units for Volume |
| Market Analysis | It includes cross-segment analysis at the North America as well as regional level. Furthermore, the qualitative analysis includes drivers, restraints, Hydraulic Fluid Connectors market opportunities, key trends, Porter’s Five Forces analysis, value chain analysis, and key trend analysis. |
| Competition Landscape |
|
| Format | Electronic (PDF) + Excel |
| Market Segmentation | Product Type
|
| Regions Covered |
|
| Countries Covered |
|
| Companies Profiled |
|
| Customization Scope | Available upon request |
| Pricing | Available upon request |
The North America hydraulic fluid connectors market was valued at US$ 5.8 Bn in 2024
The North America hydraulic fluid connectors industry is expected to grow at a CAGR of 7.9% from 2025 to 2035
Expanding construction and infrastructure development in the U.S. and rising agricultural mechanization and equipment modernization in Canada
Quick disconnect couplings was the largest product type segment in the North America hydraulic fluid connectors market
U.S. was the most lucrative country in 2024
Parker Hannifin Corporation, Gates Corporation, Danfoss Power Solutions, Swagelok Company, Cameron International Corporation, RYCO Hydraulics Pty. Ltd., Manuli Hydraulics, Kurt Hydraulics, Brennan Industries, ITI Corporation, and SPX Corporation are some other leading companies in the North America hydraulic fluid connectors market
Table 1 North America Hydraulic Fluid Connectors Market Volume (Units) Forecast, by Product Type, 2020 to 2035
Table 2 North America Hydraulic Fluid Connectors Market Value (US$ Bn) Forecast, by Product Type, 2020 to 2035
Table 3 North America Hydraulic Fluid Connectors Market Volume (Units) Forecast, by Material, 2020 to 2035
Table 4 North America Hydraulic Fluid Connectors Market Value (US$ Bn) Forecast, by Material, 2020 to 2035
Table 5 North America Hydraulic Fluid Connectors Market Volume (Units) Forecast, by Assembly Method 2020 to 2035
Table 6 North America Hydraulic Fluid Connectors Market Value (US$ Bn) Forecast, by Assembly Method 2020 to 2035
Table 7 North America Hydraulic Fluid Connectors Market Volume (Units) Forecast, by Pressure Class, 2020 to 2035
Table 8 North America Hydraulic Fluid Connectors Market Value (US$ Bn) Forecast, by Pressure Class, 2020 to 2035
Table 9 North America Hydraulic Fluid Connectors Market Volume (Units) Forecast, by End-use, 2020 to 2035
Table 10 North America Hydraulic Fluid Connectors Market Value (US$ Bn) Forecast, by End-use, 2020 to 2035
Table 11 North America Hydraulic Fluid Connectors Market Volume (Units) Forecast, by Region, 2020 to 2035
Table 12 North America Hydraulic Fluid Connectors Market Value (US$ Bn) Forecast, by Region, 2020 to 2035
Table 13 North America Hydraulic Fluid Connectors Market Volume (Units) Forecast, by Product Type, 2020 to 2035
Table 14 North America Hydraulic Fluid Connectors Market Value (US$ Bn) Forecast, by Product Type, 2020 to 2035
Table 15 North America Hydraulic Fluid Connectors Market Volume (Units) Forecast, by Material, 2020 to 2035
Table 16 North America Hydraulic Fluid Connectors Market Value (US$ Bn) Forecast, by Material, 2020 to 2035
Table 17 North America Hydraulic Fluid Connectors Market Volume (Units) Forecast, by Assembly Method 2020 to 2035
Table 18 North America Hydraulic Fluid Connectors Market Value (US$ Bn) Forecast, by Assembly Method 2020 to 2035
Table 19 North America Hydraulic Fluid Connectors Market Volume (Units) Forecast, by Pressure Class, 2020 to 2035
Table 20 North America Hydraulic Fluid Connectors Market Value (US$ Bn) Forecast, by Pressure Class, 2020 to 2035
Table 21 North America Hydraulic Fluid Connectors Market Volume (Units) Forecast, by End-use, 2020 to 2035
Table 22 North America Hydraulic Fluid Connectors Market Value (US$ Bn) Forecast, by End-use, 2020 to 2035
Table 23 North America Hydraulic Fluid Connectors Market Volume (Units) Forecast, by Country, 2020 to 2035
Table 24 North America Hydraulic Fluid Connectors Market Value (US$ Bn) Forecast, by Country, 2020 to 2035
Table 25 U.S. Hydraulic Fluid Connectors Market Volume (Units) Forecast, by Product Type, 2020 to 2035
Table 26 U.S. Hydraulic Fluid Connectors Market Value (US$ Bn) Forecast, by Product Type, 2020 to 2035
Table 27 U.S. Hydraulic Fluid Connectors Market Volume (Units) Forecast, by Material, 2020 to 2035
Table 28 U.S. Hydraulic Fluid Connectors Market Value (US$ Bn) Forecast, by Material, 2020 to 2035
Table 29 U.S. Hydraulic Fluid Connectors Market Volume (Units) Forecast, by Assembly Method 2020 to 2035
Table 30 U.S. Hydraulic Fluid Connectors Market Value (US$ Bn) Forecast, by Assembly Method, 2020 to 2035
Table 31 U.S. Hydraulic Fluid Connectors Market Volume (Units) Forecast, by Pressure Class, 2020 to 2035
Table 32 U.S. Hydraulic Fluid Connectors Market Value (US$ Bn) Forecast, by Pressure Class, 2020 to 2035
Table 33 U.S. Hydraulic Fluid Connectors Market Volume (Units) Forecast, by End-use, 2020 to 2035
Table 34 U.S. Hydraulic Fluid Connectors Market Value (US$ Bn) Forecast, by End-use, 2020 to 2035
Table 35 Canada Hydraulic Fluid Connectors Market Volume (Units) Forecast, by Product Type, 2020 to 2035
Table 36 Canada Hydraulic Fluid Connectors Market Value (US$ Bn) Forecast, by Product Type, 2020 to 2035
Table 37 Canada Hydraulic Fluid Connectors Market Volume (Units) Forecast, by Material, 2020 to 2035
Table 38 Canada Hydraulic Fluid Connectors Market Value (US$ Bn) Forecast, by Material, 2020 to 2035
Table 39 Canada Hydraulic Fluid Connectors Market Volume (Units) Forecast, by Assembly Method, 2020 to 2035
Table 40 Canada Hydraulic Fluid Connectors Market Value (US$ Bn) Forecast, by Assembly Method, 2020 to 2035
Table 41 Canada Hydraulic Fluid Connectors Market Volume (Units) Forecast, by Pressure Class, 2020 to 2035
Table 42 Canada Hydraulic Fluid Connectors Market Value (US$ Bn) Forecast, by Pressure Class, 2020 to 2035
Table 43 Canada Hydraulic Fluid Connectors Market Volume (Units) Forecast, by End-use, 2020 to 2035
Table 44 Canada Hydraulic Fluid Connectors Market Value (US$ Bn) Forecast, by End-use 2020 to 2035
Figure 1 North America Hydraulic Fluid Connectors Market Volume Share Analysis, by Product Type, 2024, 2028, and 2035
Figure 2 North America Hydraulic Fluid Connectors Market Attractiveness, by Product Type
Figure 3 North America Hydraulic Fluid Connectors Market Volume Share Analysis, by Material, 2024, 2028, and 2035
Figure 4 North America Hydraulic Fluid Connectors Market Attractiveness, by Material
Figure 5 North America Hydraulic Fluid Connectors Market Volume Share Analysis, by Assembly Method, 2024, 2028, and 2035
Figure 6 North America Hydraulic Fluid Connectors Market Attractiveness, by Assembly Method
Figure 7 North America Hydraulic Fluid Connectors Market Volume Share Analysis, by Pressure Class, 2024, 2028, and 2035
Figure 8 North America Hydraulic Fluid Connectors Market Attractiveness, by Pressure Class
Figure 9 North America Hydraulic Fluid Connectors Market Volume Share Analysis, by End-use, 2024, 2028, and 2035
Figure 10 North America Hydraulic Fluid Connectors Market Attractiveness, by End-use
Figure 11 North America Hydraulic Fluid Connectors Market Volume Share Analysis, by Region, 2024, 2028, and 2035
Figure 12 North America Hydraulic Fluid Connectors Market Attractiveness, by Region
Figure 13 North America Hydraulic Fluid Connectors Market Volume Share Analysis, by Product Type, 2024, 2028, and 2035
Figure 14 North America Hydraulic Fluid Connectors Market Attractiveness, by Product Type
Figure 15 North America Hydraulic Fluid Connectors Market Attractiveness, by Product Type
Figure 16 North America Hydraulic Fluid Connectors Market Volume Share Analysis, by Material, 2024, 2028, and 2035
Figure 17 North America Hydraulic Fluid Connectors Market Attractiveness, by Material
Figure 18 North America Hydraulic Fluid Connectors Market Volume Share Analysis, by Assembly Method, 2024, 2028, and 2035
Figure 19 North America Hydraulic Fluid Connectors Market Attractiveness, by Assembly Method
Figure 20 North America Hydraulic Fluid Connectors Market Volume Share Analysis, by Pressure Class, 2024, 2028, and 2035
Figure 21 North America Hydraulic Fluid Connectors Market Attractiveness, by Pressure Class
Figure 22 North America Hydraulic Fluid Connectors Market Volume Share Analysis, by End-use, 2024, 2028, and 2035
Figure 23 North America Hydraulic Fluid Connectors Market Attractiveness, by End-use
Figure 24 North America Hydraulic Fluid Connectors Market Attractiveness, by Country and Sub-region