Green petroleum coke is obtained by decaying coke from the coker unit. When crude oil is converted into gasoline and jet fuels, green petroleum coke is obtained as a by-product. The quality of green petroleum coke depends on the quality of crude oil. The term ‘green’ refers to the stage of production process. The sulfur content in green petroleum coke decides the application of green petroleum coke. High sulfur content green petroleum coke is mainly used as a fuel in place of coal. Green petroleum coke with low sulfur content is upgraded through calcining and is used as a raw material for the production of aluminum and steel.
The global green petroleum coke market is expected to expand at a significant rate driven by increase in demand from the cement industry. The green petroleum coke market was valued at about US$ 12 Bn in 2016 and is projected to expand at a CAGR of 6.1% during the forecast period. Factors such as strict government laws regarding carbon emissions, rise in demand for fabrication of aluminum smelter anodes, rise in prices of coal, and depletion of coal resources are driving demand for green petroleum coke. Strict government regulations that play a very important role in the green petroleum coke market. The environment is affected by toxins released through industrialization and emissions of harmful gases such as carbon dioxide, hydroxides, sulfur, and nitrogen from factories and vehicles. Green petroleum coke is highly stable and non-reactive to the ambient environment, as it has very low sulfur and ash content. It is an alternative energy source for coal that has high calorific value. Also, it poses less environmental hazards. However, the presence of very few key players in the green petroleum coke market and fragmentation of the market are likely to hamper its expansion. Additionally, the market is so volatile that prices changes on weekly basis sometimes.
Key players in the green petroleum coke market need to focus on the promotion of the benefits of green petroleum coke over coal. The use of green petroleum coke in ceramics and electronics industries can boost the green petroleum coke market. When green petroleum coke is mixed with additives such as binders and sealants, it offers excellent adhesion to the material.
Major players in the market expand their network and share their investments through mergers and acquisitions. Launch of new products and facilities is likely to propel the green petroleum coke market. In May 2015, Asbury Carbons invested US$ 48 Mn in a new facility in Lumberton, North Carolina. The company decided to open the facility in North Carolina due to the state’s favorable access to rails and ports. In July 2014, Oxbow Corporation announced the acquisition of Carbon Resources LLC, a distributor and supplier of activated carbon products made from wood, coconut shells, and coal. Oxbow acquired the company to expand its footprint in the global activated carbon industry. In June 2015, the company initiated a six line expansion project, which is the largest project in the region. This project will enhance the smelter’s production with a capacity of 540,000 metric tons per year and will increase the production capacity up to 1.5 million metric tons per annum. This project will make the company the world largest single site aluminum smelter.
Green petroleum coke is used in the form of sponge coke, shot coke, purge coke, needle coke, and honeycomb coke. Sponge coke is most widely used as a solid fuel to manufacture anodes in the aluminum industry. It is a porous coke produced by adding effective amounts of a carbonaceous material that contains oxygen. Purge coke is produced during the process of producing heat form coking reactions to convert vacuum residual into gasses, distillate liquids, and coke. This process is known as flexi coking. Needle coke is mainly produced from coal tar pitch or FCC decant oil. It is also known as acicular coke. It has high resemblance to the collection of vertical aligned needles. The properties of needle coke include a low puffing tendency, low coefficient of thermal expansion, and high mechanical strength. Needle coke is used for making graphite electrodes for electric arc furnaces. Shot coke has a high density. It is the abnormal form of delayed coke. It is hard, dense, nonporous, vitreous, and sphered shape. Shot coke is used to manufacture titanium dioxide, nuclear graphite, and graphite mold stocks. Honeycomb is an intermediate type of coke. It has elliptical pores that are uniformly distributed amongst each other. It is known as intermediate coke because it is neither as productive as needle coke nor is it like shot or sponge coke.
This coke has lower electric conductivity and lower coefficient of thermal expansion as compared to needle coke .
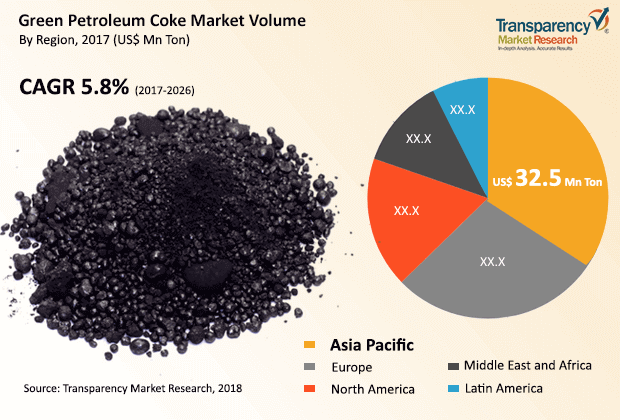
North America and Europe are the key regions of the green petroleum coke market. Asia Pacific holds a major share of the global green petroleum coke market, in terms of consumption, due to high demand in the construction sector, led by a rise in population. Middle East & Africa is an emerging region of the green petroleum coke market, due to high demand and fuel availability.
The green petroleum coke market in India and China is expected to expand at a rapid pace during the forecast period, due to rise in industrialization and expansion in the construction industry in these countries. China is a major supplier of petroleum coke in Asia.
Key players operating in the green petroleum coke market include Oxbow Corporation, AMINCO RESOURCES LLC., Asbury Carbons, Aluminium Bahrain (Alba), Atha Group, Carbograf Industrial S.A. de C.V., Rain Carbon Inc., Minmat Ferro Alloys Private Limited, Shandong KeYu Energy Co., Ltd. Weifang Lianxing New Material Technology Co., Ltd. Linyi Zhenhua Carbon Technology Co., Ltd. COCAN (HUBEI) GRAPHITE MILL INC. Modern Industrial Investment Holding Group. Sinoway Carbon Co., Ltd., and Ningxia Wanboda Carbons & Graphite Co., Ltd.
Green Petroleum Coke Market to Attract High Revenues with Increasing Expansion of Road and Rail Transport Sector
Green oil coke is gotten by rotting coke from the coker unit. At the point when unrefined petroleum is changed over into gas and fly fills, green petrol coke is acquired as a result. The nature of green petrol coke relies upon the nature of unrefined petroleum. The term 'green' alludes to the phase of creation measure. The sulfur content in green petrol coke chooses the utilization of green oil coke. High sulfur content green oil coke is for the most part utilized as a fuel instead of coal. Green oil coke having low sulfur content is overhauled through calcining and is utilized as a crude material for the creation of aluminum and steel.
The development in rail, vehicle and transport improvement is prompting expanded interest for steel, and petroleum coke has additionally requested the extension of the market for green petroleum coke. There is generally little debris substance of green petroleum coke and subsequently negligible poisonousness in a wide scope of ventures. The development of the Green petroleum coke market is supplemented by lower cargo costs joined with better preservation of assets.
North America and Europe are the vital districts of this market earning the highest revenues. Besides this, Asia Pacific is also holding a significant portion of the worldwide green petroleum coke market, as far as utilization, because of appeal in the development area, driven by an ascent in populace. Center East and Africa is an arising locale of the green petroleum coke market, because of popularity and fuel accessibility.
The market for green petroleum coke is controlled by the power area, power plants, constructing, and expanding request in the aluminum and steel areas. Expanded creation of aluminum and expanded utilization of petroleum coke in the Asia-Pacific force and concrete ventures are factors that fundamentally drive development in the oil coke market. Furthermore, green petroleum coke emits less carbon, provided there is low sulfur content, thereby augmenting the growth of the global market in the coming years.
In 2016, Green Petroleum Coke Market was valued at US$ 12 billion
Green Petroleum Coke Market is estimated to rise at a CAGR of 6.1 % during forecast period
The global green petroleum coke market is expected to expand at a significant rate driven by increase in demand from the cement industry
North America and Europe is more attractive for vendors in the Green Petroleum Coke Market
Key players of Green Petroleum Coke Market are Oxbow Corporation, AMINCO RESOURCES LLC., Asbury Carbons, Aluminium Bahrain (Alba), Atha Group, Carbograf Industrial S.A. de C.V., Rain Carbon Inc., Minmat Ferro Alloys Private Limited, Shandong KeYu Energy Co., Ltd. Weifang Lianxing New Material Technology Co., Ltd. Linyi Zhenhua Carbon Technology Co., Ltd. COCAN (HUBEI) GRAPHITE MILL INC. Modern Industrial Investment Holding Group. Sinoway Carbon Co., Ltd., and Ningxia Wanboda Carbons & Graphite C
1. Preface
1.1. Market Definition and Scope
1.2. Market Segmentation
1.3. Research Highlights
1.4. Key Research Objectives
2. Assumptions and Research Methodology
3. Executive Summary: Global Green Petroleum Coke Market
4. Market Overview
4.1. Introduction
4.1.1. Product Definition
4.1.2. Key Industry Developments
4.2. Market Dynamics
4.2.1. Drivers
4.2.2. Restraints
4.2.3. Opportunity
4.3. Porter's Five Analysis
4.4. Regulatory Landscape
4.5. Value Chain Analysis
4.6. Traders/Distributors
4.7. List of Potential Customers
4.8. Green Petroleum Coke Specifications
4.9. Global Green Petroleum Coke Market Forecast, 2012–2026
5. Global Green Petroleum Coke Market Analysis and Forecast, by Source
5.1. Key Trends
5.2. Definitions & Introduction
5.3. Market Size (Mn Tons) (US$ Mn), by Source, 2012–2026
5.3.1. Anode
5.3.2. Fuel
6. Global Green Petroleum Coke Market Analysis and Forecast, by Form
6.1. Key Trends
6.2. Definitions & Introduction
6.3. Market Size (Mn Tons) (US$ Mn), by Form, 2012-2026
6.3.1. Sponge coke
6.3.2. Purge coke
6.3.3. Needle coke
6.3.4. Shot coke
6.3.5. Honeycomb coke
7. Global Green Petroleum Coke Market Analysis and Forecast, by Application
7.1. Key Trends
7.2. Definitions & Introduction
7.3. Market Size (Mn Tons) (US$ Mn), by Application, 2012–2026
7.3.1. Aluminum
7.3.2. Calcined coke
7.3.3. Cement
7.3.4. Power Stations
7.3.5. Graphite Electrode
7.3.5.1. Regular Power Graphite Electrode
7.3.5.2. Others
7.3.6. Others
7.4. Global Green Petroleum Coke Market Attractiveness Analysis, by Source, Form and Application
8. Global Green Petroleum Cokes Market Analysis and Forecast, by Region, 2012-2026
8.1. Key Trends
8.2. Definitions & Introduction
8.3. Market Size (Mn Tons) (US$ Mn), by Region, 2012-2026
8.3.1. North America
8.3.2. Europe
8.3.3. Asia Pacific
8.3.4. Middle East & Africa
8.3.5. Latin America
8.4. Global Green Petroleum Coke Market Attractiveness Analysis, by Region
9. North America Green Petroleum Coke Market Analysis & Forecasts
9.1. Key Findings
9.2. Market Size (Mn Tons) (US$ Mn), by Source, 2012–2026
9.2.1. Anode
9.2.2. Fuel
9.3. Market Size (Mn Tons) (US$ Mn), by Form, 2012-2026
9.3.1. Sponge coke
9.3.2. Purge coke
9.3.3. Needle coke
9.3.4. Shot coke
9.3.5. Honeycomb coke
9.4. Market Size (Mn Tons) (US$ Mn), by Application, 2012–2026
9.4.1. Aluminum
9.4.2. Calcined coke
9.4.3. Cement
9.4.4. Power Stations
9.4.5. Graphite Electrode
9.4.5.1. Regular Power Graphite Electrode
9.4.5.2. Others
9.4.6. Others
9.5. U.S. Market Size (Mn Tons) (US$ Mn), by Source, 2012–2026
9.5.1. Anode
9.5.2. Fuel
9.6. U.S. Market Size (Mn Tons) (US$ Mn), by Form, 2012-2026
9.6.1. Sponge coke
9.6.2. Purge coke
9.6.3. Needle coke
9.6.4. Shot coke
9.6.5. Honeycomb coke
9.7. U.S. Market Size (Mn Tons) (US$ Mn), by Application, 2012–2026
9.7.1. Aluminum
9.7.2. Calcined coke
9.7.3. Cement
9.7.4. Power Stations
9.7.5. Graphite Electrode
9.7.5.1. Regular Power Graphite Electrode
9.7.5.2. Others
9.7.6. Others
9.8. Canada Market Size (Mn Tons) (US$ Mn), by Source, 2012–2026
9.8.1. Anode
9.8.2. Fuel
9.9. Canada Market Size (Mn Tons) (US$ Mn), by Form, 2012-2026
9.9.1. Sponge coke
9.9.2. Purge coke
9.9.3. Needle coke
9.9.4. Shot coke
9.9.5. Honeycomb coke
9.10. Canada Market Size (Mn Tons) (US$ Mn), by Application, 2012–2026
9.10.1. Aluminum
9.10.2. Calcined coke
9.10.3. Cement
9.10.4. Power Stations
9.10.5. Graphite Electrode
9.10.5.1. Regular Power Graphite Electrode
9.10.5.2. Others
9.10.6. Others
9.11. North America Market Attractiveness
10. Europe Green Petroleum Coke Market Analysis & Forecasts
10.1. Key Findings
10.2. Market Size (Mn Tons) (US$ Mn), by Source, 2012–2026
10.2.1. Anode
10.2.2. Fuel
10.3. Market Size (Mn Tons) (US$ Mn), by Form, 2012-2026
10.3.1. Sponge coke
10.3.2. Purge coke
10.3.3. Needle coke
10.3.4. Shot coke
10.3.5. Honeycomb coke
10.4. Market Size (Mn Tons) (US$ Mn), by Application, 2012–2026
10.4.1. Aluminum
10.4.2. Calcined coke
10.4.3. Cement
10.4.4. Power Stations
10.4.5. Graphite Electrode
10.4.5.1. Regular Power Graphite Electrode
10.4.5.2. Others
10.4.6. Others
10.5. Germany Market Size (Mn Tons) (US$ Mn), by Source, 2012–2026
10.5.1. Anode
10.5.2. Fuel
10.6. Germany Market Size (Mn Tons) (US$ Mn), by Form, 2012-2026
10.6.1. Sponge coke
10.6.2. Purge coke
10.6.3. Needle coke
10.6.4. Shot coke
10.6.5. Honeycomb coke
10.7. Germany Market Size (Mn Tons) (US$ Mn), by Application, 2012–2026
10.7.1. Aluminum
10.7.2. Calcined coke
10.7.3. Cement
10.7.4. Power Stations
10.7.5. Graphite Electrode
10.7.5.1. Regular Power Graphite Electrode
10.7.5.2. Others
10.7.6. Others
10.8. U.K. Market Size (Mn Tons) (US$ Mn), by Source, 2012–2026
10.8.1. Anode
10.8.2. Fuel
10.9. U.K. Market Size (Mn Tons) (US$ Mn), by Form, 2012-2026
10.9.1. Sponge coke
10.9.2. Purge coke
10.9.3. Needle coke
10.9.4. Shot coke
10.9.5. Honeycomb coke
10.10. U.K. Market Size (Mn Tons) (US$ Mn), by Application, 2012–2026
10.10.1. Aluminum
10.10.2. Calcined coke
10.10.3. Cement
10.10.4. Power Stations
10.10.5. Graphite Electrode
10.10.5.1. Regular Power Graphite Electrode
10.10.5.2. Others
10.10.6. Others
10.11. France Market Size (Mn Tons) (US$ Mn), by Source, 2012–2026
10.11.1. Anode
10.11.2. Fuel
10.12. France Market Size (Mn Tons) (US$ Mn), by Form, 2012-2026
10.12.1. Sponge coke
10.12.2. Purge coke
10.12.3. Needle coke
10.12.4. Shot coke
10.12.5. Honeycomb coke
10.13. France Market Size (Mn Tons) (US$ Mn), by Application, 2012–2026
10.13.1. Aluminum
10.13.2. Calcined coke
10.13.3. Cement
10.13.4. Power Stations
10.13.5. Graphite Electrode
10.13.5.1. Regular Power Graphite Electrode
10.13.5.2. Others
10.13.6. Others
10.14. Spain Market Size (Mn Tons) (US$ Mn), by Source, 2012–2026
10.14.1. Anode
10.14.2. Fuel
10.15. Spain Market Size (Mn Tons) (US$ Mn), by Form, 2012-2026
10.15.1. Sponge coke
10.15.2. Purge coke
10.15.3. Needle coke
10.15.4. Shot coke
10.15.5. Honeycomb coke
10.16. Spain Market Size (Mn Tons) (US$ Mn), by Application, 2012–2026
10.16.1. Aluminum
10.16.2. Calcined coke
10.16.3. Cement
10.16.4. Power Stations
10.16.5. Graphite Electrode
10.16.5.1. Regular Power Graphite Electrode
10.16.5.2. Others
10.16.6. Others
10.17. Italy Market Size (Mn Tons) (US$ Mn), by Source, 2012–2026
10.17.1. Anode
10.17.2. Fuel
10.18. Italy Market Size (Mn Tons) (US$ Mn), by Form, 2012-2026
10.18.1. Sponge coke
10.18.2. Purge coke
10.18.3. Needle coke
10.18.4. Shot coke
10.18.5. Honeycomb coke
10.19. Italy Market Size (Mn Tons) (US$ Mn), by Application, 2012–2026
10.19.1. Aluminum
10.19.2. Calcined coke
10.19.3. Cement
10.19.4. Power Stations
10.19.5. Graphite Electrode
10.19.5.1. Regular Power Graphite Electrode
10.19.5.2. Others
10.19.6. Others
10.20. Greece Market Size (Mn Tons) (US$ Mn), by Source, 2012–2026
10.20.1. Anode
10.20.2. Fuel
10.21. Greece Market Size (Mn Tons) (US$ Mn), by Form, 2012-2026
10.21.1. Sponge coke
10.21.2. Purge coke
10.21.3. Needle coke
10.21.4. Shot coke
10.21.5. Honeycomb coke
10.22. Greece Market Size (Mn Tons) (US$ Mn), by Application, 2012–2026
10.22.1. Aluminum
10.22.2. Calcined coke
10.22.3. Cement
10.22.4. Power Stations
10.22.5. Graphite Electrode
10.22.5.1. Regular Power Graphite Electrode
10.22.5.2. Others
10.22.6. Others
10.23. Turkey Market Size (Mn Tons) (US$ Mn), by Source, 2012–2026
10.23.1. Anode
10.23.2. Fuel
10.24. Turkey Market Size (Mn Tons) (US$ Mn), by Form, 2012-2026
10.24.1. Sponge coke
10.24.2. Purge coke
10.24.3. Needle coke
10.24.4. Shot coke
10.24.5. Honeycomb coke
10.25. Turkey Market Size (Mn Tons) (US$ Mn), by Application, 2012–2026
10.25.1. Aluminum
10.25.2. Calcined coke
10.25.3. Cement
10.25.4. Power Stations
10.25.5. Graphite Electrode
10.25.5.1. Regular Power Graphite Electrode
10.25.5.2. Others
10.25.6. Others
10.26. Russia & CIS Market Size (Mn Tons) (US$ Mn), by Source, 2012–2026
10.26.1. Anode
10.26.2. Fuel
10.27. Russia &CIS Market Size (Mn Tons) (US$ Mn), by Form, 2012-2026
10.27.1. Sponge coke
10.27.2. Purge coke
10.27.3. Needle coke
10.27.4. Shot coke
10.27.5. Honeycomb coke
10.28. Russia & CIS Market Size (Mn Tons) (US$ Mn), by Application, 2012–2026
10.28.1. Aluminum
10.28.2. Calcined coke
10.28.3. Cement
10.28.4. Power Stations
10.28.5. Graphite Electrode
10.28.5.1. Regular Power Graphite Electrode
10.28.5.2. Others
10.28.6. Others
10.29. Rest of Europe Market Size (Mn Tons) (US$ Mn), by Source, 2012–2026
10.29.1. Anode
10.29.2. Fuel
10.30. Rest of Europe Market Size (Mn Tons) (US$ Mn), by Form, 2012-2026
10.30.1. Sponge coke
10.30.2. Purge coke
10.30.3. Needle coke
10.30.4. Shot coke
10.30.5. Honeycomb coke
10.31. Rest of Europe Market Size (Mn Tons) (US$ Mn), by Application, 2012–2026
10.31.1. Aluminum
10.31.2. Calcined coke
10.31.3. Cement
10.31.4. Power Stations
10.31.5. Graphite Electrode
10.31.5.1. Regular Power Graphite Electrode
10.31.5.2. Others
10.31.6. Others
10.32. Europe Market Attractiveness
11. Asia Pacific Green Petroleum Coke Market Analysis & Forecasts
11.1. Key Findings
11.2. Market Size (Mn Tons) (US$ Mn), by Source, 2012–2026
11.2.1. Anode
11.2.2. Fuel
11.3. Market Size (Mn Tons) (US$ Mn), by Form, 2012-2026
11.3.1. Sponge coke
11.3.2. Purge coke
11.3.3. Needle coke
11.3.4. Shot coke
11.3.5. Honeycomb coke
11.4. Market Size (Mn Tons) (US$ Mn), by Application, 2012–2026
11.4.1. Aluminum
11.4.2. Calcined coke
11.4.3. Cement
11.4.4. Power Stations
11.4.5. Graphite Electrode
11.4.5.1. Regular Power Graphite Electrode
11.4.5.2. Others
11.4.6. Others
11.5. China Market Size (Mn Tons) (US$ Mn), by Source, 2012–2026
11.5.1. Anode
11.5.2. Fuel
11.6. China Market Size (Mn Tons) (US$ Mn), by Form, 2012-2026
11.6.1. Sponge coke
11.6.2. Purge coke
11.6.3. Needle coke
11.6.4. Shot coke
11.6.5. Honeycomb coke
11.7. China Market Size (Mn Tons) (US$ Mn), by Application, 2012–2026
11.7.1. Aluminum
11.7.2. Calcined coke
11.7.3. Cement
11.7.4. Power Stations
11.7.5. Graphite Electrode
11.7.5.1. Regular Power Graphite Electrode
11.7.5.2. Others
11.7.6. Others
11.8. Japan Market Size (Mn Tons) (US$ Mn), by Source, 2012–2026
11.8.1. Anode
11.8.2. Fuel
11.9. Japan Market Size (Mn Tons) (US$ Mn), by Form, 2012-2026
11.9.1. Sponge coke
11.9.2. Purge coke
11.9.3. Needle coke
11.9.4. Shot coke
11.9.5. Honeycomb coke
11.10. Japan Market Size (Mn Tons) (US$ Mn), by Application, 2012–2026
11.10.1. Aluminum
11.10.2. Calcined coke
11.10.3. Cement
11.10.4. Power Stations
11.10.5. Graphite Electrode
11.10.5.1. Regular Power Graphite Electrode
11.10.5.2. Others
11.10.6. Others
11.11. India Market Size (Mn Tons) (US$ Mn), by Source, 2012–2026
11.11.1. Anode
11.11.2. Fuel
11.12. India Market Size (Mn Tons) (US$ Mn), by Form, 2012-2026
11.12.1. Sponge coke
11.12.2. Purge coke
11.12.3. Needle coke
11.12.4. Shot coke
11.12.5. Honeycomb coke
11.13. India Market Size (Mn Tons) (US$ Mn), by Application, 2012–2026
11.13.1. Aluminum
11.13.2. Calcined coke
11.13.3. Cement
11.13.4. Power Stations
11.13.5. Graphite Electrode
11.13.5.1. Regular Power Graphite Electrode
11.13.5.2. Others
11.13.6. Others
11.14. Australia Market Size (Mn Tons) (US$ Mn), by Source, 2012–2026
11.14.1. Anode
11.14.2. Fuel
11.15. Australia Market Size (Mn Tons) (US$ Mn), by Form, 2012-2026
11.15.1. Sponge coke
11.15.2. Purge coke
11.15.3. Needle coke
11.15.4. Shot coke
11.15.5. Honeycomb coke
11.16. Australia Market Size (Mn Tons) (US$ Mn), by Application, 2012–2026
11.16.1. Aluminum
11.16.2. Calcined coke
11.16.3. Cement
11.16.4. Power Stations
11.16.5. Graphite Electrode
11.16.5.1. Regular Power Graphite Electrode
11.16.5.2. Others
11.16.6. Others
11.17. ASEAN Market Size (Mn Tons) (US$ Mn), by Source, 2012–2026
11.17.1. Anode
11.17.2. Fuel
11.18. ASEAN Market Size (Mn Tons) (US$ Mn), by Form, 2012-2026
11.18.1. Sponge coke
11.18.2. Purge coke
11.18.3. Needle coke
11.18.4. Shot coke
11.18.5. Honeycomb coke
11.19. ASEAN Market Size (Mn Tons) (US$ Mn), by Application, 2012–2026
11.19.1. Aluminum
11.19.2. Calcined coke
11.19.3. Cement
11.19.4. Power Stations
11.19.5. Graphite Electrode
11.19.5.1. Regular Power Graphite Electrode
11.19.5.2. Others
11.19.6. Others
11.20. Rest of Asia Pacific Market Size (Mn Tons) (US$ Mn), by Source, 2012–2026
11.20.1. Anode
11.20.2. Fuel
11.21. Rest of Asia Pacific Market Size (Mn Tons) (US$ Mn), by Form, 2012-2026
11.21.1. Sponge coke
11.21.2. Purge coke
11.21.3. Needle coke
11.21.4. Shot coke
11.21.5. Honeycomb coke
11.22. Rest of Asia Pacific Market Size (Mn Tons) (US$ Mn), by Application, 2012–2026
11.22.1. Aluminum
11.22.2. Calcined coke
11.22.3. Cement
11.22.4. Power Stations
11.22.5. Graphite Electrode
11.22.5.1. Regular Power Graphite Electrode
11.22.5.2. Others
11.22.6. Others
11.23. Asia Pacific Market Attractiveness
12. Latin America Green Petroleum Coke Market Analysis & Forecasts
12.1. Key Findings
12.2. Market Size (Mn Tons) (US$ Mn), by Source, 2012–2026
12.2.1. Anode
12.2.2. Fuel
12.3. Market Size (Mn Tons) (US$ Mn), by Form, 2012-2026
12.3.1. Sponge coke
12.3.2. Purge coke
12.3.3. Needle coke
12.3.4. Shot coke
12.3.5. Honeycomb coke
12.4. Market Size (Mn Tons) (US$ Mn), by Application, 2012–2026
12.4.1. Aluminum
12.4.2. Calcined coke
12.4.3. Cement
12.4.4. Power Stations
12.4.5. Graphite Electrode
12.4.5.1. Regular Power Graphite Electrode
12.4.5.2. Others
12.4.6. Others
12.5. Brazil Market Size (Mn Tons) (US$ Mn), by Source, 2012–2026
12.5.1. Anode
12.5.2. Fuel
12.6. Brazil Market Size (Mn Tons) (US$ Mn), by Form, 2012-2026
12.6.1. Sponge coke
12.6.2. Purge coke
12.6.3. Needle coke
12.6.4. Shot coke
12.6.5. Honeycomb coke
12.7. Brazil Market Size (Mn Tons) (US$ Mn), by Application, 2012–2026
12.7.1. Aluminum
12.7.2. Calcined coke
12.7.3. Cement
12.7.4. Power Stations
12.7.5. Graphite Electrode
12.7.5.1. Regular Power Graphite Electrode
12.7.5.2. Others
12.7.6. Others
12.8. Mexico Market Size (Mn Tons) (US$ Mn), by Source, 2012–2026
12.8.1. Anode
12.8.2. Fuel
12.9. Mexico Market Size (Mn Tons) (US$ Mn), by Form, 2012-2026
12.9.1. Sponge coke
12.9.2. Purge coke
12.9.3. Needle coke
12.9.4. Shot coke
12.9.5. Honeycomb coke
12.10. Mexico Market Size (Mn Tons) (US$ Mn), by Application, 2012–2026
12.10.1. Aluminum
12.10.2. Calcined coke
12.10.3. Cement
12.10.4. Power Stations
12.10.5. Graphite Electrode
12.10.5.1. Regular Power Graphite Electrode
12.10.5.2. Others
12.10.6. Others
12.11. Rest of Latin America Market Size (Mn Tons) (US$ Mn), by Source, 2012–2026
12.11.1. Anode
12.11.2. Fuel
12.12. Rest of Latin America Market Size (Mn Tons) (US$ Mn), by Form, 2012-2026
12.12.1. Sponge coke
12.12.2. Purge coke
12.12.3. Needle coke
12.12.4. Shot coke
12.12.5. Honeycomb coke
12.13. Rest of Latin America Market Size (Mn Tons) (US$ Mn), by Application, 2012–2026
12.13.1. Aluminum
12.13.2. Calcined coke
12.13.3. Cement
12.13.4. Power Stations
12.13.5. Graphite Electrode
12.13.5.1. Regular Power Graphite Electrode
12.13.5.2. Others
12.13.6. Others
12.14. Latin America Market Attractiveness
13. Middle East & Africa Green Petroleum Coke Market Analysis & Forecasts
13.1. Key Findings
13.2. Market Size (Mn Tons) (US$ Mn), by Source, 2012–2026
13.2.1. Anode
13.2.2. Fuel
13.3. Market Size (Mn Tons) (US$ Mn), by Form, 2012-2026
13.3.1. Sponge coke
13.3.2. Purge coke
13.3.3. Needle coke
13.3.4. Shot coke
13.3.5. Honeycomb coke
13.4. Market Size (Mn Tons) (US$ Mn), by Application, 2012–2026
13.4.1. Aluminum
13.4.2. Calcined coke
13.4.3. Cement
13.4.4. Power Stations
13.4.5. Graphite Electrode
13.4.5.1. Regular Power Graphite Electrode
13.4.5.2. Others
13.4.6. Others
13.5. GCC Market Size (Mn Tons) (US$ Mn), by Source, 2012–2026
13.5.1. Anode
13.5.2. Fuel
13.6. GCC Market Size (Mn Tons) (US$ Mn), by Form, 2012-2026
13.6.1. Sponge coke
13.6.2. Purge coke
13.6.3. Needle coke
13.6.4. Shot coke
13.6.5. Honeycomb coke
13.7. GCC Market Size (Mn Tons) (US$ Mn), by Application, 2012–2026
13.7.1. Aluminum
13.7.2. Calcined coke
13.7.3. Cement
13.7.4. Power Stations
13.7.5. Graphite Electrode
13.7.5.1. Regular Power Graphite Electrode
13.7.5.2. Others
13.7.6. Others
13.8. Mexico Market Size (Mn Tons) (US$ Mn), by Source, 2012–2026
13.8.1. Anode
13.8.2. Fuel
13.9. South Africa Market Size (Mn Tons) (US$ Mn), by Form, 2012-2026
13.9.1. Sponge coke
13.9.2. Purge coke
13.9.3. Needle coke
13.9.4. Shot coke
13.9.5. Honeycomb coke
13.10. South Africa Market Size (Mn Tons) (US$ Mn), by Application, 2012–2026
13.10.1. Aluminum
13.10.2. Calcined coke
13.10.3. Cement
13.10.4. Power Stations
13.10.5. Graphite Electrode
13.10.5.1. Regular Power Graphite Electrode
13.10.5.2. Others
13.10.6. Others
13.11. Rest of Middle East & Africa Market Size (Mn Tons) (US$ Mn), by Source, 2012–2026
13.11.1. Anode
13.11.2. Fuel
13.12. Rest of Middle East & Africa Market Size (Mn Tons) (US$ Mn), by Form, 2012-2026
13.12.1. Sponge coke
13.12.2. Purge coke
13.12.3. Needle coke
13.12.4. Shot coke
13.12.5. Honeycomb coke
13.13. Rest of Middle East & Africa Market Size (Mn Tons) (US$ Mn), by Application, 2012–2026
13.13.1. Aluminum
13.13.2. Calcined coke
13.13.3. Cement
13.13.4. Power Stations
13.13.5. Graphite Electrode
13.13.5.1. Regular Power Graphite Electrode
13.13.5.2. Others
13.13.6. Others
13.14. Middle East & Africa Market Attractiveness
14. Competition Landscape
14.1. Competition Matrix
14.2. Green Petroleum Coke Market Share Analysis, by Company (2017)
14.3. Market Footprint Analysis, by Region
14.4. Market Footprint Analysis, by Application
14.5. Competitive Business Strategies
14.5.1. Oxbow Corporation
14.5.1.1. Head Quarters, Year of Establishment, Revenue, Key Management, Number of Employees
14.5.1.1.1. Business Segments
14.5.1.1.2. Application Segments
14.5.1.1.3. Product Segments
14.5.1.1.4. Strategic Overview, Acquisitions
14.5.2. AMINCO RESOURCES LLC.
14.5.2.1. Head Quarters, Year of Establishment, Revenue, Key Management, Number of Employees
14.5.2.1.1. Business Segments
14.5.2.1.2. Application Segments
14.5.2.1.3. Product Segments
14.5.2.1.4. Strategic Overview, Agreement
14.5.3. Asbury Carbons
14.5.3.1. Head Quarters, Year of Establishment, Revenue, Key Management, Number of Employees
14.5.3.1.1. Business Segments
14.5.3.1.2. Application Segments
14.5.3.1.3. Product Segments
14.5.3.1.4. Strategic Overview, New Facility
14.5.4. Aluminium Bahrain (Alba)
14.5.4.1. Head Quarters, Year of Establishment, Revenue, Key Management, Number of Employees
14.5.4.1.1. Business Segments
14.5.4.1.2. Application Segments
14.5.4.1.3. Product Segments
14.5.4.1.4. Revenue (US$ Bn) and Y-o-Y Growth (%), 2012–2017
14.5.4.1.5. Total Net Sales (US$ Mn), by Product Segment, 2017
14.5.4.1.6. Strategic Overview, Awards and Expansion
14.5.5. Atha Group
14.5.5.1. Head Quarters, Year of Establishment, Revenue, Key Management, Number of Employees
14.5.5.1.1. Business Segments
14.5.5.1.2. Application Segments
14.5.5.1.3. Product Segments
14.5.6. Carbograf Industrial S.A. de C.V.
14.5.6.1. Head Quarters, Year of Establishment, Revenue, Key Management, Number of Employees
14.5.6.1.1. Business Segments
14.5.6.1.2. Application Segments
14.5.6.1.3. Product Segments
14.5.7. Rain Carbon Inc.
14.5.7.1. Head Quarters, Year of Establishment, Revenue, Key Management, Number of Employees
14.5.7.2. Business Segments
14.5.7.3. Application Segments
14.5.7.4. Product Segments
14.5.8. Minmat Ferro Alloys Private Limited
14.5.8.1. Head Quarters, Year of Establishment, Revenue, Key Management, Number of Employees
14.5.8.1.1. Business Segments
14.5.8.1.2. Application Segments
14.5.8.1.3. Product Segments
14.5.9. Shandong KeYu Energy Co., Ltd.
14.5.9.1. Head Quarters, Year of Establishment, Revenue, Key Management, Number of Employees
14.5.9.1.1. Business Segments
14.5.9.1.2. Application Segments
14.5.9.1.3. Product Segments
14.5.10. Weifang Lianxing New Material Technology Co., Ltd.
14.5.10.1. Head Quarters, Year of Establishment, Revenue, Key Management, Number of Employees
14.5.10.1.1. Business Segments
14.5.10.1.2. Application Segments
14.5.10.1.3. Product Segments
14.5.11. Linyi Zhenhua Carbon Technology Co., Ltd.
14.5.11.1. Head Quarters, Year of Establishment, Revenue, Key Management, Number of Employees
14.5.11.1.1. Business Segments
14.5.11.1.2. Application Segments
14.5.11.1.3. Product Segments
14.5.12. COCAN (HUBEI) GRAPHITE MILL INC.
14.5.12.1. Head Quarters, Year of Establishment, Revenue, Key Management, Number of Employees
14.5.12.1.1. Business Segments
14.5.12.1.2. Application Segments
14.5.12.1.3. Product Segments
14.5.13. Modern Industrial Investment Holding Group.
14.5.13.1. Head Quarters, Year of Establishment, Revenue, Key Management, Number of Employees
14.5.13.1.1. Business Segments
14.5.13.1.2. Application Segments
14.5.13.1.3. Product Segments
14.5.14. Sinoway Carbon Co., Ltd.
14.5.14.1. Head Quarters, Year of Establishment, Revenue, Key Management, Number of Employees
14.5.14.1.1. Business Segments
14.5.14.1.2. Application Segments
14.5.14.1.3. Product Segments
14.5.14.1.4. Strategic Overview
14.5.15. Ningxia Wanboda Carbons & Graphite Co., Ltd.
14.5.15.1. Head Quarters, Year of Establishment, Revenue, Key Management, Number of Employees
14.5.15.1.1. Business Segments
14.5.15.1.2. Application Segments
List of Tables
Table 1 Global Green Petroleum Coke Market Revenue (US$ Mn) Historical, by Source, 2012–2016
Table 2 Global Green Petroleum Coke Market Volume (Million Tons) Historical, by Source, 2012–2016
Table 3 Global Green Petroleum Coke Market Revenue (US$ Mn) Forecast, by Source, 2017–2026
Table 4 Global Green Petroleum Coke Market Volume (Million Tons) Forecast, by Source, 2017–2026
Table 5 Global Green Petroleum Coke Market Size (US$ Mn) Historical, by Form, 2012–2026
Table 6 Global Green Petroleum Coke Market Volume (Million Tons) Historical, by Form, 2012–2026
Table 7 Global Green Petroleum Coke Market Size (US$ Mn) Forecast, by Form, 2017–2026
Table 8 Global Green Petroleum Coke Market Volume (Million Tons) Forecast, by Form, 2017–2026
Table 9 Global Green Petroleum Coke Market Value (US$ Mn) Historical, by Application, 2012–2016
Table 10 Global Green Petroleum Coke Market Volume (Million Tons) Historical, by Application, 2012–2016
Table 11 Global Green Petroleum Coke Market Value (US$ Mn) Forecast, by Application, 2017–2026
Table 12 Global Green Petroleum Coke Market Volume (Million Tons) Forecast, by Application, 2017–2026
Table 13 Global Green Petroleum Coke Market Size (US$ Mn) Historical, by Region, 2012–2016
Table 14 Global Green Petroleum Coke Market Volume (Million Tons) Historical, by Region, 2012–2016
Table 15 Global Green Petroleum Coke Market Value (US$ Mn) Forecast, by Region, 2017–2026
Table 16 Global Green Petroleum Coke Market Volume (Million Tons) Forecast, by Region, 2017–2026
Table 17 North America Green Petroleum Coke Market Revenue (US$ Mn) (Historical) by Source, 2012–2016
Table 18 North America Green Petroleum Coke Market Volume (Million Tons) (Historical) by Source, 2012–2016
Table 19 North America Green Petroleum Coke Market Revenue (US$ Mn) Forecast, by Source, 2017–2026
Table 20 North America Green Petroleum Coke Market Volume (Million Tons) Forecast, by Source, 2017–2026
Table 21 North America Green Petroleum Coke Market Revenue (US$ Mn) (Historical), by Form, 2012–2016
Table 22 North America Green Petroleum Coke Market Volume (Million Tons) (Historical), by Form, 2012–2016
Table 23 North America Green Petroleum Coke Market Revenue (US$ Mn) Forecast, by Form, 2017–2026
Table 24 North America Green Petroleum Coke Market Volume (Million Tons) Forecast, by Form , 2017–2026
Table 25 North America Green Petroleum Coke Market Revenue (US$ Mn) (Historical), by Application, 2012–2016
Table 26 North America Green Petroleum Coke Market Volume (Million Tons) (Historical), by Application, 2012–2016
Table 27 North America Green Petroleum Coke Market Revenue (US$ Mn) Forecast, by Application, 2017–2026
Table 28 North America Green Petroleum Coke Market Volume (Million Tons) Forecast, by Application, 2017–2026
Table 29 North America Green Petroleum Coke Market Revenue (US$ Mn) (Historical) by Country, 2012–2016
Table 30 North America Green Petroleum Coke Market Volume (Million Tons) (Historical), by Country, 2012–2016
Table 31 North America Green Petroleum Coke Market Revenue (US$ Mn) Forecast,S by Country, 2017–2026
Table 32 North America Green Petroleum Coke Market Volume (Million Tons) Forecast, by Country, 2017–2026
Table 33 U.S. Green Petroleum Coke Market Revenue (US$ Mn) (Historical) by Source, 2012–2016
Table 34 U.S. Green Petroleum Coke Market Volume (Million Tons) (Historical) by Source, 2012–2016
Table 35 U.S. Green Petroleum Coke Market Revenue (US$ Mn) Forecast, by Source, 2017–2026
Table 36 U.S. Green Petroleum Coke Market Volume (Million Tons) Forecast, by Source, 2017–2026
Table 37 U.S. Green Petroleum Coke Market Revenue (US$ Mn) historic, by Form, 2012–2016
Table 38 U.S. Green Petroleum Coke Market Volume (Million Tons) historic, by Form, 2012–2016
Table 39 U.S. Green Petroleum Coke Market Revenue (US$ Mn) Forecast, by Form, 2017–2026
Table 40 U.S. Green Petroleum Coke Market Volume (Million Tons) Forecast, by Form, 2017–2026
Table 41 U.S. Green Petroleum Coke Market Revenue (US$ Mn) historic, by Application, 2012–2016
Table 42 U.S. Green Petroleum Coke Market Volume (Million Tons) historic, by Application, 2012–2016
Table 43 U.S. Green Petroleum Coke Market Revenue (US$ Mn) Forecast, by Application, 2017–2026
Table 44 U.S. Green Petroleum Coke Market Volume (Million Tons) Forecast, by Application, 2017–2026
Table 45 Canada Green Petroleum Coke Market Revenue (US$ Mn) (Historical) by Source, 2012–2016
Table 46 Canada Green Petroleum Coke Market Volume (Million Tons) (Historical) by Source, 2012–2016
Table 47 Canada Green Petroleum Coke Market Revenue (US$ Mn) Forecast, by Source, 2017–2026
Table 48 Canada Green Petroleum Coke Market Volume (Million Tons) Forecast, by Source, 2017–2026
Table 49 Canada Green Petroleum Coke Market Revenue (US$ Mn) historic, by Form, 2012–2016
Table 50 Canada Green Petroleum Coke Market Volume (Million Tons) historic, by Form, 2012–2016
Table 51 Canada Green Petroleum Coke Market Revenue (US$ Mn) Forecast, by Form, 2017–2026
Table 52 Canada Green Petroleum Coke Market Volume (Million Tons) Forecast, by Form, 2017–2026
Table 53 Canada Green Petroleum Coke Market Revenue (US$ Mn) historic, by Application, 2012–2016
Table 54 Canada Green Petroleum Coke Market Volume (Million Tons) historic, by Application, 2012–2016
Table 55 Canada Green Petroleum Coke Market Revenue (US$ Mn) Forecast, by Application, 2017–2026
Table 56 Canada Green Petroleum Coke Market Volume (Million Tons) Forecast, by Application, 2017–2026
Table 57 Europe Green Petroleum Coke Market Revenue (US$ Mn) (Historical) by Source, 2012–2016
Table 58 Europe Green Petroleum Coke Market Volume (Million Tons) (Historical) by Source, 2012–2016
Table 59 Europe Green Petroleum Coke Market Revenue (US$ Mn) Forecast, by Source, 2016–2026
Table 60 Europe Green Petroleum Coke Market Volume (Million Tons) Forecast, by Source, 2016–2026
Table 61 Europe Green Petroleum Coke Market Revenue (US$ Mn) (Historical), by Form, 2012–2016
Table 62 Europe Green Petroleum Coke Market Volume (Million Tons) (Historical), by Form, 2012–2016
Table 63 Europe Green Petroleum Coke Market Revenue (US$ Mn) Forecast, by Form, 2017–2026
Table 64 Europe Green Petroleum Coke Market Volume (Million Tons) Forecast, by Form, 2017–2026
Table 65 Europe Green Petroleum Coke Market Revenue (US$ Mn) (Historical), by Application, 2012–2016
Table 66 Europe Green Petroleum Coke Market Volume (Million Tons) (Historical), by Application, 2012–2016
Table 67 Europe Green Petroleum Coke Market Revenue (US$ Mn) Forecast, by Application, 2017–2026
Table 68 Europe Green Petroleum Coke Market Volume (Million Tons) Forecast, by Application, 2017–2026
Table 69 Europe Green Petroleum Coke Market Revenue (US$ Mn) (Historical), by Country, 2012–2016
Table 70 Europe Green Petroleum Coke Market Volume (Million Tons) (Historical), by Country , 2012–2016
Table 71 Europe Green Petroleum Coke Market Revenue (US$ Mn) Forecast, by Country, 2017–2026
Table 72 Europe Green Petroleum Coke Market Volume (Million Tons) Forecast, by Country, 2017–2026
Table 73 Germany Green Petroleum Coke Market Revenue (US$ Mn) (Historical), by Source, 2012–2016
Table 74 Germany Green Petroleum Coke Market Volume (Million Tons) (Historical), by Source, 2012–2016
Table 75 Germany Green Petroleum Coke Market Revenue (US$ Mn) Forecast, by Source, 2016–2026
Table 76 Germany Green Petroleum Coke Market Volume (Million Tons) Forecast, by Source, 2016–2026
Table 77 Germany Green Petroleum Coke Market Revenue (US$ Mn) (Historical), by Form, 2012–2016
Table 78 Germany Green Petroleum Coke Market Volume (Million Tons) (Historical), by Form, 2012–2016
Table 79 Germany Green Petroleum Coke Market Revenue (US$ Mn) Forecast, by Form, 2017–2026
Table 80 Germany Green Petroleum Coke Market Volume (Million Tons) Forecast, by Form, 2017–2026
Table 81 Germany Green Petroleum Coke Market Revenue (US$ Mn) (Historical), by Application, 2012–2016
Table 82 Germany Green Petroleum Coke Market Volume (Million Tons) (Historical), by Application, 2012–2016
Table 83 Germany Green Petroleum Coke Market Revenue (US$ Mn) Forecast, by Application, 2017–2026
Table 84 Germany Green Petroleum Coke Market Volume (Million Tons) Forecast, by Application, 2017–2026
Table 85 France Green Petroleum Coke Market Revenue (US$ Mn) (Historical), by Source, 2012–2016
Table 86 France Green Petroleum Coke Market Volume (Million Tons) (Historical), by Source, 2012–2016
Table 87 France Green Petroleum Coke Market Revenue (US$ Mn) Forecast, by Source, 2016–2026
Table 88 France Green Petroleum Coke Market Volume (Million Tons) Forecast, by Source, 2016–2026
Table 89 France Green Petroleum Coke Market Revenue (US$ Mn) (Historical), by Form, 2012–2016
Table 90 France Green Petroleum Coke Market Volume (Million Tons) (Historical), by Form, 2012–2016
Table 91 France Green Petroleum Coke Market Revenue (US$ Mn) Forecast, by Form, 2017–2026
Table 92 France Green Petroleum Coke Market Volume (Million Tons) Forecast, by Form, 2017–2026
Table 93 France Green Petroleum Coke Market Revenue (US$ Mn) (Historical), by Application, 2012–2016
Table 94 France Green Petroleum Coke Market Volume (Million Tons) (Historical), by Application, 2012–2016
Table 95 France Green Petroleum Coke Market Revenue (US$ Mn) Forecast, by Application, 2017–2026
Table 96 France Green Petroleum Coke Market Volume (Million Tons) Forecast, by Application, 2017–2026
Table 97 U.K. Green Petroleum Coke Market Revenue (US$ Mn) (Historical), by Source, 2012–2016
Table 98 U.K. Green Petroleum Coke Market Volume (Million Tons) (Historical), by Source, 2012–2016
Table 99 U.K. Green Petroleum Coke Market Revenue (US$ Mn) Forecast, by Source, 2016–2026
Table 100 U.K. Green Petroleum Coke Market Volume (Million Tons) Forecast, by Source, 2016–2026
Table 101 U.K. Green Petroleum Coke Market Revenue (US$ Mn) (Historical), by Form, 2012–2016
Table 102 U.K. Green Petroleum Coke Market Volume (Million Tons) (Historical), by Form, 2012–2016
Table 103 U.K. Green Petroleum Coke Market Revenue (US$ Mn) Forecast, by Form, 2017–2026
Table 104 U.K. Green Petroleum Coke Market Volume (Million Tons) Forecast, by Form, 2017–2026
Table 105 U.K. Green Petroleum Coke Market Revenue (US$ Mn) (Historical), by Application, 2012–2016
Table 106 U.K. Green Petroleum Coke Market Volume (Million Tons) (Historical), by Application, 2012–2016
Table 107 U.K. Green Petroleum Coke Market Revenue (US$ Mn) Forecast, by Application, 2017–2026
Table 108 U.K. Green Petroleum Coke Market Volume (Million Tons) Forecast, by Application, 2017–2026
Table 109 Italy Green Petroleum Coke Market Revenue (US$ Mn) (Historical), by Source, 2012–2016
Table 110 Italy Green Petroleum Coke Market Volume (Million Tons) (Historical), by Source, 2012–2016
Table 111 Italy Green Petroleum Coke Market Revenue (US$ Mn) Forecast, by Source, 2016–2026
Table 112 Italy Green Petroleum Coke Market Volume (Million Tons) Forecast, by Source, 2016–2026
Table 113 Italy Green Petroleum Coke Market Revenue (US$ Mn) (Historical), by Form, 2012–2016
Table 114 Italy Green Petroleum Coke Market Volume (Million Tons) (Historical), by Form, 2012–2016
Table 115 Italy Green Petroleum Coke Market Revenue (US$ Mn) Forecast, by Form, 2017–2026
Table 116 Italy Green Petroleum Coke Market Volume (Million Tons) Forecast, by Form, 2017–2026
Table 117 Italy Green Petroleum Coke Market Revenue (US$ Mn) (Historical), by Application, 2012–2016
Table 118 Italy Green Petroleum Coke Market Volume (Million Tons) (Historical), by Application, 2012–2016
Table 119 Italy Green Petroleum Coke Market Revenue (US$ Mn) Forecast, by Application, 2017–2026
Table 120 Italy Green Petroleum Coke Market Volume (Million Tons) Forecast, by Application, 2017–2026
Table 121 Spain Green Petroleum Coke Market Revenue (US$ Mn) (Historical), by Source, 2012–2016
Table 122 Spain Green Petroleum Coke Market Volume (Million Tons) (Historical), by Source, 2012–2016
Table 123 Spain Green Petroleum Coke Market Revenue (US$ Mn) Forecast, by Source, 2016–2026
Table 124 Spain Green Petroleum Coke Market Volume (Million Tons) Forecast, by Source, 2016–2026
Table 125 Spain Green Petroleum Coke Market Revenue (US$ Mn) (Historical), by Form, 2012–2016
Table 126 Spain Green Petroleum Coke Market Volume (Million Tons) (Historical), by Form, 2012–2016
Table 127 Spain Green Petroleum Coke Market Revenue (US$ Mn) Forecast, by Form, 2017–2026
Table 128 Spain Green Petroleum Coke Market Volume (Million Tons) Forecast, by Form, 2017–2026
Table 129 Spain Green Petroleum Coke Market Revenue (US$ Mn) (Historical), by Application, 2012–2016
Table 130 Spain Green Petroleum Coke Market Volume (Million Tons) (Historical), by Application, 2012–2016
Table 131 Spain Green Petroleum Coke Market Revenue (US$ Mn) Forecast, by Application, 2017–2026
Table 132 Spain Green Petroleum Coke Market Volume (Million Tons) Forecast, by Application, 2017–2026
Table 133 Greece Green Petroleum Coke Market Revenue (US$ Mn) (Historical), by Source, 2012–2016
Table 134 Greece Green Petroleum Coke Market Volume (Million Tons) (Historical), by Source, 2012–2016
Table 135 Greece Green Petroleum Coke Market Revenue (US$ Mn) Forecast, by Source, 2016–2026
Table 136 Greece Green Petroleum Coke Market Volume (Million Tons) Forecast, by Source, 2016–2026
Table 137 Greece Green Petroleum Coke Market Revenue (US$ Mn) (Historical), by Form, 2012–2016
Table 138 Greece Green Petroleum Coke Market Volume (Million Tons) (Historical), by Form, 2012–2016
Table 139 Greece Green Petroleum Coke Market Revenue (US$ Mn) Forecast, by Form, 2017–2026
Table 140 Greece Green Petroleum Coke Market Volume (Million Tons) Forecast, by Form, 2017–2026
Table 141 Greece Green Petroleum Coke Market Revenue (US$ Mn) (Historical), by Application, 2012–2016
Table 142 Greece Green Petroleum Coke Market Volume (Million Tons) (Historical), by Application, 2012–2016
Table 143 Greece Green Petroleum Coke Market Revenue (US$ Mn) Forecast, by Application, 2017–2026
Table 144 Greece Green Petroleum Coke Market Volume (Million Tons) Forecast, by Application, 2017–2026
Table 145 Turkey Green Petroleum Coke Market Revenue (US$ Mn) (Historical), by Source, 2012–2016
Table 146 Turkey Green Petroleum Coke Market Volume (Million Tons) (Historical), by Source, 2012–2016
Table 147 Turkey Green Petroleum Coke Market Revenue (US$ Mn) Forecast, by Source, 2016–2026
Table 148 Turkey Green Petroleum Coke Market Volume (Million Tons) Forecast, by Source, 2016–2026
Table 149 Turkey Green Petroleum Coke Market Revenue (US$ Mn) (Historical), by Form, 2012–2016
Table 150 Turkey Green Petroleum Coke Market Volume (Million Tons) (Historical), by Form, 2012–2016
Table 151 Turkey Green Petroleum Coke Market Revenue (US$ Mn) Forecast, by Form, 2017–2026
Table 152 Turkey Green Petroleum Coke Market Volume (Million Tons) Forecast, by Form, 2017–2026
Table 153 Turkey Green Petroleum Coke Market Revenue (US$ Mn) (Historical), by Application, 2012–2016
Table 154 Turkey Green Petroleum Coke Market Volume (Million Tons) (Historical), by Application, 2012–2016
Table 155 Turkey Green Petroleum Coke Market Revenue (US$ Mn) Forecast, by Application, 2017–2026
Table 156 Turkey Green Petroleum Coke Market Volume (Million Tons) Forecast, by Application, 2017–2026
Table 157 Russia & CIS Green Petroleum Coke Market Revenue (US$ Mn) (Historical), by Source, 2012–2016
Table 158 Russia & CIS Green Petroleum Coke Market Volume (Million Tons) (Historical), by Source, 2012–2016
Table 159 Russia & CIS Green Petroleum Coke Market Revenue (US$ Mn) Forecast, by Source, 2016–2026
Table 160 Russia & CIS Green Petroleum Coke Market Volume (Million Tons) Forecast, by Source, 2016–2026
Table 161 Russia & CIS Green Petroleum Coke Market Revenue (US$ Mn) (Historical), by Form, 2012–2016
Table 162 Russia & CIS Green Petroleum Coke Market Volume (Million Tons) (Historical), by Form, 2012–2016
Table 163 Russia & CIS Green Petroleum Coke Market Revenue (US$ Mn) Forecast, by Form, 2017–2026
Table 164 Russia & CIS Green Petroleum Coke Market Volume (Million Tons) Forecast, by Form, 2017–2026
Table 165 Russia & CIS Green Petroleum Coke Market Revenue (US$ Mn) (Historical), by Application, 2012–2016
Table 166 Russia & CIS Green Petroleum Coke Market Volume (Million Tons) (Historical), by Application, 2012–2016
Table 167 Russia & CIS Green Petroleum Coke Market Revenue (US$ Mn) Forecast, by Application, 2017–2026
Table 168 Russia & CIS Green Petroleum Coke Market Volume (Million Tons) Forecast, by Application, 2017–2026
Table 169 Rest of Europe Green Petroleum Coke Market Revenue (US$ Mn) (Historical), by Source, 2012–2016
Table 170 Rest of Europe Green Petroleum Coke Market Volume (Million Tons) (Historical), by Source, 2012–2016
Table 171 Rest of Europe Green Petroleum Coke Market Revenue (US$ Mn) Forecast, by Source, 2016–2026
Table 172 Rest of Europe Green Petroleum Coke Market Volume (Million Tons) Forecast, by Source, 2016–2026
Table 173 Rest of Europe Green Petroleum Coke Market Revenue (US$ Mn) (Historical), by Form, 2012–2016
Table 174 Rest of Europe Green Petroleum Coke Market Volume (Million Tons) (Historical), by Form, 2012–2016
Table 175 Rest of Europe Green Petroleum Coke Market Revenue (US$ Mn) Forecast, by Form, 2017–2026
Table 176 Rest of Europe Green Petroleum Coke Market Volume (Million Tons) Forecast, by Form, 2017–2026
Table 177 Rest of Europe Green Petroleum Coke Market Revenue (US$ Mn) (Historical), by Application, 2012–2016
Table 178 Rest of Europe Green Petroleum Coke Market Volume (Million Tons) (Historical), by Application, 2012–2016
Table 179 Rest of Europe Green Petroleum Coke Market Revenue (US$ Mn) Forecast, by Application, 2017–2026
Table 180 Rest of Europe Green Petroleum Coke Market Volume (Million Tons) Forecast, by Application, 2017–2026
Table 181 Asia Pacific Green Petroleum Coke Market Revenue (US$ Mn) Historical, by Source, 2012–2016
Table 182 Asia Pacific Green Petroleum Coke Market Volume (Million Tons) (Historical), by Source, 2012–2016
Table 183 Asia Pacific Green Petroleum Coke Market Revenue (US$ Mn) Forecast, by Source, 2017–2026
Table 184 Asia Pacific Green Petroleum Coke Market Volume (Million Tons) Forecast, by Source, 2017–2026
Table 185 Asia Pacific Green Petroleum Coke Market Revenue (US$ Mn) Historical, by Form, 2012–2016
Table 186 Asia Pacific Green Petroleum Coke Market Volume (Million Tons) Historical, by Form, 2012–2016
Table 187 Asia Pacific Green Petroleum Coke Market Revenue (US$ Mn) Forecast, by Form, 2017–2026
Table 188 Asia Pacific Green Petroleum Coke Market Volume (Million Tons) Forecast, by Form, 2017–2026
Table 189 Asia Pacific Green Petroleum Coke Market Revenue (US$ Mn) Historical, by Application, 2012–2016
Table 190 Asia Pacific Green Petroleum Coke Market Volume (Million Tons) Historical, by Application, 2012–2016
Table 191 Asia Pacific Green Petroleum Coke Market Revenue (US$ Mn) Forecast, by Application, 2017–2026
Table 192 Asia Pacific Green Petroleum Coke Market Volume (Million Tons) Forecast, by Application, 2017–2026
Table 193 Asia Pacific Green Petroleum Coke Market Revenue (US$ Mn) Historical, by Country/Sub-region, 2012–2016
Table 194 Asia Pacific Green Petroleum Coke Market Volume (Million Tons) Historical, by Country/Sub-region, 2012–2016
Table 195 Asia Pacific Green Petroleum Coke Market Revenue (US$ Mn) Forecast, by Country/Sub-region, 2017–2026
Table 196 Asia Pacific Green Petroleum Coke Market Volume (Million Tons) Forecast, by Country/Sub-region, 2017–2026
Table 197 China Green Petroleum Coke Market Revenue (US$ Mn) Historical, by Source, 2012–2016
Table 198 China Green Petroleum Coke Market Volume (Million Tons) (Historical), by Source, 2012–2016
Table 199 China Green Petroleum Coke Market Revenue (US$ Mn) Forecast, by Source, 2017–2026
Table 200 China Green Petroleum Coke Market Volume (Million Tons) Forecast, by Source, 2017–2026
Table 201 China Green Petroleum Coke Market Revenue (US$ Mn) Historical, by Form, 2012–2016
Table 202 China Green Petroleum Coke Market Volume (Million Tons) Historical, by Form, 2012–2016
Table 203 China Green Petroleum Coke Market Revenue (US$ Mn) Forecast, by Form, 2017–2026
Table 204 China Green Petroleum Coke Market Volume (Million Tons) Forecast, by Form, 2017–2026
Table 205 China Green Petroleum Coke Market Revenue (US$ Mn) Historical, by Application, 2012–2016
Table 206 China Green Petroleum Coke Market Volume (Million Tons) Historical, by Application, 2012–2016
Table 207 China Green Petroleum Coke Market Revenue (US$ Mn) Forecast, by Application, 2017–2026
Table 208 China Green Petroleum Coke Market Volume (Million Tons) Forecast, by Application, 2017–2026
Table 209 India Green Petroleum Coke Market Revenue (US$ Mn) Historical, by Source, 2012–2016
Table 210 India Green Petroleum Coke Market Volume (Million Tons) (Historical), by Source, 2012–2016
Table 211 India Green Petroleum Coke Market Revenue (US$ Mn) Forecast, by Source, 2017–2026
Table 212 India Green Petroleum Coke Market Volume (Million Tons) Forecast, by Source, 2017–2026
Table 213 India Green Petroleum Coke Market Revenue (US$ Mn) Historical, by Form, 2012–2016
Table 214 India Green Petroleum Coke Market Volume (Million Tons) Historical, by Form, 2012–2016
Table 215 India Green Petroleum Coke Market Revenue (US$ Mn) Forecast, by Form, 2017–2026
Table 216 India Green Petroleum Coke Market Volume (Million Tons) Forecast, by Form, 2017–2026
Table 217 India Green Petroleum Coke Market Revenue (US$ Mn) Historical, by Application, 2012–2016
Table 218 India Green Petroleum Coke Market Volume (Million Tons) Historical, by Application, 2012–2016
Table 219 India Green Petroleum Coke Market Revenue (US$ Mn) Forecast, by Application, 2017–2026
Table 220 India Green Petroleum Coke Market Volume (Million Tons) Forecast, by Application, 2017–2026
Table 221 Japan Green Petroleum Coke Market Revenue (US$ Mn) Historical, by Source, 2012–2016
Table 222 Japan Green Petroleum Coke Market Volume (Million Tons) (Historical), by Source, 2012–2016
Table 223 Japan Green Petroleum Coke Market Revenue (US$ Mn) Forecast, by Source, 2017–2026
Table 224 Japan Green Petroleum Coke Market Volume (Million Tons) Forecast, by Source, 2017–2026
Table 225 Japan Green Petroleum Coke Market Revenue (US$ Mn) Historical, by Form, 2012–2016
Table 226 Japan Green Petroleum Coke Market Volume (Million Tons) Historical, by Form, 2012–2016
Table 227 India Green Petroleum Coke Market Revenue (US$ Mn) Forecast, by Form, 2017–2026
Table 228 Japan Green Petroleum Coke Market Volume (Million Tons) Forecast, by Form, 2017–2026
Table 229 Japan Green Petroleum Coke Market Revenue (US$ Mn) Historical, by Application, 2012–2016
Table 230 Japan Green Petroleum Coke Market Volume (Million Tons) Historical, by Application, 2012–2016
Table 231 Japan Green Petroleum Coke Market Revenue (US$ Mn) Forecast, by Application, 2017–2026
Table 232 Japan Green Petroleum Coke Market Volume (Million Tons) Forecast, by Application, 2017–2026
Table 233 ASEAN Green Petroleum Coke Market Revenue (US$ Mn) Historical, by Source, 2012–2016
Table 234 ASEAN Green Petroleum Coke Market Volume (Million Tons) (Historical), by Source, 2012–2016
Table 235 ASEAN Green Petroleum Coke Market Revenue (US$ Mn) Forecast, by Source, 2017–2026
Table 236 ASEAN Green Petroleum Coke Market Volume (Million Tons) Forecast, by Source, 2017–2026
Table 237 ASEAN Green Petroleum Coke Market Revenue (US$ Mn) Historical, by Form, 2012–2016
Table 238 ASEAN Green Petroleum Coke Market Volume (Million Tons) Historical, by Form, 2012–2016
Table 239 ASEAN Green Petroleum Coke Market Revenue (US$ Mn) Forecast, by Form, 2017–2026
Table 240 ASEAN Green Petroleum Coke Market Volume (Million Tons) Forecast, by Form, 2017–2026
Table 241 ASEAN Green Petroleum Coke Market Revenue (US$ Mn) Historical, by Application, 2012–2016
Table 242 ASEAN Green Petroleum Coke Market Volume (Million Tons) Historical, by Application, 2012–2016
Table 243 ASEAN Green Petroleum Coke Market Revenue (US$ Mn) Forecast, by Application, 2017–2026
Table 244 ASEAN Green Petroleum Coke Market Volume (Million Tons) Forecast, by Application, 2017–2026
Table 245 Australia Green Petroleum Coke Market Revenue (US$ Mn) Historical, by Source, 2012–2016
Table 246 Australia Green Petroleum Coke Market Volume (Million Tons) (Historical), by Source, 2012–2016
Table 247 Australia Green Petroleum Coke Market Revenue (US$ Mn) Forecast, by Source, 2017–2026
Table 248 Australia Green Petroleum Coke Market Volume (Million Tons) Forecast, by Source, 2017–2026
Table 249 Australia Green Petroleum Coke Market Revenue (US$ Mn) Historical, by Form, 2012–2016
Table 250 Australia Green Petroleum Coke Market Volume (Million Tons) Historical, by Form, 2012–2016
Table 251 Australia Green Petroleum Coke Market Revenue (US$ Mn) Forecast, by Form, 2017–2026
Table 252 Australia Green Petroleum Coke Market Volume (Million Tons) Forecast, by Form, 2017–2026
Table 253 Australia Green Petroleum Coke Market Revenue (US$ Mn) Historical, by Application, 2012–2016
Table 254 Australia Green Petroleum Coke Market Volume (Million Tons) Historical, by Application, 2012–2016
Table 255 Australia Green Petroleum Coke Market Revenue (US$ Mn) Forecast, by Application, 2017–2026
Table 256 Australia Green Petroleum Coke Market Volume (Million Tons) Forecast, by Application, 2017–2026
Table 257 Rest of APAC Green Petroleum Coke Market Revenue (US$ Mn) Historical, by Source, 2012–2016
Table 258 Rest of APAC Green Petroleum Coke Market Volume (Million Tons) (Historical), by Source, 2012–2016
Table 259 Rest of APAC Green Petroleum Coke Market Revenue (US$ Mn) Forecast, by Source, 2017–2026
Table 260 Rest of APAC Green Petroleum Coke Market Volume (Million Tons) Forecast, by Source, 2017–2026
Table 261 Rest of APAC Green Petroleum Coke Market Revenue (US$ Mn) Historical, by Form, 2012–2016
Table 262 Rest of APAC Green Petroleum Coke Market Volume (Million Tons) Historical, by Form, 2012–2016
Table 263 Rest of APAC Green Petroleum Coke Market Revenue (US$ Mn) Forecast, by Form, 2017–2026
Table 264 Rest of APAC Green Petroleum Coke Market Volume (Million Tons) Forecast, by Form, 2017–2026
Table 265 Rest of APAC Green Petroleum Coke Market Revenue (US$ Mn) Historical, by Application, 2012–2016
Table 266 Rest of APAC Green Petroleum Coke Market Volume (US$ Mn) Historical, by Application, 2012–2016
Table 267 Rest of APAC Green Petroleum Coke Market Revenue (US$ Mn) Forecast, by Application, 2017–2026
Table 268 Rest of APAC Green Petroleum Coke Market Volume (Million Tons) Forecast, by Application, 2017–2026
Table 269 Latin America Green Petroleum Coke Market Revenue (US$ Mn) (Historical), by Source, 2012–2016
Table 270 Latin America Green Petroleum Coke Market Volume (Million Tons) (Historical), by Source, 2012–2016
Table 271 Latin America Green Petroleum Coke Market Revenue (US$ Mn) Forecast, by Source, 2016–2026
Table 272 Latin America Green Petroleum Coke Market Volume (Million Tons) Forecast, by Source, 2016–2026
Table 273 Latin America Green Petroleum Coke Market Revenue (US$ Mn) Historical, by Form, 2012–2016
Table 274 Latin America Green Petroleum Coke Market Revenue (Million Tons) Historical, by Form, 2012–2016
Table 275 Latin America Green Petroleum Coke Market Revenue (US$ Mn) Forecast, by Form, 2017–2026
Table 276 Latin America Green Petroleum Coke Market Volume (Million Tons) Forecast, by Form, 2017–2026
Table 277 Latin America Green Petroleum Coke Market Revenue (US$ Mn) Historical, by Application, 2012–2016
Table 278 Latin America Green Petroleum Coke Market Revenue (Million Tons) Historical, by Application, 2012–2016
Table 279 Latin America Green Petroleum Coke Market Revenue (US$ Mn) Forecast, by Application, 2017–2026
Table 280 Latin America Green Petroleum Coke Market Volume (Million Tons) Forecast, by Application, 2017–2026
Table 281 Latin America Green Petroleum Coke Market Revenue (US$ Mn) (Historical), by Country/Sub-region, 2012–2016
Table 282 Latin America Green Petroleum Coke Market Volume (Million Tons) (Historical), by Country , 2012–2016
Table 283 Latin America Green Petroleum Coke Market Revenue (US$ Mn) Forecast, by Country/Sub-region, 2017–2026
Table 284 Latin America Green Petroleum Coke Market Volume (Million Tons) Forecast, by Country/Sub-region, 2017–2026
Table 285 Brazil Green Petroleum Coke Market Revenue (US$ Mn) (Historical), by Source, 2012–2016
Table 286 Brazil Green Petroleum Coke Market Volume (Million Tons) (Historical), by Source, 2012–2016
Table 287 Brazil Green Petroleum Coke Market Revenue (US$ Mn) Forecast, by Source, 2016–2026
Table 288 Brazil Green Petroleum Coke Market Volume (Million Tons) Forecast, by Source, 2016–2026
Table 289 Brazil Green Petroleum Coke Market Revenue (US$ Mn) Historical, by Form, 2012–2016
Table 290 Brazil Green Petroleum Coke Market Revenue (Million Tons) Historical, by Form, 2012–2016
Table 291 Brazil Green Petroleum Coke Market Revenue (US$ Mn) Forecast, by Form, 2017–2026
Table 292 Brazil Green Petroleum Coke Market Volume (Million Tons) Forecast, by Form, 2017–2026
Table 293 Brazil Green Petroleum Coke Market Revenue (US$ Mn) Historical, by Application, 2012–2016
Table 294 Brazil Green Petroleum Coke Market Revenue (Million Tons) Historical, by Application, 2012–2016
Table 295 Brazil Green Petroleum Coke Market Revenue (US$ Mn) Forecast, by Application, 2017–2026
Table 296 Brazil Green Petroleum Coke Market Volume (Million Tons) Forecast, by Application, 2017–2026
Table 297 Mexico Green Petroleum Coke Market Revenue (US$ Mn) (Historical), by Source, 2012–2016
Table 298 Mexico Green Petroleum Coke Market Volume (Million Tons) (Historical), by Source, 2012–2016
Table 299 Mexico Green Petroleum Coke Market Revenue (US$ Mn) Forecast, by Source, 2016–2026
Table 300 Mexico Green Petroleum Coke Market Volume (Million Tons) Forecast, by Source, 2016–2026
Table 301 Mexico Green Petroleum Coke Market Revenue (US$ Mn) Historical, by Form, 2012–2016
Table 302 Mexico Green Petroleum Coke Market Revenue (Million Tons) Historical, by Form, 2012–2016
Table 303 Mexico Green Petroleum Coke Market Revenue (US$ Mn) Forecast, by Form, 2017–2026
Table 304 Mexico Green Petroleum Coke Market Volume (Million Tons) Forecast, by Form, 2017–2026
Table 305 Mexico Green Petroleum Coke Market Revenue (US$ Mn) Historical, by Application, 2012–2016
Table 306 Mexico Green Petroleum Coke Market Revenue (Million Tons) Historical, by Application, 2012–2016
Table 307 Mexico Green Petroleum Coke Market Revenue (US$ Mn) Forecast, by Application, 2017–2026
Table 308 Mexico Green Petroleum Coke Market Volume (Million Tons) Forecast, by Application, 2017–2026
Table 309 Rest of Latin America Green Petroleum Coke Market Revenue (US$ Mn) (Historical), by Source, 2012–2016
Table 310 Rest of Latin America Green Petroleum Coke Market Volume (Million Tons) (Historical), by Source, 2012–2016
Table 311 Rest of Latin America Green Petroleum Coke Market Revenue (US$ Mn) Forecast, by Source, 2016–2026
Table 312 Rest of Latin America Green Petroleum Coke Market Volume (Million Tons) Forecast, by Source, 2016–2026
Table 313 Rest of Latin America Green Petroleum Coke Market Revenue (US$ Mn) Historical, by Form, 2012–2016
Table 314 Rest of Latin America Green Petroleum Coke Market Revenue (Million Tons) Historical, by Form, 2012–2016
Table 315 Rest of Latin America Green Petroleum Coke Market Revenue (US$ Mn) Forecast, by Form, 2017–2026
Table 316 Rest of Latin America Green Petroleum Coke Market Volume (Million Tons) Forecast, by Form, 2017–2026
Table 317 Rest of Latin America Green Petroleum Coke Market Revenue (US$ Mn) Historical, by Application, 2012–2016
Table 318 Rest of Latin America Green Petroleum Coke Market Revenue (Million Tons) Historical, by Application, 2012–2016
Table 319 Rest of Latin America Green Petroleum Coke Market Revenue (US$ Mn) Forecast, by Application, 2017–2026
Table 320 Rest of Latin America Green Petroleum Coke Market Volume (Million Tons) Forecast, by Application, 2017–2026
Table 321 Middle East & Africa Green Petroleum Coke Market Revenue (US$ Mn) (Historical), by Source, 2012–2016
Table 322 Middle East & Africa Green Petroleum Coke Market Volume (Million Tons) (Historical), by Source, 2012–2016
Table 323 Middle East & Africa Green Petroleum Coke Market Revenue (US$ Mn) Forecast, by Source, 2016–2026
Table 324 Middle East & Africa Green Petroleum Coke Market Volume (Million Tons) Forecast, by Source, 2016–2026
Table 325 Middle East & Africa Green Petroleum Coke Market Revenue (US$ Mn) Historical, by Form, 2012–2016
Table 326 Middle East & Africa Green Petroleum Coke Market Revenue (Million Tons) Historical, by Form, 2012–2016
Table 327 Middle East & Africa Green Petroleum Coke Market Revenue (US$ Mn) Forecast, by Form, 2017–2026
Table 328 Middle East & Africa Green Petroleum Coke Market Volume (Million Tons) Forecast, by Form, 2017–2026
Table 329 Middle East & Africa Green Petroleum Coke Market Revenue (US$ Mn) Historical, by Application, 2012–2016
Table 330 Middle East & Africa Green Petroleum Coke Market Revenue (Million Tons) Historical, by Application, 2012–2016
Table 331 Middle East & Africa Green Petroleum Coke Market Revenue (US$ Mn) Forecast, by Application, 2017–2026
Table 332 Middle East & Africa Green Petroleum Coke Market Volume (Million Tons) Forecast, by Application, 2017–2026
Table 333 Middle East & Africa Green Petroleum Coke Market Revenue (US$ Mn) (Historical), by Country/Sub-region, 2012–2016
Table 334 Middle East & Africa Green Petroleum Coke Market Volume (Million Tons) (Historical), by Country , 2012–2016
Table 335 Middle East & Africa Green Petroleum Coke Market Revenue (US$ Mn) Forecast, by Country, 2017–2026
Table 336 Middle East & Africa Green Petroleum Coke Market Volume (Million Tons) Forecast, by Country, 2017–2026
Table 337 GCC Green Petroleum Coke Market Revenue (US$ Mn) (Historical), by Source, 2012–2016
Table 338 GCC Green Petroleum Coke Market Volume (Million Tons) (Historical), by Source, 2012–2016
Table 339 GCC Green Petroleum Coke Market Revenue (US$ Mn) Forecast, by Source, 2016–2026
Table 340 GCC Green Petroleum Coke Market Volume (Million Tons) Forecast, by Source, 2016–2026
Table 341 GCC Green Petroleum Coke Market Revenue (US$ Mn) Historical, by Form, 2012–2016
Table 342 GCC Green Petroleum Coke Market Revenue (Million Tons) Historical, by Form, 2012–2016
Table 343 GCC Green Petroleum Coke Market Revenue (US$ Mn) Forecast, by Form, 2017–2026
Table 344 GCC Green Petroleum Coke Market Volume (Million Tons) Forecast, by Form, 2017–2026
Table 345 GCC Green Petroleum Coke Market Revenue (US$ Mn) Historical, by Application, 2012–2016
Table 346 GCC Green Petroleum Coke Market Revenue (Million Tons) Historical, by Application, 2012–2016
Table 347 GCC Green Petroleum Coke Market Revenue (US$ Mn) Forecast, by Application, 2017–2026
Table 348 GCC Green Petroleum Coke Market Volume (Million Tons) Forecast, by Application, 2017–2026
Table 349 South Africa Green Petroleum Coke Market Revenue (US$ Mn) (Historical), by Source, 2012–2016
Table 350 South Africa Green Petroleum Coke Market Volume (Million Tons) (Historical), by Source, 2012–2016
Table 351 South Africa Green Petroleum Coke Market Revenue (US$ Mn) Forecast, by Source, 2016–2026
Table 352 South Africa Green Petroleum Coke Market Volume (Million Tons) Forecast, by Source, 2016–2026
Table 353 South Africa Green Petroleum Coke Market Revenue (US$ Mn) Historical, by Form, 2012–2016
Table 354 South Africa Green Petroleum Coke Market Revenue (Million Tons) Historical, by Form, 2012–2016
Table 355 South Africa Green Petroleum Coke Market Revenue (US$ Mn) Forecast, by Form, 2017–2026
Table 356 South Africa Green Petroleum Coke Market Volume (Million Tons) Forecast, by Form, 2017–2026
Table 357 South Africa Green Petroleum Coke Market Revenue (US$ Mn) Historical, by Application, 2012–2016
Table 358 South Africa Green Petroleum Coke Market Revenue (Million Tons) Historical, by Application, 2012–2016
Table 359 South Africa Green Petroleum Coke Market Revenue (US$ Mn) Forecast, by Application, 2017–2026
Table 360 South Africa Green Petroleum Coke Market Volume (Million Tons) Forecast, by Application, 2017–2026
Table 361 Rest of Middle East & Africa Green Petroleum Coke Market Revenue (US$ Mn) (Historical), by Source, 2012–2016
Table 362 Rest of Middle East & Africa Green Petroleum Coke Market Volume (Million Tons) (Historical), by Source, 2012–2016
Table 363 Rest of Middle East & Africa Green Petroleum Coke Market Revenue (US$ Mn) Forecast, by Source, 2016–2026
Table 364 Rest of Middle East & Africa Green Petroleum Coke Market Volume (Million Tons) Forecast, by Source, 2016–2026
Table 365 Rest of Middle East & Africa Green Petroleum Coke Market Revenue (US$ Mn) Historical, by Form, 2012–2016
Table 366 Rest of Middle East & Africa Green Petroleum Coke Market Revenue (Million Tons) Historical, by Form, 2012–2016
Table 367 Rest of Middle East & Africa Green Petroleum Coke Market Revenue (US$ Mn) Forecast, by Form, 2017–2026
Table 368 Rest of Middle East & Africa Green Petroleum Coke Market Volume (Million Tons) Forecast, by Form, 2017–2026
Table 369 Rest of Middle East & Africa Green Petroleum Coke Market Revenue (US$ Mn) Historical, by Application, 2012–2016
Table 370 Rest of Middle East & Africa Green Petroleum Coke Market Revenue (Million Tons) Historical, by Application, 2012–2016
Table 371 Rest of Middle East & Africa Green Petroleum Coke Market Revenue (US$ Mn) Forecast, by Application, 2017–2026
Table 372 Rest of Middle East & Africa Green Petroleum Coke Market Volume (Million Tons) Forecast, by Application, 2017–2026
List of Figures
Figure 1 Market Share, by Application, 2017
Figure 2 Top 3 trends
Figure 3 Market size, by region
Figure 4 Executive Summary
Figure 5 Global Green Petroleum Coke Market Size (US$ Mn) and Volume (Million Tons) Forecast, 2017–2026
Figure 6 Global Green Petroleum Coke Market Volume Share, by Source, 2017 and 2026
Figure 7 Global Green Petroleum Coke Market Revenue (US$ Mn) and Volume (Million Tons), by Anode/Pitch, 2017–2026
Figure 8 Global Green Petroleum Coke Market Revenue (US$ Mn) and Volume (Million Tons), by Fuel/Crude, 2017–2026
Figure 9 Global Green Petroleum Coke Market Volume Share, by Form, 2017 and 2026
Figure 10 Global Green Petroleum Coke Market Revenue (US$ Mn) and Volume (Million Tons), by Sponge Coke, 2017–2026
Figure 11 Global Green Petroleum Coke Market Revenue (US$ Mn) and Volume (Million Tons), by Purge Coke, 2017–2026
Figure 12 Global Green Petroleum Coke Market Revenue (US$ Mn) and Volume (Million Tons), by Needle Coke, 2017–2026
Figure 13 Global Green Petroleum Coke Market Revenue (US$ Mn) and Volume (Million Tons), by Shot Coke, 2017–2026
Figure 14 Global Green Petroleum Coke Market Revenue (US$ Mn) and Volume (Million Tons), by Honeycomb Coke, 2017–2026
Figure 15 Global Green Petroleum Coke Market Volume Share, by Application, 2017 and 2026
Figure 16 Global Green Petroleum Coke Market Volume Share, by Graphite Electrode, 2017 and 2026
Figure 17 Global Green Petroleum Coke Market Revenue (US$ Mn) and Volume (Million Tons), by Aluminum, 2017–2026
Figure 18 Global Green Petroleum Coke Market Revenue (US$ Mn) and Volume (Million Tons), by Calcined Coke, 2017–2026
Figure 19 Global Green Petroleum Coke Market Revenue (US$ Mn) and Volume (Million Tons), by Cement, 2017–2026
Figure 20 Global Green Petroleum Coke Market Revenue (US$ Mn) and Volume (Million Tons), by Power Station, 2017–2026
Figure 21 Global Green Petroleum Coke Market Revenue (US$ Mn) and Volume (Million Tons), by Graphite Electrode, 2017- 2026
Figure 22 Global Green Petroleum Coke Market Revenue (US$ Mn) and Volume (Million Tons), by Regular Power Graphite, 2017-2026
Figure 23 Global Green Petroleum Coke Market Revenue (US$ Mn) and Volume (Million Tons), by Others, 2017-2026
Figure 24 Global Green Petroleum Coke Market Revenue (US$ Mn) and Volume (Million Tons), by Others, 2017-2026
Figure 25 Global Green Petroleum Coke Market Attractiveness, by Source
Figure 26 Global Green Petroleum Coke Market Attractiveness, by Application
Figure 27 Global Green Petroleum Coke Market Attractiveness, by Form
Figure 28 Global Green Petroleum Coke Market Volume Share, by Region, 2017–2026
Figure 29 Global Green Petroleum Coke Market Attractiveness, by Region
Figure 30 North America Green Petroleum Coke Market Size (US$ Mn) and Volume (Million Tons) Forecast, 2018–2026
Figure 31 North America Market Attractiveness Analysis, by Country
Figure 32 North America Market Volume Share Analysis, by Source, 2017 and 2026
Figure 33 North America Market Volume Share Analysis, by Form, 2017 and 2026
Figure 34 North America Market Volume Share Analysis, by Application, 2017 and 2026
Figure 35 North America Market Volume Share Analysis, by Graphite Electrode Application, 2017 and 2026
Figure 36 North America Market Volume Share Analysis, by Country, 2017 and 2026
Figure 37 North America Green Petroleum Coke Market Attractiveness Analysis, by Source
Figure 38 North America Green Petroleum Coke Market Attractiveness Analysis, by Form
Figure 39 North America Green Petroleum Coke Market Attractiveness Analysis, by Application
Figure 40 Europe Green Petroleum Coke Market Size (US$ Mn) and Volume (Million Tons) Forecast, 2018–2026
Figure 41 Europe Market Attractiveness Analysis, by Country
Figure 42 Europe Market Volume Share Analysis, by Source, 2017 and 2026
Figure 43 Europe Market Volume Share Analysis, by Form, 2017 and 2026
Figure 44 Europe Market Volume Share Analysis, by Application, 2017 and 2026
Figure 45 Europe Market Volume Share Analysis, by Graphite Electrode Application, 2017 and 2026
Figure 46 Europe Market Volume Share Analysis, by Country/Sub-region, 2017 and 2026
Figure 47 Europe Green Petroleum Coke Market Attractiveness Analysis, by Source
Figure 48 Europe Green Petroleum Coke Market Attractiveness Analysis, by Form
Figure 49 Europe Green Petroleum Coke Market Attractiveness Analysis, by Application
Figure 50 Asia Pacific Green Petroleum Coke Market Size (US$ Mn) and Volume (Million Tons) Forecast, 2018–2026
Figure 51 Asia Pacific Market Attractiveness Analysis, by Country
Figure 52 Asia Pacific Market Volume Share Analysis, by Source, 2017 and 2026
Figure 53 Asia Pacific Market Volume Share Analysis, by Form, 2017 and 2026
Figure 54 Asia Pacific Market Volume Share Analysis, by Application, 2017 and 2026
Figure 55 Asia Pacific Market Volume Share Analysis, by Application, 2017 and 2026
Figure 56 Asia Pacific Market Volume Share Analysis, by Country/Sub-region, 2017 and 2026
Figure 57 Asia Pacific Green Petroleum Coke Market Attractiveness Analysis, by Source
Figure 58 Asia Pacific Green Petroleum Coke Market Attractiveness Analysis, by Form
Figure 59 Asia Pacific Green Petroleum Coke Market Attractiveness Analysis, by Application
Figure 60 Latin America Green Petroleum Coke Market Size (US$ Mn) and Volume (Million Tons) Forecast, 2018–2026
Figure 61 Latin America Market Attractiveness Analysis, by Country
Figure 62 Latin America Market Volume Share Analysis, by Source, 2017 and 2026
Figure 63 Latin America Market Volume Share Analysis, by Form, 2017 and 2026
Figure 64 Latin America Market Volume Share Analysis, by Application, 2017 and 2026
Figure 65 Latin America Market Volume Share Analysis, by Application, 2017 and 2026
Figure 66 Latin America Market Volume Share Analysis, by Country/Sub-region, 2017 and 2026
Figure 67 Latin America Green Petroleum Coke Market Attractiveness Analysis, by Source
Figure 68 Latin America Green Petroleum Coke Market Attractiveness Analysis, by Form
Figure 69 Latin America Green Petroleum Coke Market Attractiveness Analysis, by Application
Figure 70 Middle East & Africa Green Petroleum Coke Market Size (US$ Mn) and Volume (Million Tons) Forecast, 2018-2026
Figure 71 Middle East & Africa Market Attractiveness Analysis, by Country
Figure 72 Middle East & Africa Market Volume Share Analysis, by Source, 2017 and 2026
Figure 73 Middle East & Africa Market Volume Share Analysis, by Form, 2017 and 2026
Figure 74 Middle East & Africa Market Volume Share Analysis, by Application, 2017 and 2026
Figure 75 Middle East & Africa Market Volume Share Analysis, by Graphite Electrode Application, 2017 and 2026
Figure 76 Middle East & Africa Market Volume Share Analysis, by Country/Sub-region, 2017 and 2026
Figure 77 Middle East & Africa Green Petroleum Coke Market Attractiveness Analysis, by Source
Figure 78 Middle East & Africa Green Petroleum Coke Market Attractiveness Analysis, by Form
Figure 79 Middle East & Africa Green Petroleum Coke Market Attractiveness Analysis, by Application
Figure 80 Global Green Petroleum Coke Market Share Analysis, by Company (2017)
Figure 81 Market Footprint Analysis, by Region
Copyright © Transparency Market Research, Inc. All Rights reserved
Trust Online

Green Petroleum Coke Market
