Rising number of restaurants are searching for new ways to make their business effective and efficient. Various solutions are being explored to identify newer areas of revenue generation and optimize resource use including customer relationship management, supply chain management and others. Hence many quick service restaurants (QSR) are increasing their reliance on technology to find best of the solutions. Today, QSR are innovating and adopting digital devices such as handheld devices, digital menu cards, signage systems, point of sales and kiosks. QSR IT is going through a transition due to proliferation of mobile devices, rapidly changing consumer behavior and transformation of hardware systems to cloud. Digital solutions are gaining momentum in a QSR ecosystem as they offer enhanced productivity, efficient customer check out, greater table turnaround and improved accuracy. Among the QSR solutions available signage systems and digital POS systems are being increasingly adopted as these solutions help serve customers quickly and also help in brand building. Moreover, QSR are allocating large IT budgets in order to embed newer technologies to their businesses. Most of these technologies are shifting to mobile based and analytical solution platform in order to understand and provide quick service to their end–users. Quick service restaurants (QSRs) are the most demanding segment in the restaurant industry for the implementation of technology systems so as to run their daily operations in the most effective and efficient manner.
The global quick service restaurant IT market can be segmented on the basis of component and region. In terms of component, QSR IT market can be divided into hardware, software and service. The hardware segment can be further classified into digital signage, kiosks, drive thru terminals, point of sales, handheld devices and digital menu cards. The software segment is classified into front of house, inventory management, reconcillation, labor management, HR software, data analytics, marketing, restaurant operation, support operation and franchise management. In 2016, demand for software segment was growing, due to visible trend for automation which is primarily catered through QSR software. Therefore, software segment is growing at a faster rate during the forecast period. Geographically, QSR IT market can be divided into North America, Europe, Asia-Pacific, Middle East & Africa and South America. North America is expected to hold largest share among global QSR IT market. Asia-Pacific is expected to witness highest CAGR during the forecast period owing to growing demand for advanced technology in the emerging economies such as China and India in the quick service restaurants.
Increasing hourly wages in QSR industry is triggering the QSR automation which is driving QSR IT industry. QSR automation through integration of hardware, software and cloud offers high profitability in terms of eliminating excess manpower and improving service quality. However, security concerns pertaining to data breaches and challenges pertaining to network connectivity are restraining the growth of QSR IT market. Today, smartphone are standard consumer devices that empower users with social network reviews, price comparisons and information. This also provides customers the ability to pay for food items by simply tapping their smartphone screens which is providing the opportunity for the growth of QSR IT market.
The global QSR IT market is highly fragmented with number of companies operating in the segment. Leading players are currently focusing on providing cost competitive and customized products to the customers. Moreover, as part of this strategy, the companies are engaging in various strategic partnerships, acquisitions, focusing on expanding their business through new service additions and geographical presence.
Some of the key players engaged in QSR IT market include
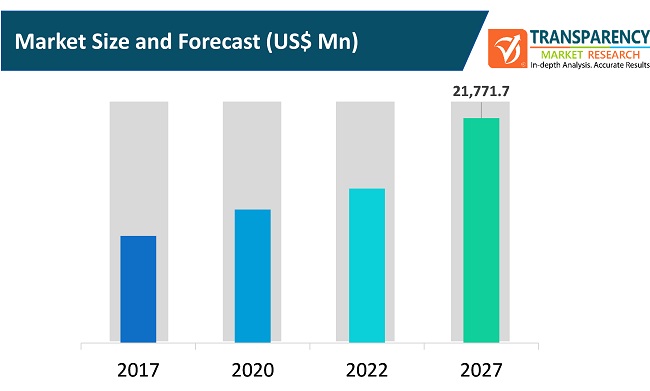
The global Quick Service Restaurant (QSR) IT market is expected to reach US$ 21,771.7 Mn in 2027.
The Quick Service Restaurant (QSR) IT Market is growing at a CAGR of 7.7% over the next 5 years.
The leading companies in the Quick Service Restaurant (QSR) IT market include Abcom Pty Ltd., CAKE Corporation, CAKE Corporation, Delphi Display Systems Inc. GoFrugal Technologies Pvt. Ltd., Microsoft, Oracle Corporation, Panasonic Corporation, VeriFone Systems, Inc., Restaurant Service Solutions and NCR Corporation.
The global Quick Service Restaurants IT market is mainly driven by increasing demand for user-friendly and efficient solutions such as digital signage, point of sales solutions etc.
North America is expected to hold largest share among global QSR IT market. Asia-Pacific is expected to witness highest CAGR during the forecast period owing to growing demand for advanced technology in the emerging economies such as China and India in the quick service restaurants.
1. Preface
1.1. Market Definition and Scope
1.2. Market Segmentation
1.3. Key Research Objectives
1.4. Research Highlights
2. Assumptions and Research Methodology
3. Executive Summary : Global Quick Service Restaurant IT Market
4. Market Overview
4.1. Introduction
4.1.1. Key Industry Evolution/Development
4.2. Key Market Indicators
4.2.1. Quick Service Restaurant IT Market Overview
4.3. Market Dynamics
4.3.1. Drivers
4.3.2. Restraints
4.3.3. Opportunities
4.4. Global Quick Service Restaurant IT Market Analysis (US$ Mn) and Forecast, 2020 – 2027
4.4.1. Market Revenue Projections (US$ Mn)
4.5. Porter’s Five Forces Analysis
4.6. Ecosystem analysis
4.7. Market Outlook
5. Global Quick Service Restaurant IT Market Analysis (US$ Mn) and Forecast , By Component
5.1. Definitions
5.2. Key Findings
5.3. Key Trends
5.4. Quick Service Restaurant IT Market Analysis (US$ Mn) and Forecast By Component , 2020 – 2027
5.4.1. By Hardware
5.4.1.1. Digital Signage
5.4.1.2. Kiosks
5.4.1.3. Drive through terminals
5.4.1.4. Point of Sales
5.4.1.5. Handheld devices
5.4.1.6. Digital menu cards
5.4.2. By Software
5.4.2.1. Front of House
5.4.2.2. Inventory Management
5.4.2.3. Reconciliation
5.4.2.4. Labor Management
5.4.2.5. HR Software
5.4.2.6. Data Analytics
5.4.2.7. Marketing
5.4.2.8. Restaurant Operation
5.4.2.9. Support Operation
5.4.2.10. Franchise Management
5.4.3. By Service
5.5. Components Comparison Matrix
5.6. Market Attractiveness By Component
6. Global Quick Service Restaurant IT Market Analysis (US$ Mn) and Forecast , By Region
6.1. Key Findings
6.2. Quick Service Restaurant IT Market Analysis (US$ Mn) and Forecast By Region, 2020 – 2027
6.2.1. North America
6.2.2. Europe
6.2.3. Asia Pacific
6.2.4. Middle East and Africa
6.2.5. South America
6.3. Market Attractiveness By Country/Region
7. North America Quick Service Restaurant IT Market Analysis (US$ Mn) and Forecast
7.1. Key Findings
7.2. Key Trends
7.3. Quick Service Restaurant IT Market Analysis (US$ Mn) and Forecast By Component , 2020 – 2027
7.3.1. By Hardware
7.3.1.1. Digital Signage
7.3.1.2. Kiosks
7.3.1.3. Drive through terminals
7.3.1.4. Point of Sales
7.3.1.5. Handheld devices
7.3.1.6. Digital menu cards
7.3.2. By Software
7.3.2.1. Front of House
7.3.2.2. Inventory Management
7.3.2.3. Reconciliation
7.3.2.4. Labor Management
7.3.2.5. HR Software
7.3.2.6. Data Analytics
7.3.2.7. Marketing
7.3.2.8. Restaurant Operation
7.3.2.9. Support Operation
7.3.2.10. Franchise Management
7.3.3. By Service
7.4. Quick Service Restaurant IT Market Analysis (US$ Mn) and Forecast By Country, 2020 – 2027
7.4.1. The U.S.
7.4.2. Canada
7.4.3. Rest of North America
7.5. Market Attractiveness Analysis
7.5.1. By Country
7.5.2. By Component
8. Europe Quick Service Restaurant IT Market Analysis (US$ Mn) and Forecast
8.1. Key Findings
8.2. Key Trends
8.3. Quick Service Restaurant IT Market Analysis (US$ Mn) and Forecast By Component , 2020 – 2027
8.3.1. By Hardware
8.3.1.1. Digital Signage
8.3.1.2. Kiosks
8.3.1.3. Drive through terminals
8.3.1.4. Point of Sales
8.3.1.5. Handheld devices
8.3.1.6. Digital menu cards
8.3.2. By Software
8.3.2.1. Front of House
8.3.2.2. Inventory Management
8.3.2.3. Reconciliation
8.3.2.4. Labor Management
8.3.2.5. HR Software
8.3.2.6. Data Analytics
8.3.2.7. Marketing
8.3.2.8. Restaurant Operation
8.3.2.9. Support Operation
8.3.2.10. Franchise Management
8.3.3. By Service
8.4. Quick Service Restaurant IT Market Analysis (US$ Mn) and Forecast By Country, 2020 – 2027
8.4.1. The U.K.
8.4.2. Germany
8.4.3. France
8.4.4. Rest of Europe
8.5. Market Attractiveness Analysis
8.5.1. By Country
8.5.2. By Component
9. Asia Pacific Quick Service Restaurant IT Market Analysis (US$ Mn) and Forecast
9.1. Key Findings
9.2. Key Trends
9.3. Quick Service Restaurant IT Market Analysis (US$ Mn) and Forecast By Component , 2020 – 2027
9.3.1. By Hardware
9.3.1.1. Digital Signage
9.3.1.2. Kiosks
9.3.1.3. Drive through terminals
9.3.1.4. Point of Sales
9.3.1.5. Handheld devices
9.3.1.6. Digital menu cards
9.3.2. By Software
9.3.2.1. Front of House
9.3.2.2. Inventory Management
9.3.2.3. Reconciliation
9.3.2.4. Labor Management
9.3.2.5. HR Software
9.3.2.6. Data Analytics
9.3.2.7. Marketing
9.3.2.8. Restaurant Operation
9.3.2.9. Support Operation
9.3.2.10. Franchise Management
9.3.3. By Service
9.4. Quick Service Restaurant IT Market Analysis (US$ Mn) and Forecast By Country, 2020 – 2027
9.4.1. China
9.4.2. India
9.4.3. Japan
9.4.4. Rest of Asia Pacific
9.5. Market Attractiveness Analysis
9.5.1. By Country
9.5.2. By Component
10. Middle East and Africa (MEA) Quick Service Restaurant IT Market Analysis (US$ Mn) and Forecast
10.1. Key Findings
10.2. Key Trends
10.3. Quick Service Restaurant IT Market Analysis (US$ Mn) and Forecast By Component , 2020 – 2027
10.3.1. By Hardware
10.3.1.1. Digital Signage
10.3.1.2. Kiosks
10.3.1.3. Drive through terminals
10.3.1.4. Point of Sales
10.3.1.5. Handheld devices
10.3.1.6. Digital menu cards
10.3.2. By Software
10.3.2.1. Front of House
10.3.2.2. Inventory Management
10.3.2.3. Reconciliation
10.3.2.4. Labor Management
10.3.2.5. HR Software
10.3.2.6. Data Analytics
10.3.2.7. Marketing
10.3.2.8. Restaurant Operation
10.3.2.9. Support Operation
10.3.2.10. Franchise Management
10.3.3. By Service
10.4. Quick Service Restaurant IT Market Analysis (US$ Mn) and Forecast By Country, 2020 – 2027
10.4.1. UAE
10.4.2. South Africa
10.4.3. Saudi Arabia
10.4.4. Rest of MEA
10.5. Market Attractiveness Analysis
10.5.1. By Country
10.5.2. By Component
11. South America Quick Service Restaurant IT Market Analysis (US$ Mn) and Forecast
11.1. Key Findings
11.2. Key Trends
11.3. Quick Service Restaurant IT Market Analysis (US$ Mn) and Forecast By Component , 2020 – 2027
11.3.1. By Hardware
11.3.1.1. Digital Signage
11.3.1.2. Kiosks
11.3.1.3. Drive through terminals
11.3.1.4. Point of Sales
11.3.1.5. Handheld devices
11.3.1.6. Digital menu cards
11.3.2. By Software
11.3.2.1. Front of House
11.3.2.2. Inventory Management
11.3.2.3. Reconciliation
11.3.2.4. Labor Management
11.3.2.5. HR Software
11.3.2.6. Data Analytics
11.3.2.7. Marketing
11.3.2.8. Restaurant Operation
11.3.2.9. Support Operation
11.3.2.10. Franchise Management
11.3.3. By Service
11.4. Quick Service Restaurant IT Market Analysis (US$ Mn) and Forecast By Country, 2020 – 2027
11.4.1. Brazil
11.4.2. Argentina
11.4.3. Rest of South America
11.5. Market Attractiveness Analysis
11.5.1. By Country
11.5.2. By Component
12. Competition Landscape
12.1. Market Player – Competition Matrix
12.2. Market Share Analysis By Company (2018)
12.3. Company Profiles (Details – Overview, Financials, SWOT Analysis, Strategy)
12.3.1. Abcom Pty Ltd.
12.3.1.1. Company Details and Description*(HQ, Foundation Year, Revenue, Employee Strength)
12.3.1.2. Business Overview*
12.3.1.3. SWOT Analysis*
12.3.1.4. Key Recent Developments*
12.3.1.5. Strategic Overview*
12.3.2. CAKE CORPORATION
12.3.2.1. Company Details and Description*(HQ, Foundation Year, Revenue, Employee Strength)
12.3.2.2. Business Overview*
12.3.2.3. SWOT Analysis*
12.3.2.4. Key Recent Developments*
12.3.2.5. Strategic Overview*
12.3.3. Cognizant
12.3.3.1. Company Details and Description*(HQ, Foundation Year, Revenue, Employee Strength)
12.3.3.2. Business Overview*
12.3.3.3. SWOT Analysis*
12.3.3.4. Key Recent Developments*
12.3.3.5. Strategic Overview*
12.3.4. Delphi Display Systems Inc.
12.3.4.1. Company Details and Description*(HQ, Foundation Year, Revenue, Employee Strength)
12.3.4.2. Business Overview*
12.3.4.3. SWOT Analysis*
12.3.4.4. Key Recent Developments*
12.3.4.5. Strategic Overview*
12.3.5. GoFrugal Technologies Pvt. Ltd.
12.3.5.1. Company Details and Description*(HQ, Foundation Year, Revenue, Employee Strength)
12.3.5.2. Business Overview*
12.3.5.3. SWOT Analysis*
12.3.5.4. Key Recent Developments*
12.3.5.5. Strategic Overview*
12.3.6. HM Electronics, Inc.
12.3.6.1. Company Details and Description*(HQ, Foundation Year, Revenue, Employee Strength)
12.3.6.2. Business Overview*
12.3.6.3. SWOT Analysis*
12.3.6.4. Key Recent Developments*
12.3.6.5. Strategic Overview*
12.3.7. Imagine! Print Solutions
12.3.7.1. Company Details and Description*(HQ, Foundation Year, Revenue, Employee Strength)
12.3.7.2. Business Overview*
12.3.7.3. SWOT Analysis*
12.3.7.4. Key Recent Developments*
12.3.7.5. Strategic Overview*
12.3.8. LG Display Co. Ltd.
12.3.8.1. Company Details and Description*(HQ, Foundation Year, Revenue, Employee Strength)
12.3.8.2. Business Overview*
12.3.8.3. SWOT Analysis*
12.3.8.4. Key Recent Developments*
12.3.8.5. Strategic Overview*
12.3.9. Microsoft Corporation
12.3.9.1. Company Details and Description*(HQ, Foundation Year, Revenue, Employee Strength)
12.3.9.2. Business Overview*
12.3.9.3. SWOT Analysis*
12.3.9.4. Key Recent Developments*
12.3.9.5. Strategic Overview*
12.3.10. NCR Corporation
12.3.10.1. Company Details and Description*(HQ, Foundation Year, Revenue, Employee Strength)
12.3.10.2. Business Overview*
12.3.10.3. SWOT Analysis*
12.3.10.4. Key Recent Developments*
12.3.10.5. Strategic Overview*
12.3.11. NEC Display Solutions of America, Inc.
12.3.11.1. Company Details and Description*(HQ, Foundation Year, Revenue, Employee Strength)
12.3.11.2. Business Overview*
12.3.11.3. SWOT Analysis*
12.3.11.4. Key Recent Developments*
12.3.11.5. Strategic Overview*
12.3.12. Oracle Corporation
12.3.12.1. Company Details and Description*(HQ, Foundation Year, Revenue, Employee Strength)
12.3.12.2. Business Overview*
12.3.12.3. SWOT Analysis*
12.3.12.4. Key Recent Developments*
12.3.12.5. Strategic Overview*
12.3.13. Panasonic Corporation
12.3.13.1. Company Details and Description*(HQ, Foundation Year, Revenue, Employee Strength)
12.3.13.2. Business Overview*
12.3.13.3. SWOT Analysis*
12.3.13.4. Key Recent Developments*
12.3.13.5. Strategic Overview*
12.3.14. PAR Technology Corporation
12.3.14.1. Company Details and Description*(HQ, Foundation Year, Revenue, Employee Strength)
12.3.14.2. Business Overview*
12.3.14.3. SWOT Analysis*
12.3.14.4. Key Recent Developments*
12.3.14.5. Strategic Overview*
12.3.15. Revel Systems, Inc.
12.3.15.1. Company Details and Description*(HQ, Foundation Year, Revenue, Employee Strength)
12.3.15.2. Business Overview*
12.3.15.3. SWOT Analysis*
12.3.15.4. Key Recent Developments*
12.3.15.5. Strategic Overview*
12.3.16. Restaurant Service Solutions
12.3.16.1. Company Details and Description*(HQ, Foundation Year, Revenue, Employee Strength)
12.3.16.2. Business Overview*
12.3.16.3. SWOT Analysis*
12.3.16.4. Key Recent Developments*
12.3.16.5. Strategic Overview*
12.3.17. Verifone Systems, Inc.
12.3.17.1. Company Details and Description*(HQ, Foundation Year, Revenue, Employee Strength)
12.3.17.2. Business Overview*
12.3.17.3. SWOT Analysis*
12.3.17.4. Key Recent Developments*
12.3.17.5. Strategic Overview*
13. Key Takeaways
List of Tables
Table 1: Global Quick Service Restaurants IT Market Analysis and Forecast, By Component, 2015–2025 (US$ Mn)
Table 2: Global Quick Service Restaurants IT Market Analysis and Forecast, By Hardware, 2015–2025 (US$ Mn)
Table 3: Global Quick Service Restaurants IT Market Analysis and Forecast, By Software, 2015–2025 (US$ Mn)
Table 4: Global Quick Service Restaurants IT Market Analysis, By Component
Table 5: Hardware CAGR Analysis
Table 6: Software CAGR Analysis
Table 7: Service CAGR Analysis
Table 8: Global Quick Service Restaurants IT Market Analysis and Forecast, By Region, 2015–2025 (US$ Mn)
Table 9: North America CAGR Analysis
Table 10: Europe CAGR Analysis
Table 11: Asia-pacific CAGR Analysis
Table 12: MEA CAGR Analysis
Table 13: South America CAGR Analysis
Table 14: North America Quick Service Restaurants IT Market Analysis and Forecast, By Component, 2015–2025 (US$ Mn)
Table 15: North America Quick Service Restaurants IT Market Analysis and Forecast, By Hardware, 2015–2025 (US$ Mn)
Table 16: North America Quick Service Restaurants IT Market Analysis and Forecast, By Software, 2015–2025 (US$ Mn)
Table 17: North America Quick Service Restaurants IT Market Analysis, By Component
Table 18: North America Quick Service Restaurants IT Market Analysis and Forecast, By Country, 2015–2025 (US$ Mn)
Table 19: North America Quick Service Restaurants IT Market Analysis, By Country
Table 20: Europe Quick Service Restaurants IT Market Analysis and Forecast, By Component, 2015–2025 (US$ Mn)
Table 21: Europe Quick Service Restaurants IT Market Analysis and Forecast, By Hardware, 2015–2025 (US$ Mn)
Table 22: Europe Quick Service Restaurants IT Market Analysis and Forecast, By Software, 2015–2025 (US$ Mn)
Table 23: Europe Quick Service Restaurants IT Market Analysis, By Component
Table 24: Europe Quick Service Restaurants IT Market Analysis and Forecast, By Country, 2015–2025 (US$ Mn)
Table 25: Europe Quick Service Restaurants IT Market Analysis, By Country
Table 26: Asia-Pacific Quick Service Restaurants IT Market Analysis and Forecast, By Component, 2015–2025 (US$ Mn)
Table 27: Asia-Pacific Quick Service Restaurants IT Market Analysis and Forecast, By Hardware, 2015–2025 (US$ Mn)
Table 28: Asia-Pacific Quick Service Restaurants IT Market Analysis and Forecast, By Software, 2015–2025 (US$ Mn)
Table 29: Asia-Pacific Quick Service Restaurants IT Market Analysis, By Component
Table 30: Asia-Pacific Quick Service Restaurants IT Market Analysis and Forecast, By Country, 2015–2025 (US$ Mn)
Table 31: Asia-Pacific Quick Service Restaurants IT Market Analysis, By Country
Table 32: MEA Quick Service Restaurants IT Market Analysis and Forecast, By Component, 2015–2025 (US$ Mn)
Table 33: MEA Quick Service Restaurants IT Market Analysis and Forecast, By Hardware, 2015–2025 (US$ Mn)
Table 34: MEA Quick Service Restaurants IT Market Analysis and Forecast, By Software, 2015–2025 (US$ Mn)
Table 35: MEA Quick Service Restaurants IT Market Analysis, By Component
Table 36: MEA Quick Service Restaurants IT Market Analysis and Forecast, By Country, 2015–2025 (US$ Mn)
Table 37: Asia-Pacific Quick Service Restaurants IT Market Analysis, By Country
Table 38: South America Quick Service Restaurants IT Market Analysis and Forecast, By Component, 2015–2025 (US$ Mn)
Table 39: South America Quick Service Restaurants IT Market Analysis and Forecast, By Hardware, 2015–2025 (US$ Mn)
Table 40: South America Quick Service Restaurants IT Market Analysis and Forecast, By Software, 2015–2025 (US$ Mn)
Table 41: MEA Quick Service Restaurants IT Market Analysis, By Component
Table 42: South America Quick Service Restaurants IT Market Analysis and Forecast, By Country, 2015–2025 (US$ Mn)
Table 43: South America Quick Service Restaurants IT Market Analysis, By Country
List of Figures
Figure 1: Key Research Insight
Figure 2: Quick Service Restaurants IT Market Size (US$ Mn) and Y-O-Y (value %) Forecast, 2020 – 2027
Figure 3: Ecosystem Analysis
Figure 4: Global Quick Service Restaurants IT Market Revenue Share Analysis, By Component, 2017 and 2025
Figure 5: Quick Service Restaurants IT Market Value Share Analysis, by Hardware
Figure 6: Quick Service Restaurants IT Market Value Share Analysis, by Software
Figure 7: Quick Service Restaurants IT Market Value Share Analysis, by Services
Figure 8: Global Quick Service Restaurants IT Comparison Matrix, By Type
Figure 9: Global Quick Service Restaurants IT Market Attractiveness Analysis, by Component
Figure 11: Quick Service Restaurants IT Market Value Share Analysis, by North America
Figure 12: Quick Service Restaurants IT Market Value Share Analysis, by Europe
Figure 13: Quick Service Restaurants IT Market Value Share Analysis, by Asia Pacific
Figure 14: Quick Service Restaurants IT Market Value Share Analysis, by Middle East & Africa
Figure 15: Quick Service Restaurants IT Market Value Share Analysis, by South America
Figure 16: Global Quick Service Restaurant IT Market Attractiveness Analysis, By Region
Figure 17: North America Quick Service Restaurants IT Market Revenue (US$ Mn) Forecast, 2017 – 2025
Figure 18: North America Quick Service Restaurants IT Market Revenue and Y-O-Y Growth Projection, 2017 – 2025
Figure 19: North America Quick Service Restaurants IT Market Revenue Share Analysis, By Component, 2017 and 2025
Figure 20: North America Quick Service Restaurants IT Market Revenue Share Analysis, By Country, 2017 and 2025
Figure 21: North America Quick Service Restaurants IT Market Attractiveness Analysis, By Component
Figure 22: North America Quick Service Restaurants IT Market Attractiveness Analysis, By Country
Figure 23: Europe Quick Service Restaurants IT Market Revenue (US$ Mn) Forecast, 2017 – 2025
Figure 24: Europe Quick Service Restaurants IT Market Revenue and Y-O-Y Growth Projection, 2017 – 2025
Figure 25: Europe Quick Service Restaurants IT Market Revenue Share Analysis, By Component, 2017 and 2025
Figure 26: Europe Quick Service Restaurants IT Market Revenue Share Analysis, By Country, 2017 and 2025
Figure 27: Europe Quick Service Restaurants IT Market Attractiveness Analysis, By Component
Figure 28: Europe Quick Service Restaurants IT Market Attractiveness Analysis, By Country
Figure 29: Asia-Pacific Quick Service Restaurants IT Market Revenue (US$ Mn) Forecast, 2017 – 2025
Figure 30: Asia-Pacific Quick Service Restaurants IT Market Revenue and Y-O-Y Growth Projection, 2017 – 2025
Figure 31: Asia-Pacific Quick Service Restaurants IT Market Revenue Share Analysis, By Component, 2017 and 2025
Figure 32: Asia-Pacific Quick Service Restaurants IT Market Revenue Share Analysis, By Country, 2017 and 2025
Figure 33: Asia-Pacific Quick Service Restaurants IT Market Attractiveness Analysis, By Component
Figure 34: Asia-Pacific Quick Service Restaurants IT Market Attractiveness Analysis, By Country
Figure 35: MEA Quick Service Restaurants IT Market Revenue (US$ Mn) Forecast, 2017 – 2025
Figure 36: MEA Quick Service Restaurants IT Market Revenue and Y-O-Y Growth Projection, 2017 – 2025
Figure 37: MEA Quick Service Restaurants IT Market Revenue Share Analysis, By Component, 2017 and 2025
Figure 38: MEA Quick Service Restaurants IT Market Revenue Share Analysis, By Country, 2017 and 2025
Figure 39: MEA Quick Service Restaurants IT Market Attractiveness Analysis, By Component
Figure 40: MEA Quick Service Restaurants IT Market Attractiveness Analysis, By Country
Figure 41: South America Quick Service Restaurants IT Market Revenue (US$ Mn) Forecast, 2017 – 2025
Figure 42: South America Quick Service Restaurants IT Market Revenue and Y-O-Y Growth Projection, 2017 – 2025
Figure 43: South America Quick Service Restaurants IT Market Revenue Share Analysis, By Component, 2017 and 2025
Figure 44: South America Quick Service Restaurants IT Market Revenue Share Analysis, By Country, 2017 and 2025
Figure 45: South America Quick Service Restaurants IT Market Attractiveness Analysis, By Component
Figure 46: South America Quick Service Restaurants IT Market Attractiveness Analysis, By Country
Figure 47: Cognizant Revenue (US$ Mn) & Y-o-Y Growth (%), 2014–2016
Figure 48: Cognizant Breakdown of Net Sales, by Geography, 2016
Figure 49: LG Display Co. Ltd. Revenue (US$ Mn) & Y-o-Y Growth (%), 2014–2016
Figure 50: LG Display Co. Ltd. Breakdown of Net Sales, by Geography, 2016
Figure 51: Microsoft Corporation Revenue (US$ Mn) & Y-o-Y Growth (%), 2014–2016
Figure 52: Microsoft Corporation Breakdown of Net Sales, by Geography, 2016
Figure 53: NCR Corporation Revenue (US$ Mn) & Y-o-Y Growth (%), 2014–2016
Figure 54: NCR Corporation Breakdown of Net Sales, by Geography, 2016
Figure 55: NEC Display Solutions Ltd. Revenue (US$ Mn) & Y-o-Y Growth (%), 2015–2017
Figure 56: Oracle Corporation Revenue (US$ Mn) & Y-o-Y Growth (%), 2014–2016
Figure 57: Oracle Corporation Breakdown of Net Sales, by Geography, 2016
Figure 58: Panasonic Corporation Revenue (US$ Mn) & Y-o-Y Growth (%), 2014–2016
Figure 59: Panasonic Corporation Breakdown of Net Sales, by Geography, 2016
Figure 60: PAR Technology Corporation Revenue (US$ Mn) & Y-o-Y Growth (%), 2014–2016
Figure 61: PAR Technology Coproration Breakdown of Net Sales, by Geography, 2016
Figure 62: Verifone Systems, Inc. Revenue (US$ Mn) & Y-o-Y Growth (%), 2014–2016
Figure 63: Verifone Systems, Inc. Breakdown of Net Sales, by Geography, 2016
Copyright © Transparency Market Research, Inc. All Rights reserved
Trust Online

Quick Service Restaurant (QSR) IT Market
