The influence of the younger population on the food & beverages industry is evident, as market trends continue to evolve at a rapid pace. Modern-day consumerism largely constitutes of health-conscious consumers that are increasingly shying away from consuming processed or food products made from synthetic ingredients. The demand for natural and organic food products is on the rise due to which, the frozen fruits market is expected to witness significant growth during the forecast period (2020-2030). In addition, as consumer awareness pertaining to the potential benefits of consuming natural food products continues to grow, the demand is likely to move in the upward direction. The rise in the vegan population around the world is another factor that is expected to provide an impetus for growth of the global frozen fruits market over the next few years.
Players operating in the current frozen fruits market are largely focusing on developing impactful value prepositions for the millennial population. Although the frozen food sector has not yet attracted a sizeable number of consumers around the world, the trend is gradually changing. In their bid to increase sales and establish a solid foothold in the frozen fruits market landscape, several players are primarily focusing on the quality and packaging of their products. Moreover, branding and marketing strategies are being continually reviewed to attract a larger consumer base due to which, the sale of frozen fruits is estimated to grow consistently in the near future. At the back of these factors, the global frozen fruits market is projected to reach a market value of ~US$ 21 Bn by the end of 2030.
As modern-day consumers are increasingly shifting toward healthier food products, the demand for frozen fruits has witnessed considerable growth. Furthermore, due to the high nutritional value of frozen fruits, they are increasingly being used in a host of industrial applications. As research and development activities gain momentum, along with developments in the food science sector, frozen fruits offer immense promise in several industrial applications.
Apart from the food sector, the frozen fruit pulp is predominantly used as a value-added product in cosmetic and pharmaceutical sectors. The export of frozen fruit pulp to both, developed as well as developing regions of the world has increased at an impressive pace over the past few years. The frozen fruit pulp is utilized in various ways in different regions of the world. For instance, in Latin America, Camu-Camu is primarily used in food, pharmaceutical, and cosmetic industries. In the food industry, the frozen fruit pulp is used to increase the vitamin C content. As the application of frozen fruit pulp continue to widen, it directly impacts the demand for frozen fruits. The frozen fruit pulp is also used to produce a host of products, including juice, jams, nectar, candies, and alcoholic drinks.
In their bid to enhance their share of the global frozen fruits market, market participants are increasingly focusing on the packaging of their products to attract more consumers. Several market players are also investing resources to develop environment-friendly packaging solutions amid mounting environmental concerns. While several companies are prioritizing packaging, a number of organizations are reviewing their marketing strategies to increase their consumer base. Digital marketing strategies coupled with informative and interactive video advertisements are likely to create a substantial demand for frozen food products and items during the assessment period.
The ongoing COVID-19 crisis has largely affected the supply chain of major industrial sectors, including the food & beverages sector. As governments across the world continue to impose stringent restrictions on cross-border trade and transportation, barriers within the supply chain are likely to remain a major challenge for players in the frozen fruits market. The demand for frozen food products has witnessed a decline around the world, as consumers are largely opting for unfrozen fruits and vegetables over frozen counterparts. However, in several regions of the world such as the U.S., Australia, and more, due to speculation of a lockdown, the sale of frozen fruit pulps and syrups witnessed a spike in the first two quarters of 2020.
Although the market is expected to witness modest growth in 2020, the demand for frozen fruits is projected to grow toward the end of 2020.
Analysts’ Viewpoint
The global frozen fruits market is expected to grow at a healthy CAGR of 5.6% during the forecast period. The market growth can be attributed to the growing demand for frozen fruit pulps from multiple industrial sectors, including pharmaceutical, food, and cosmetics. In addition, as brands continue to invest in innovative packaging solutions and marketing strategies, sales will grow during the forecast period. The growth in the number of vegans around the world coupled with the growing demand for natural food products will play a key role in boosting the growth of the global frozen fruits market in the near future.
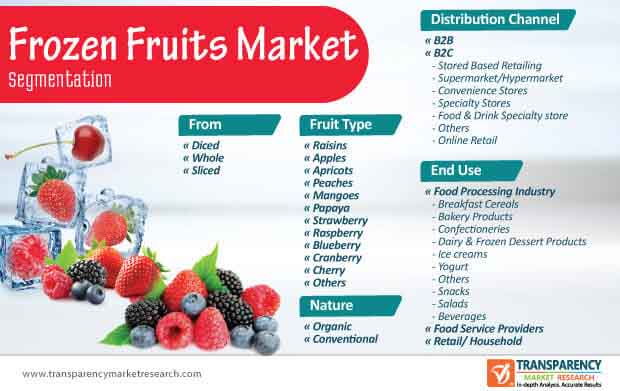
Frozen Fruits Market: Overview
Frozen Fruits: Market Frontrunners
Frozen Fruits Market: Trends
Manufacturers are focusing on advanced methods and technologies to improve the quality and shelf life of bakery products. The manufacturers are incorporating frozen fruits in their bakery products to give freshness and natural look to their products so as to increase profitability. Modern bakery products, especially cakes, muffins, tarts, rolls, jams, and jellies are widely used in frozen fruits. There is a rising demand for frozen berry fruits, especially in desserts, fruit snacks, frozen fruit salads, yogurts, and smoothies.
Veganism is one of the key drivers for the frozen fruits market; companies are targeting on vegan and vegetarian populations, owing to consumer demand for healthy products. Adding fruits such as fresh peaches, bananas, strawberries pineapples, blueberries, cherries, and grapes are gaining traction in non-dairy plant-based products. The leading factor for the rising demand for frozen fruits from the vegan population is health benefits, environmental, and ethical concerns relating to dairy products.
Frozen Fruits Market: Strategies
Target Regions for Market
Frozen Fruits: Market Players
1. Executive Summary
1.1. Global Market Outlook
1.2. Demand-side Trends
1.3. Supply-side Trends
1.4. Analysis and Recommendations
2. Market Overview
2.1. Market Coverage / Taxonomy
2.2. Market Definition / Scope / Limitations
3. Consumer Behaviour and Attitude Measurement
4. Product Launch Track & Trends
5. Global Frozen Fruits Market Demand Analysis 2015-2019 and Forecast, 2020-2030
5.1. Historical Market Volume (Metric Tons) Analysis, 2015-2019
5.2. Current and Future Market Volume (Metric Tons) Projections, 2020-2030
5.3. Y-o-Y Growth Trend Analysis
6. Global Frozen Fruits Market - Pricing Analysis
6.1. Regional Pricing Analysis (US$/Metric Tons) Fruit Type
6.2. Pricing Break-up
6.2.1. Producer Level Pricing
6.2.2. Distributor Level Pricing
6.2.3. Retail Pricing
6.3. Global Average Pricing Analysis Benchmark
7. Global Frozen Fruits Market Demand (Size in US$ Mn) Analysis 2015-2019 and Forecast, 2020-2030
7.1. Historical Market Value (US$ Mn) Analysis, 2015-2019
7.2. Current and Future Market Value (US$ Mn) Projections, 2020-2030
7.2.1. Y-o-Y Growth Trend Analysis
7.2.2. Absolute $ Opportunity Analysis
8. Market Background
8.1. Global Frozen Fruits Market Overview
8.1.1. Total Frozen Fruits Production, by Country/Region
8.1.2. Imports/Exports Scenario
8.1.3. Demand/Supply for Beer
8.2. Macro-Economic Factors
8.3. Forecast Factors - Relevance & Impact
8.4. Value Chain Analysis
8.4.1. Raw Material Suppliers
8.4.2. Product Manufacturers
8.4.3. Distributors/Suppliers/Wholesalers
8.5. Market Dynamics
8.5.1. Drivers
8.5.2. Restraints
8.5.3. Opportunity
8.6. Key Regulations
9. Global Frozen Fruits Market Analysis 2015-2019 and Forecast 2020-2030, By Nature
9.1. Introduction / Key Findings
9.2. Historical Market Size (US$ Mn) and Volume Analysis By Nature, 2015 - 2019
9.3. Current and Future Market Size (US$ Mn) and Volume Analysis and Forecast By Nature, 2020 - 2030
9.3.1. Organic
9.3.2. Conventional
9.4. Market Attractiveness Analysis By Nature
10. Global Frozen Fruits Market Analysis 2015-2019 and Forecast 2020-2030, By Form
10.1. Introduction / Key Findings
10.2. Historical Market Size (US$ Mn) and Volume Analysis By Form, 2015 - 2019
10.3. Current and Future Market Size (US$ Mn) and Volume Analysis and Forecast By Form, 2020 - 2030
10.3.1. Diced
10.3.2. Whole
10.3.3. Sliced
10.4. Market Attractiveness Analysis By Form
11. Global Frozen Fruits Market Analysis 2015-2019 and Forecast 2020-2030, By Fruit Type
11.1. Introduction / Key Findings
11.2. Historical Market Size (US$ Mn) and Volume Analysis By Fruit Type, 2015 - 2019
11.3. Current and Future Market Size (US$ Mn) and Volume Analysis and Forecast By Fruit Type, 2020 - 2030
11.3.1. Raisins
11.3.2. Apples
11.3.3. Apricots
11.3.4. Peaches
11.3.5. Mangoes
11.3.6. Papaya
11.3.7. Strawberry
11.3.8. Raspberry
11.3.9. Blueberry
11.3.10. Cranberry
11.3.11. Cherry
11.3.12. Others
11.4. Market Attractiveness Analysis By Fruit Type
12. Global Frozen Fruits Market Analysis 2015-2019 and Forecast 2020-2030, By End Use
12.1. Introduction / Key Findings
12.2. Historical Market Size (US$ Mn) and Volume Analysis By End Use, 2015 - 2019
12.3. Current and Future Market Size (US$ Mn) and Volume Analysis and Forecast By End Use, 2020 - 2030
12.3.1. Food Processing Industry
12.3.1.1. Breakfast Cereals
12.3.1.2. Bakery Products
12.3.1.3. Confectioneries
12.3.1.4. Dairy & Frozen Dessert Products
12.3.1.5. Ice creams
12.3.1.6. Yogurt
12.3.1.7. Others
12.3.1.8. Snacks
12.3.1.9. Salads
12.3.1.10. Beverages
12.3.2. Food Service Providers
12.3.3. Retail/ Household
12.4. Market Attractiveness Analysis By End Use
13. Global Frozen Fruits Market Analysis 2015-2019 and Forecast 2020-2030, By Distribution Channel
13.1. Introduction / Key Findings
13.2. Historical Market Size (US$ Mn) and Volume Analysis By Distribution Channel, 2015 - 2019
13.3. Current and Future Market Size (US$ Mn) and Volume Analysis and Forecast By Distribution Channel, 2020 - 2030
13.3.1. B2B
13.3.2. B2C
13.3.2.1. Store-Based Retailing
13.3.2.1.1. Supermarket/Hypermarket
13.3.2.1.2. Convenience Stores
13.3.2.1.3. Specialty Stores
13.3.2.1.4. Food & Drink Specialty store
13.3.2.1.5. Others
13.3.2.2. Online Retail
13.4. Market Attractiveness Analysis By Distribution Channel
14. Global Frozen Fruits Market Analysis 2015-2019 and Forecast 2020-2030, By Region
14.1. Introduction
14.2. Historical Market Size (US$ Mn) and Volume Analysis By Region, 2015 - 2019
14.3. Current Market Size (US$ Mn) and Volume Analysis and Forecast By Region, 2020 - 2030
14.3.1. North America
14.3.2. Latin America
14.3.3. Europe
14.3.4. Asia Pacific Excluding Japan
14.3.5. Japan
14.3.6. Middle East and Africa (MEA)
14.3.7. Oceania
14.4. Market Attractiveness Analysis By Region
15. North America Frozen Fruits Market Analysis 2015-2019 and Forecast 2020-2030
15.1. Introduction
15.2. Historical Market Size (US$ Mn) and Volume Trend Analysis By Market Taxonomy, 2015 - 2019
15.3. Market Size (US$ Mn) and Volume Forecast By Market Taxonomy, 2020 - 2030
15.3.1. By Country
15.3.1.1. U.S.
15.3.1.2. Canada
15.3.2. By Nature
15.3.3. By Form
15.3.4. By Fruit type
15.3.5. By End Use
15.3.6. By Distribution Channel
15.4. Market Attractiveness Analysis
15.4.1. By Country
15.4.2. By Nature
15.4.3. By Form
15.4.4. By Fruit type
15.4.5. By End Use
15.4.6. By Distribution Channel
15.5. Market Trends
15.6. Key Market Participants - Intensity Mapping
15.7. Drivers and Restraints - Impact Analysis
16. Latin America Frozen Fruits Market Analysis 2015-2019 and Forecast 2020-2030
16.1. Introduction
16.2. Historical Market Size (US$ Mn) and Volume Trend Analysis By Market Taxonomy, 2015 - 2019
16.3. Market Size (US$ Mn) and Volume Forecast By Market Taxonomy, 2020 - 2030
16.3.1. By Country
16.3.1.1. Argentina
16.3.1.2. Brazil
16.3.1.3. Mexico
16.3.1.4. Chile
16.3.1.5. Peru
16.3.1.6. Rest of Latin America
16.3.2. By Nature
16.3.3. By Form
16.3.4. By Fruit type
16.3.5. By End Use
16.3.6. By Distribution Channel
16.4. Market Attractiveness Analysis
16.4.1. By Country
16.4.2. By Nature
16.4.3. By Form
16.4.4. By Fruit type
16.4.5. By End Use
16.4.6. By Distribution Channel
16.5. Market Trends
16.6. Key Market Participants - Intensity Mapping
16.7. Drivers and Restraints - Impact Analysis
17. Europe Frozen Fruits Market Analysis 2015-2019 and Forecast 2020-2030
17.1. Introduction
17.2. Historical Market Size (US$ Mn) and Volume Trend Analysis By Market Taxonomy, 2015 - 2019
17.3. Market Size (US$ Mn) and Volume Forecast By Market Taxonomy, 2020 - 2030
17.3.1. By Country
17.3.1.1. Germany
17.3.1.2. Italy
17.3.1.3. France
17.3.1.4. U.K.
17.3.1.5. Spain
17.3.1.6. BENELUX
17.3.1.7. Nordic
17.3.1.8. Russia
17.3.1.9. Poland
17.3.1.10. Rest of Europe
17.3.2. By Nature
17.3.3. By Form
17.3.4. By Fruit type
17.3.5. By End Use
17.3.6. By Distribution Channel
17.4. Market Attractiveness Analysis
17.4.1. By Country
17.4.2. By Nature
17.4.3. By Form
17.4.4. By Fruit type
17.4.5. By End Use
17.4.6. By Distribution Channel
17.5. Market Trends
17.6. Key Market Participants - Intensity Mapping
17.7. Drivers and Restraints - Impact Analysis
18. Asia Pacific Excluding Japan Frozen Fruits Market Analysis 2015-2019 and Forecast 2020-2030
18.1. Introduction
18.2. Historical Market Size (US$ Mn) and Volume Trend Analysis By Market Taxonomy, 2015 - 2019
18.3. Market Size (US$ Mn) and Volume Forecast By Market Taxonomy, 2020 - 2030
18.3.1. By Country
18.3.1.1. China
18.3.1.2. India
18.3.1.3. South Korea
18.3.1.4. Association of Southeast Asian Nations (ASEAN)
18.3.2. By Nature
18.3.3. By Form
18.3.4. By Fruit type
18.3.5. By End Use
18.3.6. By Distribution Channel
18.4. Market Attractiveness Analysis
18.4.1. By Country
18.4.2. By Nature
18.4.3. By Form
18.4.4. By Fruit type
18.4.5. By End Use
18.4.6. By Distribution Channel
18.5. Market Trends
18.6. Key Market Participants - Intensity Mapping
18.7. Drivers and Restraints - Impact Analysis
19. Japan Frozen Fruit Market Analysis 2015-2019 and Forecast 2020-2030
19.1. Introduction
19.2. Historical Market Size (US$ Mn) and Volume Trend Analysis By Market Taxonomy, 2015 - 2019
19.3. Market Size (US$ Mn) and Volume Forecast By Market Taxonomy, 2020 - 2030
19.3.1. By Nature
19.3.2. By Form
19.3.3. By Fruit type
19.3.4. By End Use
19.3.5. By Distribution Channel
19.4. Market Attractiveness Analysis
19.4.1. By Nature
19.4.2. By Form
19.4.3. By Fruit type
19.4.4. By End Use
19.4.5. By Distribution Channel
19.5. Market Trends
19.6. Key Market Participants - Intensity Mapping
19.7. Drivers and Restraints - Impact Analysis
20. Middle East and Africa Frozen Fruits Market Analysis 2015-2019 and Forecast 2020-2030
20.1. Introduction
20.2. Historical Market Size (US$ Mn) and Volume Trend Analysis By Market Taxonomy, 2015 - 2019
20.3. Market Size (US$ Mn) and Volume Forecast By Market Taxonomy, 2020 - 2030
20.3.1. By Country
20.3.1.1. GCC Countries
20.3.1.2. South Africa
20.3.1.3. Turkey
20.3.1.4. Iran
20.3.1.5. Israel
20.3.1.6. Rest of Middle East and Africa
20.3.2. By Nature
20.3.3. By Form
20.3.4. By Fruit type
20.3.5. By End Use
20.3.6. By Distribution Channel
20.4. Market Attractiveness Analysis
20.4.1. By Country
20.4.2. By Nature
20.4.3. By Form
20.4.4. By Fruit type
20.4.5. By End Use
20.4.6. By Distribution Channel
20.5. Market Trends
20.6. Key Market Participants - Intensity Mapping
20.7. Drivers and Restraints - Impact Analysis
21. Oceania Frozen Fruits Market Analysis 2015-2019 and Forecast 2020-2030
21.1. Introduction
21.2. Historical Market Size (US$ Mn) and Volume Trend Analysis By Market Taxonomy, 2015 - 2019
21.3. Market Size (US$ Mn) and Volume Forecast By Market Taxonomy, 2020 - 2030
21.3.1. By Country
21.3.1.1. Australia
21.3.1.2. New Zealand
21.3.2. By Nature
21.3.3. By Form
21.3.4. By Fruit type
21.3.5. By End Use
21.3.6. By Distribution Channel
21.4. Market Attractiveness Analysis
21.4.1. By Country
21.4.2. By Nature
21.4.3. By Form
21.4.4. By Fruit type
21.4.5. By End Use
21.4.6. By Distribution Channel
21.5. Market Trends
21.6. Key Market Participants - Intensity Mapping
21.7. Drivers and Restraints - Impact Analysis
22. Competition Assessment
22.1. Global Frozen Fruits Market Competition - a Dashboard View
22.2. Global Frozen Fruits Market Structure Analysis
22.3. Global Frozen Fruits Market Company Share Analysis
22.3.1. For Tier 1 Market Players, 2019
22.3.2. Company Market Share Analysis of Top 10 Players, By Region
22.3.3. Key Participants Market Presence (Intensity Mapping) by Region
23. Competition Analysis
23.1. Competition Dashboard
23.2. Pricing Analysis by Competition
23.3. Competition Benchmarking
23.4. Competition Deep Dive
23.4.1. SunOpta Inc.
23.4.1.1. Overview
23.4.1.2. Product Portfolio
23.4.1.3. Distribution Footprint
23.4.1.4. Channel Footprint
23.4.1.5. Strategy Overview
23.4.1.6. Financial Analysis
23.4.1.7. Revenue Share
23.4.1.8. Analyst Comments
23.4.2. Diafrost Frozen Fruit Industry N.V.
23.4.2.1. Overview
23.4.2.2. Product Portfolio
23.4.2.3. Distribution Footprint
23.4.2.4. Channel Footprint
23.4.2.5. Strategy Overview
23.4.2.6. Financial Analysis
23.4.2.7. Revenue Share
23.4.2.8. Analyst Comments
23.4.3. Nestlé S.A.
23.4.3.1. Overview
23.4.3.2. Product Portfolio
23.4.3.3. Distribution Footprint
23.4.3.4. Channel Footprint
23.4.3.5. Strategy Overview
23.4.3.6. Financial Analysis
23.4.3.7. Revenue Share
23.4.3.8. Analyst Comments
23.4.4. Inventure Foods, Inc
23.4.4.1. Overview
23.4.4.2. Product Portfolio
23.4.4.3. Distribution Footprint
23.4.4.4. Channel Footprint
23.4.4.5. Strategy Overview
23.4.4.6. Financial Analysis
23.4.4.7. Revenue Share
23.4.4.8. Analyst Comments
23.4.5. Dairy Farmers of America
23.4.5.1. Overview
23.4.5.2. Product Portfolio
23.4.5.3. Distribution Footprint
23.4.5.4. Channel Footprint
23.4.5.5. Strategy Overview
23.4.5.6. Financial Analysis
23.4.5.7. Revenue Share
23.4.5.8. Analyst Comments
23.4.6. Fruitex Australia
23.4.6.1. Overview
23.4.6.2. Product Portfolio
23.4.6.3. Distribution Footprint
23.4.6.4. Channel Footprint
23.4.6.5. Strategy Overview
23.4.6.6. Financial Analysis
23.4.6.7. Revenue Share
23.4.6.8. Analyst Comments
23.4.7. Danone
23.4.7.1. Overview
23.4.7.2. Product Portfolio
23.4.7.3. Distribution Footprint
23.4.7.4. Channel Footprint
23.4.7.5. Strategy Overview
23.4.7.6. Financial Analysis
23.4.7.7. Revenue Share
23.4.7.8. Analyst Comments
23.4.8. Arla Foods
23.4.8.1. Overview
23.4.8.2. Product Portfolio
23.4.8.3. Distribution Footprint
23.4.8.4. Channel Footprint
23.4.8.5. Strategy Overview
23.4.8.6. Financial Analysis
23.4.8.7. Revenue Share
23.4.8.8. Analyst Comments
23.4.9. Dean Foods
23.4.9.1. Overview
23.4.9.2. Product Portfolio
23.4.9.3. Distribution Footprint
23.4.9.4. Channel Footprint
23.4.9.5. Strategy Overview
23.4.9.6. Financial Analysis
23.4.9.7. Revenue Share
23.4.9.8. Analyst Comments
23.4.10. Capricorn Food Products India Ltd.
23.4.10.1. Overview
23.4.10.2. Product Portfolio
23.4.10.3. Distribution Footprint
23.4.10.4. Channel Footprint
23.4.10.5. Strategy Overview
23.4.10.6. Financial Analysis
23.4.10.7. Revenue Share
23.4.10.8. Analyst Comments
23.4.11. Cal Pacific Specialty Foods
23.4.11.1. Overview
23.4.11.2. Product Portfolio
23.4.11.3. Distribution Footprint
23.4.11.4. Channel Footprint
23.4.11.5. Strategy Overview
23.4.11.6. Financial Analysis
23.4.11.7. Revenue Share
23.4.11.8. Analyst Comments
23.4.12. Ravifruit (Kerry Group)
23.4.12.1. Overview
23.4.12.2. Product Portfolio
23.4.12.3. Distribution Footprint
23.4.12.4. Channel Footprint
23.4.12.5. Strategy Overview
23.4.12.6. Financial Analysis
23.4.12.7. Revenue Share
23.4.12.8. Analyst Comments
23.4.13. Uren Food Group Limited.
23.4.13.1. Overview
23.4.13.2. Product Portfolio
23.4.13.3. Distribution Footprint
23.4.13.4. Channel Footprint
23.4.13.5. Strategy Overview
23.4.13.6. Financial Analysis
23.4.13.7. Revenue Share
23.4.13.8. Analyst Comments
23.4.14. Venus Processing and Packaging Limited (Sympli)
23.4.14.1. Overview
23.4.14.2. Product Portfolio
23.4.14.3. Distribution Footprint
23.4.14.4. Channel Footprint
23.4.14.5. Strategy Overview
23.4.14.6. Financial Analysis
23.4.14.7. Revenue Share
23.4.14.8. Analyst Comments
23.4.15. Rosemary and Thyme Limited
23.4.15.1. Overview
23.4.15.2. Product Portfolio
23.4.15.3. Distribution Footprint
23.4.15.4. Channel Footprint
23.4.15.5. Strategy Overview
23.4.15.6. Financial Analysis
23.4.15.7. Revenue Share
23.4.15.8. Analyst Comments
23.4.16. Brecon Foods
23.4.16.1. Overview
23.4.16.2. Product Portfolio
23.4.16.3. Distribution Footprint
23.4.16.4. Channel Footprint
23.4.16.5. Strategy Overview
23.4.16.6. Financial Analysis
23.4.16.7. Revenue Share
23.4.16.8. Analyst Comments
23.4.17. Dole Packaged Foods LLC
23.4.17.1. Overview
23.4.17.2. Product Portfolio
23.4.17.3. Distribution Footprint
23.4.17.4. Channel Footprint
23.4.17.5. Strategy Overview
23.4.17.6. Financial Analysis
23.4.17.7. Revenue Share
23.4.17.8. Analyst Comments
23.4.18. Milne Fruit Pty Ltd.
23.4.18.1. Overview
23.4.18.2. Product Portfolio
23.4.18.3. Distribution Footprint
23.4.18.4. Channel Footprint
23.4.18.5. Strategy Overview
23.4.18.6. Financial Analysis
23.4.18.7. Revenue Share
23.4.18.8. Analyst Comments
23.4.19. Shimla Hills Offerings Pvt. Ltd.
23.4.19.1. Overview
23.4.19.2. Product Portfolio
23.4.19.3. Distribution Footprint
23.4.19.4. Channel Footprint
23.4.19.5. Strategy Overview
23.4.19.6. Financial Analysis
23.4.19.7. Revenue Share
23.4.19.8. Analyst Comments
23.4.20. Stahlbush Island Farms Inc.
23.4.20.1. Overview
23.4.20.2. Product Portfolio
23.4.20.3. Distribution Footprint
23.4.20.4. Channel Footprint
23.4.20.5. Strategy Overview
23.4.20.6. Financial Analysis
23.4.20.7. Revenue Share
23.4.20.8. Analyst Comments
23.4.21. SILOCY Cooperative
23.4.21.1. Overview
23.4.21.2. Product Portfolio
23.4.21.3. Distribution Footprint
23.4.21.4. Channel Footprint
23.4.21.5. Strategy Overview
23.4.21.6. Financial Analysis
23.4.21.7. Revenue Share
23.4.21.8. Analyst Comments
23.4.22. DMH Ingredients
23.4.22.1. Overview
23.4.22.2. Product Portfolio
23.4.22.3. Distribution Footprint
23.4.22.4. Channel Footprint
23.4.22.5. Strategy Overview
23.4.22.6. Financial Analysis
23.4.22.7. Revenue Share
23.4.22.8. Analyst Comments
23.4.23. Coloma Frozen Foods
23.4.23.1. Overview
23.4.23.2. Product Portfolio
23.4.23.3. Distribution Footprint
23.4.23.4. Channel Footprint
23.4.23.5. Strategy Overview
23.4.23.6. Financial Analysis
23.4.23.7. Revenue Share
23.4.23.8. Analyst Comments
23.4.24. Cherry Central Inc.
23.4.24.1. Overview
23.4.24.2. Product Portfolio
23.4.24.3. Distribution Footprint
23.4.24.4. Channel Footprint
23.4.24.5. Strategy Overview
23.4.24.6. Financial Analysis
23.4.24.7. Revenue Share
23.4.24.8. Analyst Comments
24. Scenario Assessment of the Impact of COVID-19 on Frozen Fruits Market
24.1. Current Scenario/ Immediate Actions
24.2. Customers will change some behaviors permanently- accelerating prior trends; bold action now can set you up for success through the downturn and beyond
24.3. Market Scenario and the Forward Path
24.3.1. Global Frozen Fruits Market Forecast Scenario Comparison of Annual Growth Rates for short Term (2020-2023) and Long Term (2024-2030)
24.3.1.1. Optimistic Scenario
24.3.1.2. Likely Scenario
24.3.1.3. Pessimistic Scenario
24.4. Key Factors Impacting the Market
25. Assumptions and Acronyms Used
26. Research Methodology
List of Tables
Table 1: Global Frozen Fruits Market Value (US$ Mn) and Forecast by Region, 2015–2019
Table 2: Global Frozen Fruits Market Value (US$ Mn) and Forecast by Region, 2020–2030
Table 3: Global Frozen Fruits Market Volume (Metric Tons) and Forecast by Region, 2015–2019
Table 4: Global Frozen Fruits Market Volume (Metric Tons) and Forecast by Region, 2020–2030
Table 5: Global Frozen Fruits Market Value (US$ Mn) and Forecast by Nature, 2015–2019
Table 6: Global Frozen Fruits Market Value (US$ Mn) and Forecast by Nature, 2020–2030
Table 7: Global Frozen Fruits Market Volume (Metric Tons) and Forecast by Nature, 2015–2019
Table 8: Global Frozen Fruits Market Volume (Metric Tons) and Forecast by Nature, 2020–2030
Table 9: Global Frozen Fruits Market Value (US$ Mn) and Forecast by Fruit Type, 2015–2019
Table 10: Global Frozen Fruits Market Value (US$ Mn) and Forecast by Fruit Type, 2020–2030
Table 11: Global Frozen Fruits Market Volume (Metric Tons) and Forecast by Fruit Type, 2015–2019
Table 12: Global Frozen Fruits Market Volume (Metric Tons) and Forecast by Fruit Type, 2020–2030
Table 13: Global Frozen Fruits Market Value (US$ Mn) and Forecast by Form, 2015–2019
Table 14: Global Frozen Fruits Market Value (US$ Mn) and Forecast by Form, 2020–2030
Table 15: Global Frozen Fruits Market Volume (Metric Tons) and Forecast by Form, 2015–2019
Table 16: Global Frozen Fruits Market Volume (Metric Tons) and Forecast by Form, 2020–2030
Table 17: Global Frozen Fruits Market Value (US$ Mn) and Forecast by End Use, 2015–2019
Table 18: Global Frozen Fruits Market Value (US$ Mn) and Forecast by End Use, 2020–2030
Table 19: Global Frozen Fruits Market Volume (Metric Tons) and Forecast by End Use, 2015–2019
Table 20: Global Frozen Fruits Market Volume (Metric Tons) and Forecast by End Use, 2020–2030
Table 21: Global Frozen Fruits Market Value (US$ Mn) and Forecast by Distribution Channel, 2015–2019
Table 22: Global Frozen Fruits Market Value (US$ Mn) and Forecast by Distribution Channel, 2020–2030
Table 23: Global Frozen Fruits Market Volume (Metric Tons) and Forecast by Distribution Channel, 2015–2019
Table 24: Global Frozen Fruits Market Volume (Metric Tons) and Forecast by Distribution Channel, 2020–2030
Table 25: North America Frozen Fruits Market Value (US$ Mn) and Forecast by Region, 2015–2019
Table 26: North America Frozen Fruits Market Value (US$ Mn) and Forecast by Region, 2020–2030
Table 27: North America Frozen Fruits Market Volume (Metric Tons) and Forecast by Region, 2015–2019
Table 28: North America Frozen Fruits Market Volume (Metric Tons) and Forecast by Region, 2020–2030
Table 29: North America Frozen Fruits Market Value (US$ Mn) and Forecast by Nature, 2015–2019
Table 30: North America Frozen Fruits Market Value (US$ Mn) and Forecast by Nature, 2020–2030
Table 31: North America Frozen Fruits Market Volume (Metric Tons) and Forecast by Nature, 2015–2019
Table 32: North America Frozen Fruits Market Volume (Metric Tons) and Forecast by Nature, 2020–2030
Table 33: North America Frozen Fruits Market Value (US$ Mn) and Forecast by Fruit Type, 2015–2019
Table 34: North America Frozen Fruits Market Value (US$ Mn) and Forecast by Fruit Type, 2020–2030
Table 35: North America Frozen Fruits Market Volume (Metric Tons) and Forecast by Fruit Type, 2015–2019
Table 36: North America Frozen Fruits Market Volume (Metric Tons) and Forecast by Fruit Type, 2020–2030
Table 37: North America Frozen Fruits Market Value (US$ Mn) and Forecast by Form, 2015–2019
Table 38: North America Frozen Fruits Market Value (US$ Mn) and Forecast by Form, 2020–2030
Table 39: North America Frozen Fruits Market Volume (Metric Tons) and Forecast by Form, 2015–2019
Table 40: North America Frozen Fruits Market Volume (Metric Tons) and Forecast by Form, 2020–2030
Table 41: North America Frozen Fruits Market Value (US$ Mn) and Forecast by End Use, 2015–2019
Table 42: North America Frozen Fruits Market Value (US$ Mn) and Forecast by End Use, 2020–2030
Table 43: North America Frozen Fruits Market Volume (Metric Tons) and Forecast by End Use, 2015–2019
Table 44: North America Frozen Fruits Market Volume (Metric Tons) and Forecast by End Use, 2020–2030
Table 45: North America Frozen Fruits Market Value (US$ Mn) and Forecast by Distribution Channel, 2015–2019
Table 46: North America Frozen Fruits Market Value (US$ Mn) and Forecast by Distribution Channel, 2020–2030
Table 47: North America Frozen Fruits Market Volume (Metric Tons) and Forecast by Distribution Channel, 2015–2019
Table 48: North America Frozen Fruits Market Volume (Metric Tons) and Forecast by Distribution Channel, 2020–2030
Table 49: Latin America Frozen Fruits Market Value (US$ Mn) and Forecast by Region, 2015–2019
Table 50: Latin America Frozen Fruits Market Value (US$ Mn) and Forecast by Region, 2020–2030
Table 51: Latin America Frozen Fruits Market Volume (Metric Tons) and Forecast by Region, 2015–2019
Table 52: Latin America Frozen Fruits Market Volume (Metric Tons) and Forecast by Region, 2020–2030
Table 53: Latin America Frozen Fruits Market Value (US$ Mn) and Forecast by Nature, 2015–2019
Table 54: Latin America Frozen Fruits Market Value (US$ Mn) and Forecast by Nature, 2020–2030
Table 55: Latin America Frozen Fruits Market Volume (Metric Tons) and Forecast by Nature, 2015–2019
Table 56: Latin America Frozen Fruits Market Volume (Metric Tons) and Forecast by Nature, 2020–2030
Table 57: Latin America Frozen Fruits Market Value (US$ Mn) and Forecast by Fruit Type, 2015–2019
Table 58: Latin America Frozen Fruits Market Value (US$ Mn) and Forecast by Fruit Type, 2020–2030
Table 59: Latin America Frozen Fruits Market Volume (Metric Tons) and Forecast by Fruit Type, 2015–2019
Table 60: Latin America Frozen Fruits Market Volume (Metric Tons) and Forecast by Fruit Type, 2020–2030
Table 61: Latin America Frozen Fruits Market Value (US$ Mn) and Forecast by Form, 2015–2019
Table 62: Latin America Frozen Fruits Market Value (US$ Mn) and Forecast by Form, 2020–2030
Table 63: Latin America Frozen Fruits Market Volume (Metric Tons) and Forecast by Form, 2015–2019
Table 64: Latin America Frozen Fruits Market Volume (Metric Tons) and Forecast by Form, 2020–2030
Table 65: Latin America Frozen Fruits Market Value (US$ Mn) and Forecast by End Use, 2015–2019
Table 66: Latin America Frozen Fruits Market Value (US$ Mn) and Forecast by End Use, 2020–2030
Table 67: Latin America Frozen Fruits Market Volume (Metric Tons) and Forecast by End Use, 2015–2019
Table 68: Latin America Frozen Fruits Market Volume (Metric Tons) and Forecast by End Use, 2020–2030
Table 69: Latin America Frozen Fruits Market Value (US$ Mn) and Forecast by Distribution Channel, 2015–2019
Table 70: Latin America Frozen Fruits Market Value (US$ Mn) and Forecast by Distribution Channel, 2020–2030
Table 71: Latin America Frozen Fruits Market Volume (Metric Tons) and Forecast by Distribution Channel, 2015–2019
Table 72: Latin America Frozen Fruits Market Volume (Metric Tons) and Forecast by Distribution Channel, 2020–2030
Table 73: Europe Frozen Fruits Market Value (US$ Mn) and Forecast by Region, 2015–2019
Table 74: Europe Frozen Fruits Market Value (US$ Mn) and Forecast by Region, 2020–2030
Table 75: Europe Frozen Fruits Market Volume (Metric Tons) and Forecast by Region, 2015–2019
Table 76: Europe Frozen Fruits Market Volume (Metric Tons) and Forecast by Region, 2020–2030
Table 77: Europe Frozen Fruits Market Value (US$ Mn) and Forecast by Nature, 2015–2019
Table 78: Europe Frozen Fruits Market Value (US$ Mn) and Forecast by Nature, 2020–2030
Table 79: Europe Frozen Fruits Market Volume (Metric Tons) and Forecast by Nature, 2015–2019
Table 80: Europe Frozen Fruits Market Volume (Metric Tons) and Forecast by Nature, 2020–2030
Table 81: Europe Frozen Fruits Market Value (US$ Mn) and Forecast by Fruit Type, 2015–2019
Table 82: Europe Frozen Fruits Market Value (US$ Mn) and Forecast by Fruit Type, 2020–2030
Table 83: Europe Frozen Fruits Market Volume (Metric Tons) and Forecast by Fruit Type, 2015–2019
Table 84: Europe Frozen Fruits Market Volume (Metric Tons) and Forecast by Fruit Type, 2020–2030
Table 85: Europe Frozen Fruits Market Value (US$ Mn) and Forecast by Form, 2015–2019
Table 86: Europe Frozen Fruits Market Value (US$ Mn) and Forecast by Form, 2020–2030
Table 87: Europe Frozen Fruits Market Volume (Metric Tons) and Forecast by Form, 2015–2019
Table 88: Europe Frozen Fruits Market Volume (Metric Tons) and Forecast by Form, 2020–2030
Table 89: Europe Frozen Fruits Market Value (US$ Mn) and Forecast by End Use, 2015–2019
Table 90: Europe Frozen Fruits Market Value (US$ Mn) and Forecast by End Use, 2020–2030
Table 91: Europe Frozen Fruits Market Volume (Metric Tons) and Forecast by End Use, 2015–2019
Table 92: Europe Frozen Fruits Market Volume (Metric Tons) and Forecast by End Use, 2020–2030
Table 93: Europe Frozen Fruits Market Value (US$ Mn) and Forecast by Distribution Channel, 2015–2019
Table 94: Europe Frozen Fruits Market Value (US$ Mn) and Forecast by Distribution Channel, 2020–2030
Table 95: Europe Frozen Fruits Market Volume (Metric Tons) and Forecast by Distribution Channel, 2015–2019
Table 96: Europe Frozen Fruits Market Volume (Metric Tons) and Forecast by Distribution Channel, 2020–2030
Table 97: Asia Pacific Excluding Japan Frozen Fruits Market Value (US$ Mn) and Forecast by Region, 2015–2019
Table 98: Asia Pacific Excluding Japan Frozen Fruits Market Value (US$ Mn) and Forecast by Region, 2020–2030
Table 99: Asia Pacific Excluding Japan Frozen Fruits Market Volume (Metric Tons) and Forecast by Region, 2015–2019
Table 100: Asia Pacific Excluding Japan Frozen Fruits Market Volume (Metric Tons) and Forecast by Region, 2020–2030
Table 101: Asia Pacific Excluding Japan Frozen Fruits Market Value (US$ Mn) and Forecast by Nature, 2015–2019
Table 102: Asia Pacific Excluding Japan Frozen Fruits Market Value (US$ Mn) and Forecast by Nature, 2020–2030
Table 103: Asia Pacific Excluding Japan Frozen Fruits Market Volume (Metric Tons) and Forecast by Nature, 2015–2019
Table 104: Asia Pacific Excluding Japan Frozen Fruits Market Volume (Metric Tons) and Forecast by Nature, 2020–2030
Table 105: Asia Pacific Excluding Japan Frozen Fruits Market Value (US$ Mn) and Forecast by Fruit Type, 2015–2019
Table 106: Asia Pacific Excluding Japan Frozen Fruits Market Value (US$ Mn) and Forecast by Fruit Type, 2020–2030
Table 107: Asia Pacific Excluding Japan Frozen Fruits Market Volume (Metric Tons) and Forecast by Fruit Type, 2015–2019
Table 108: Asia Pacific Excluding Japan Frozen Fruits Market Volume (Metric Tons) and Forecast by Fruit Type, 2020–2030
Table 109: Asia Pacific Excluding Japan Frozen Fruits Market Value (US$ Mn) and Forecast by Form, 2015–2019
Table 110: Asia Pacific Excluding Japan Frozen Fruits Market Value (US$ Mn) and Forecast by Form, 2020–2030
Table 111: Asia Pacific Excluding Japan Frozen Fruits Market Volume (Metric Tons) and Forecast by Form, 2015–2019
Table 112: Asia Pacific Excluding Japan Frozen Fruits Market Volume (Metric Tons) and Forecast by Form, 2020–2030
Table 113: Asia Pacific Excluding Japan Frozen Fruits Market Value (US$ Mn) and Forecast by End Use, 2015–2019
Table 114: Asia Pacific Excluding Japan Frozen Fruits Market Value (US$ Mn) and Forecast by End Use, 2020–2030
Table 115: Asia Pacific Excluding Japan Frozen Fruits Market Volume (Metric Tons) and Forecast by End Use, 2015–2019
Table 116: Asia Pacific Excluding Japan Frozen Fruits Market Volume (Metric Tons) and Forecast by End Use, 2020–2030
Table 117: Asia Pacific Excluding Japan Frozen Fruits Market Value (US$ Mn) and Forecast by Distribution Channel, 2015–2019
Table 118: Asia Pacific Excluding Japan Frozen Fruits Market Value (US$ Mn) and Forecast by Distribution Channel, 2020–2030
Table 119: Asia Pacific Excluding Japan Frozen Fruits Market Volume (Metric Tons) and Forecast by Distribution Channel, 2015–2019
Table 120: Asia Pacific Excluding Japan Frozen Fruits Market Volume (Metric Tons) and Forecast by Distribution Channel, 2020–2030
Table 121: Japan Frozen Fruits Market Value (US$ Mn) and Forecast by Region, 2015–2019
Table 122: Japan Frozen Fruits Market Value (US$ Mn) and Forecast by Region, 2020–2030
Table 123: Japan Frozen Fruits Market Volume (Metric Tons) and Forecast by Region, 2015–2019
Table 124: Japan Frozen Fruits Market Volume (Metric Tons) and Forecast by Region, 2020–2030
Table 125: Japan Frozen Fruits Market Value (US$ Mn) and Forecast by Nature, 2015–2019
Table 126: Japan Frozen Fruits Market Value (US$ Mn) and Forecast by Nature, 2020–2030
Table 127: Japan Frozen Fruits Market Volume (Metric Tons) and Forecast by Nature, 2015–2019
Table 128: Japan Frozen Fruits Market Volume (Metric Tons) and Forecast by Nature, 2020–2030
Table 129: Japan Frozen Fruits Market Value (US$ Mn) and Forecast by Fruit Type, 2015–2019
Table 130: Japan Frozen Fruits Market Value (US$ Mn) and Forecast by Fruit Type, 2020–2030
Table 131: Japan Frozen Fruits Market Volume (Metric Tons) and Forecast by Fruit Type, 2015–2019
Table 132: Japan Frozen Fruits Market Volume (Metric Tons) and Forecast by Fruit Type, 2020–2030
Table 133: Japan Frozen Fruits Market Value (US$ Mn) and Forecast by Form, 2015–2019
Table 134: Japan Frozen Fruits Market Value (US$ Mn) and Forecast by Form, 2020–2030
Table 135: Japan Frozen Fruits Market Volume (Metric Tons) and Forecast by Form, 2015–2019
Table 136: Japan Frozen Fruits Market Volume (Metric Tons) and Forecast by Form, 2020–2030
Table 137: Japan Frozen Fruits Market Value (US$ Mn) and Forecast by End Use, 2015–2019
Table 138: Japan Frozen Fruits Market Value (US$ Mn) and Forecast by End Use, 2020–2030
Table 139: Japan Frozen Fruits Market Volume (Metric Tons) and Forecast by End Use, 2015–2019
Table 140: Japan Frozen Fruits Market Volume (Metric Tons) and Forecast by End Use, 2020–2030
Table 141: Japan Frozen Fruits Market Value (US$ Mn) and Forecast by Distribution Channel, 2015–2019
Table 142: Japan Frozen Fruits Market Value (US$ Mn) and Forecast by Distribution Channel, 2020–2030
Table 143: Japan Frozen Fruits Market Volume (Metric Tons) and Forecast by Distribution Channel, 2015–2019
Table 144: Japan Frozen Fruits Market Volume (Metric Tons) and Forecast by Distribution Channel, 2020–2030
Table 145: Middle East & Africa Frozen Fruits Market Value (US$ Mn) and Forecast by Region, 2015–2019
Table 146: Middle East & Africa Frozen Fruits Market Value (US$ Mn) and Forecast by Region, 2020–2030
Table 147: Middle East & Africa Frozen Fruits Market Volume (Metric Tons) and Forecast by Region, 2015–2019
Table 148: Middle East & Africa Frozen Fruits Market Volume (Metric Tons) and Forecast by Region, 2020–2030
Table 149: Middle East & Africa Frozen Fruits Market Value (US$ Mn) and Forecast by Nature, 2015–2019
Table 150: Middle East & Africa Frozen Fruits Market Value (US$ Mn) and Forecast by Nature, 2020–2030
Table 151: Middle East & Africa Frozen Fruits Market Volume (Metric Tons) and Forecast by Nature, 2015–2019
Table 152: Middle East & Africa Frozen Fruits Market Volume (Metric Tons) and Forecast by Nature, 2020–2030
Table 153: Middle East & Africa Frozen Fruits Market Value (US$ Mn) and Forecast by Fruit Type, 2015–2019
Table 154: Middle East & Africa Frozen Fruits Market Value (US$ Mn) and Forecast by Fruit Type, 2020–2030
Table 155: Middle East & Africa Frozen Fruits Market Volume (Metric Tons) and Forecast by Fruit Type, 2015–2019
Table 156: Middle East & Africa Frozen Fruits Market Volume (Metric Tons) and Forecast by Fruit Type, 2020–2030
Table 157: Middle East & Africa Frozen Fruits Market Value (US$ Mn) and Forecast by Form, 2015–2019
Table 158: Middle East & Africa Frozen Fruits Market Value (US$ Mn) and Forecast by Form, 2020–2030
Table 159: Middle East & Africa Frozen Fruits Market Volume (Metric Tons) and Forecast by Form, 2015–2019
Table 160: Middle East & Africa Frozen Fruits Market Volume (Metric Tons) and Forecast by Form, 2020–2030
Table 161: Middle East & Africa Frozen Fruits Market Value (US$ Mn) and Forecast by End Use, 2015–2019
Table 162: Middle East & Africa Frozen Fruits Market Value (US$ Mn) and Forecast by End Use, 2020–2030
Table 163: Middle East & Africa Frozen Fruits Market Volume (Metric Tons) and Forecast by End Use, 2015–2019
Table 164: Middle East & Africa Frozen Fruits Market Volume (Metric Tons) and Forecast by End Use, 2020–2030
Table 165: Middle East & Africa Frozen Fruits Market Value (US$ Mn) and Forecast by Distribution Channel, 2015–2019
Table 166: Middle East & Africa Frozen Fruits Market Value (US$ Mn) and Forecast by Distribution Channel, 2020–2030
Table 167: Middle East & Africa Frozen Fruits Market Volume (Metric Tons) and Forecast by Distribution Channel, 2015–2019
Table 168: Middle East & Africa Frozen Fruits Market Volume (Metric Tons) and Forecast by Distribution Channel, 2020–2030
Table 169: Oceania Frozen Fruits Market Value (US$ Mn) and Forecast by Region, 2015–2019
Table 170: Oceania Frozen Fruits Market Value (US$ Mn) and Forecast by Region, 2020–2030
Table 171: Oceania Frozen Fruits Market Volume (Metric Tons) and Forecast by Region, 2015–2019
Table 172: Oceania Frozen Fruits Market Volume (Metric Tons) and Forecast by Region, 2020–2030
Table 173: Oceania Frozen Fruits Market Value (US$ Mn) and Forecast by Nature, 2015–2019
Table 174: Oceania Frozen Fruits Market Value (US$ Mn) and Forecast by Nature, 2020–2030
Table 175: Oceania Frozen Fruits Market Volume (Metric Tons) and Forecast by Nature, 2015–2019
Table 176: Oceania Frozen Fruits Market Volume (Metric Tons) and Forecast by Nature, 2020–2030
Table 177: Oceania Frozen Fruits Market Value (US$ Mn) and Forecast by Fruit Type, 2015–2019
Table 178: Oceania Frozen Fruits Market Value (US$ Mn) and Forecast by Fruit Type, 2020–2030
Table 179: Oceania Frozen Fruits Market Volume (Metric Tons) and Forecast by Fruit Type, 2015–2019
Table 180: Oceania Frozen Fruits Market Volume (Metric Tons) and Forecast by Fruit Type, 2020–2030
Table 181: Oceania Frozen Fruits Market Value (US$ Mn) and Forecast by Form, 2015–2019
Table 182: Oceania Frozen Fruits Market Value (US$ Mn) and Forecast by Form, 2020–2030
Table 183: Oceania Frozen Fruits Market Volume (Metric Tons) and Forecast by Form, 2015–2019
Table 184: Oceania Frozen Fruits Market Volume (Metric Tons) and Forecast by Form, 2020–2030
Table 185: Oceania Frozen Fruits Market Value (US$ Mn) and Forecast by End Use, 2015–2019
Table 186: Oceania Frozen Fruits Market Value (US$ Mn) and Forecast by End Use, 2020–2030
Table 187: Oceania Frozen Fruits Market Volume (Metric Tons) and Forecast by End Use, 2015–2019
Table 188: Oceania Frozen Fruits Market Volume (Metric Tons) and Forecast by End Use, 2020–2030
Table 189: Oceania Frozen Fruits Market Value (US$ Mn) and Forecast by Distribution Channel, 2015–2019
Table 190: Oceania Frozen Fruits Market Value (US$ Mn) and Forecast by Distribution Channel, 2020–2030
Table 191: Oceania Frozen Fruits Market Volume (Metric Tons) and Forecast by Distribution Channel, 2015–2019
Table 192: Oceania Frozen Fruits Market Volume (Metric Tons) and Forecast by Distribution Channel, 2020–2030
List of Figures
Figure 1: Global Frozen Fruits Market Value (US$ Mn) and Volume (MT) Forecast, 2020–2030
Figure 2: Global Frozen Fruits Market Absolute $ Opportunity (US$ Mn), 2020?2030
Figure 3: Global Frozen Fruits Market Value (US$ Mn) and % Growth by Region, 2020 & 2030
Figure 4: Global Frozen Fruits Market Y-o-Y Growth Rate by Region, 2020 - 2030
Figure 5: Global Frozen Fruits Market Value (US$ Mn) and % Growth by Nature, 2020 & 2030
Figure 6: Global Frozen Fruits Market Y-o-Y Growth Rate by Nature, 2020 - 2030
Figure 7: Global Frozen Fruits Market Value (US$ Mn) and % Growth by Fruit Type, 2020 & 2030
Figure 8: Global Frozen Fruits Market Y-o-Y Growth Rate by Fruit Type, 2020 - 2030
Figure 9: Global Frozen Fruits Market Value (US$ Mn) and % Growth by Form, 2020 & 2030
Figure 10: Global Frozen Fruits Market Y-o-Y Growth Rate by Form, 2020 - 2030
Figure 11: Global Frozen Fruits Market Value (US$ Mn) and % Growth by End Use, 2020 & 2030
Figure 12: Global Frozen Fruits Market Y-o-Y Growth Rate by End Use, 2020 - 2030
Figure 13: Global Frozen Fruits Market Value (US$ Mn) and % Growth by Distribution Channel, 2020 & 2030
Figure 14: Global Frozen Fruits Market Y-o-Y Growth Rate by Distribution Channel, 2020 - 2030
Figure 15: Global Frozen Fruits Market Attractiveness Analysis by Region, 2020 - 2030
Figure 16: Global Frozen Fruits Market Attractiveness Analysis by Nature, 2020 - 2030
Figure 17: Global Frozen Fruits Market Attractiveness Analysis by Fruit Type, 2020 - 2030
Figure 18: Global Frozen Fruits Market Attractiveness Analysis by Form, 2020 - 2030
Figure 19: Global Frozen Fruits Market Attractiveness Analysis by End Use, 2020 - 2030
Figure 20: Global Frozen Fruits Market Attractiveness Analysis by Distribution Channel, 2020 - 2030
Figure 21: North America Frozen Fruits Market Value (US$ Mn) and Volume (MT) Forecast, 2020–2030
Figure 22: North America Frozen Fruits Market Absolute $ Opportunity (US$ Mn), 2020–2030
Figure 23: North America Frozen Fruits Market Value (US$ Mn) and % Growth by Region, 2020 & 2030
Figure 24: North America Frozen Fruits Market Y-o-Y Growth Rate by Region, 2020 - 2030
Figure 25: North America Frozen Fruits Market Value (US$ Mn) and % Growth by Nature, 2020 & 2030
Figure 26: North America Frozen Fruits Market Y-o-Y Growth Rate by Nature, 2020 - 2030
Figure 27: North America Frozen Fruits Market Value (US$ Mn) and % Growth by Fruit Type, 2020 & 2030
Figure 28: North America Frozen Fruits Market Y-o-Y Growth Rate by Fruit Type, 2020 - 2030
Figure 29: North America Frozen Fruits Market Value (US$ Mn) and % Growth by Form, 2020 & 2030
Figure 30: North America Frozen Fruits Market Y-o-Y Growth Rate by Form, 2020 - 2030
Figure 31: North America Frozen Fruits Market Value (US$ Mn) and % Growth by End Use, 2020 & 2030
Figure 32: North America Frozen Fruits Market Y-o-Y Growth Rate by End Use, 2020 - 2030
Figure 33: North America Frozen Fruits Market Value (US$ Mn) and % Growth by Distribution Channel, 2020 & 2030
Figure 34: North America Frozen Fruits Market Y-o-Y Growth Rate by Distribution Channel, 2020 - 2030
Figure 35: North America Frozen Fruits Market Attractiveness Analysis by Region, 2020 - 2030
Figure 36: North America Frozen Fruits Market Attractiveness Analysis by Nature, 2020 - 2030
Figure 37: North America Frozen Fruits Market Attractiveness Analysis by Fruit Type, 2020 - 2030
Figure 38: North America Frozen Fruits Market Attractiveness Analysis by Form, 2020 - 2030
Figure 39: North America Frozen Fruits Market Attractiveness Analysis by End Use, 2020 - 2030
Figure 40: North America Frozen Fruits Market Attractiveness Analysis by Distribution Channel, 2020 - 2030
Figure 41: Latin America Frozen Fruits Market Value (US$ Mn) and Volume (MT) Forecast, 2020–2030
Figure 42: Latin America Frozen Fruits Market Absolute $ Opportunity (US$ Mn), 2020–2030
Figure 43: Latin America Frozen Fruits Market Value (US$ Mn) and % Growth by Region, 2020 & 2030
Figure 44: Latin America Frozen Fruits Market Y-o-Y Growth Rate by Region, 2020 - 2030
Figure 45: Latin America Frozen Fruits Market Value (US$ Mn) and % Growth by Nature, 2020 & 2030
Figure 46: Latin America Frozen Fruits Market Y-o-Y Growth Rate by Nature, 2020 - 2030
Figure 47: Latin America Frozen Fruits Market Value (US$ Mn) and % Growth by Fruit Type, 2020 & 2030
Figure 48: Latin America Frozen Fruits Market Y-o-Y Growth Rate by Fruit Type, 2020 - 2030
Figure 49: Latin America Frozen Fruits Market Value (US$ Mn) and % Growth by Form, 2020 & 2030
Figure 50: Latin America Frozen Fruits Market Y-o-Y Growth Rate by Form, 2020 - 2030
Figure 51: Latin America Frozen Fruits Market Value (US$ Mn) and % Growth by End Use, 2020 & 2030
Figure 52: Latin America Frozen Fruits Market Y-o-Y Growth Rate by End Use, 2020 - 2030
Figure 53: Latin America Frozen Fruits Market Value (US$ Mn) and % Growth by Distribution Channel, 2020 & 2030
Figure 54: Latin America Frozen Fruits Market Y-o-Y Growth Rate by Distribution Channel, 2020 - 2030
Figure 55: Latin America Frozen Fruits Market Attractiveness Analysis by Region, 2020 - 2030
Figure 56: Latin America Frozen Fruits Market Attractiveness Analysis by Nature, 2020 - 2030
Figure 57: Latin America Frozen Fruits Market Attractiveness Analysis by Fruit Type, 2020 - 2030
Figure 58: Latin America Frozen Fruits Market Attractiveness Analysis by Form, 2020 - 2030
Figure 59: Latin America Frozen Fruits Market Attractiveness Analysis by End Use, 2020 - 2030
Figure 60: Latin America Frozen Fruits Market Attractiveness Analysis by Distribution Channel, 2020 - 2030
Figure 61: Europe Frozen Fruits Market Value (US$ Mn) and Volume (MT) Forecast, 2020–2030
Figure 62: Europe Frozen Fruits Market Absolute $ Opportunity (US$ Mn), 2020–2030
Figure 63: Europe Frozen Fruits Market Value (US$ Mn) and % Growth by Region, 2020 & 2030
Figure 64: Europe Frozen Fruits Market Y-o-Y Growth Rate by Region, 2020 - 2030
Figure 65: Europe Frozen Fruits Market Value (US$ Mn) and % Growth by Nature, 2020 & 2030
Figure 66: Europe Frozen Fruits Market Y-o-Y Growth Rate by Nature, 2020 - 2030
Figure 67: Europe Frozen Fruits Market Value (US$ Mn) and % Growth by Fruit Type, 2020 & 2030
Figure 68: Europe Frozen Fruits Market Y-o-Y Growth Rate by Fruit Type, 2020 - 2030
Figure 69: Europe Frozen Fruits Market Value (US$ Mn) and % Growth by Form, 2020 & 2030
Figure 70: Europe Frozen Fruits Market Y-o-Y Growth Rate by Form, 2020 - 2030
Figure 71: Europe Frozen Fruits Market Value (US$ Mn) and % Growth by End Use, 2020 & 2030
Figure 72: Europe Frozen Fruits Market Y-o-Y Growth Rate by End Use, 2020 - 2030
Figure 73: Europe Frozen Fruits Market Value (US$ Mn) and % Growth by Distribution Channel, 2020 & 2030
Figure 74: Europe Frozen Fruits Market Y-o-Y Growth Rate by Distribution Channel, 2020 - 2030
Figure 75: Europe Frozen Fruits Market Attractiveness Analysis by Region, 2020 - 2030
Figure 76: Europe Frozen Fruits Market Attractiveness Analysis by Nature, 2020 - 2030
Figure 77: Europe Frozen Fruits Market Attractiveness Analysis by Fruit Type, 2020 - 2030
Figure 78: Europe Frozen Fruits Market Attractiveness Analysis by Form, 2020 - 2030
Figure 79: Europe Frozen Fruits Market Attractiveness Analysis by End Use, 2020 - 2030
Figure 80: Europe Frozen Fruits Market Attractiveness Analysis by Distribution Channel, 2020 - 2030
Figure 81: Asia Pacific Excluding Japan Frozen Fruits Market Value (US$ Mn) and Volume (MT) Forecast, 2020–2030
Figure 82: Asia Pacific Excluding Japan Frozen Fruits Market Absolute $ Opportunity (US$ Mn), 2020–2030
Figure 83: Asia Pacific Excluding Japan Frozen Fruits Market Value (US$ Mn) and % Growth by Region, 2020 & 2030
Figure 84: Asia Pacific Excluding Japan Frozen Fruits Market Y-o-Y Growth Rate by Region, 2020 - 2030
Figure 85: Asia Pacific Excluding Japan Frozen Fruits Market Value (US$ Mn) and % Growth by Nature, 2020 & 2030
Figure 86: Asia Pacific Excluding Japan Frozen Fruits Market Y-o-Y Growth Rate by Nature, 2020 - 2030
Figure 87: Asia Pacific Excluding Japan Frozen Fruits Market Value (US$ Mn) and % Growth by Fruit Type, 2020 & 2030
Figure 88: Asia Pacific Excluding Japan Frozen Fruits Market Y-o-Y Growth Rate by Fruit Type, 2020 - 2030
Figure 89: Asia Pacific Excluding Japan Frozen Fruits Market Value (US$ Mn) and % Growth by Form, 2020 & 2030
Figure 90: Asia Pacific Excluding Japan Frozen Fruits Market Y-o-Y Growth Rate by Form, 2020 - 2030
Figure 91: Asia Pacific Excluding Japan Frozen Fruits Market Value (US$ Mn) and % Growth by End Use, 2020 & 2030
Figure 92: Asia Pacific Excluding Japan Frozen Fruits Market Y-o-Y Growth Rate by End Use, 2020 - 2030
Figure 93: Asia Pacific Excluding Japan Frozen Fruits Market Value (US$ Mn) and % Growth by Distribution Channel, 2020 & 2030
Figure 94: Asia Pacific Excluding Japan Frozen Fruits Market Y-o-Y Growth Rate by Distribution Channel, 2020 - 2030
Figure 95: Asia Pacific Excluding Japan Frozen Fruits Market Attractiveness Analysis by Region, 2020 - 2030
Figure 96: Asia Pacific Excluding Japan Frozen Fruits Market Attractiveness Analysis by Nature, 2020 - 2030
Figure 97: Asia Pacific Excluding Japan Frozen Fruits Market Attractiveness Analysis by Fruit Type, 2020 - 2030
Figure 98: Asia Pacific Excluding Japan Frozen Fruits Market Attractiveness Analysis by Form, 2020 - 2030
Figure 99: Asia Pacific Excluding Japan Frozen Fruits Market Attractiveness Analysis by End Use, 2020 - 2030
Figure 100: Asia Pacific Excluding Japan Frozen Fruits Market Attractiveness Analysis by Distribution Channel, 2020 - 2030
Figure 101: Japan Pacific Excluding Japan Frozen Fruits Market Value (US$ Mn) and Volume (MT) Forecast, 2020–2030
Figure 102: Japan Pacific Excluding Japan Frozen Fruits Market Absolute $ Opportunity (US$ Mn), 2020–2030
Figure 103: Japan Pacific Excluding Japan Frozen Fruits Market Value (US$ Mn) and % Growth by Region, 2020 & 2030
Figure 104: Japan Pacific Excluding Japan Frozen Fruits Market Y-o-Y Growth Rate by Region, 2020 - 2030
Figure 105: Japan Pacific Excluding Japan Frozen Fruits Market Value (US$ Mn) and % Growth by Nature, 2020 & 2030
Figure 106: Japan Pacific Excluding Japan Frozen Fruits Market Y-o-Y Growth Rate by Nature, 2020 - 2030
Figure 107: Japan Pacific Excluding Japan Frozen Fruits Market Value (US$ Mn) and % Growth by Fruit Type, 2020 & 2030
Figure 108: Japan Pacific Excluding Japan Frozen Fruits Market Y-o-Y Growth Rate by Fruit Type, 2020 - 2030
Figure 109: Japan Pacific Excluding Japan Frozen Fruits Market Value (US$ Mn) and % Growth by Form, 2020 & 2030
Figure 110: Japan Pacific Excluding Japan Frozen Fruits Market Y-o-Y Growth Rate by Form, 2020 - 2030
Figure 111: Japan Pacific Excluding Japan Frozen Fruits Market Value (US$ Mn) and % Growth by End Use, 2020 & 2030
Figure 112: Japan Pacific Excluding Japan Frozen Fruits Market Y-o-Y Growth Rate by End Use, 2020 - 2030
Figure 113: Japan Pacific Excluding Japan Frozen Fruits Market Value (US$ Mn) and % Growth by Distribution Channel, 2020 & 2030
Figure 114: Japan Pacific Excluding Japan Frozen Fruits Market Y-o-Y Growth Rate by Distribution Channel, 2020 - 2030
Figure 115: Japan Pacific Excluding Japan Frozen Fruits Market Attractiveness Analysis by Region, 2020 - 2030
Figure 116: Japan Pacific Excluding Japan Frozen Fruits Market Attractiveness Analysis by Nature, 2020 - 2030
Figure 117: Japan Pacific Excluding Japan Frozen Fruits Market Attractiveness Analysis by Fruit Type, 2020 - 2030
Figure 118: Japan Pacific Excluding Japan Frozen Fruits Market Attractiveness Analysis by Form, 2020 - 2030
Figure 119: Japan Pacific Excluding Japan Frozen Fruits Market Attractiveness Analysis by End Use, 2020 - 2030
Figure 120: Japan Pacific Excluding Japan Frozen Fruits Market Attractiveness Analysis by Distribution Channel, 2020 - 2030
Figure 121: Middle East & Africa Frozen Fruits Market Value (US$ Mn) and Volume (MT) Forecast, 2020–2030
Figure 122: Middle East & Africa Frozen Fruits Market Absolute $ Opportunity (US$ Mn), 2020–2030
Figure 123: Middle East & Africa Frozen Fruits Market Value (US$ Mn) and % Growth by Region, 2020 & 2030
Figure 124: Middle East & Africa Frozen Fruits Market Y-o-Y Growth Rate by Region, 2020 - 2030
Figure 125: Middle East & Africa Frozen Fruits Market Value (US$ Mn) and % Growth by Nature, 2020 & 2030
Figure 126: Middle East & Africa Frozen Fruits Market Y-o-Y Growth Rate by Nature, 2020 - 2030
Figure 127: Middle East & Africa Frozen Fruits Market Value (US$ Mn) and % Growth by Fruit Type, 2020 & 2030
Figure 128: Middle East & Africa Frozen Fruits Market Y-o-Y Growth Rate by Fruit Type, 2020 - 2030
Figure 129: Middle East & Africa Frozen Fruits Market Value (US$ Mn) and % Growth by Form, 2020 & 2030
Figure 130: Middle East & Africa Frozen Fruits Market Y-o-Y Growth Rate by Form, 2020 - 2030
Figure 131: Middle East & Africa Frozen Fruits Market Value (US$ Mn) and % Growth by End Use, 2020 & 2030
Figure 132: Middle East & Africa Frozen Fruits Market Y-o-Y Growth Rate by End Use, 2020 - 2030
Figure 133: Middle East & Africa Frozen Fruits Market Value (US$ Mn) and % Growth by Distribution Channel, 2020 & 2030
Figure 134: Middle East & Africa Frozen Fruits Market Y-o-Y Growth Rate by Distribution Channel, 2020 - 2030
Figure 135: Middle East & Africa Frozen Fruits Market Attractiveness Analysis by Region, 2020 - 2030
Figure 136: Middle East & Africa Frozen Fruits Market Attractiveness Analysis by Nature, 2020 - 2030
Figure 137: Middle East & Africa Frozen Fruits Market Attractiveness Analysis by Fruit Type, 2020 - 2030
Figure 138: Middle East & Africa Frozen Fruits Market Attractiveness Analysis by Form, 2020 - 2030
Figure 139: Middle East & Africa Frozen Fruits Market Attractiveness Analysis by End Use, 2020 - 2030
Figure 140: Middle East & Africa Frozen Fruits Market Attractiveness Analysis by Distribution Channel, 2020 - 2030
Figure 141: Oceania Frozen Fruits Market Value (US$ Mn) and Volume (MT) Forecast, 2020–2030
Figure 142: Oceania Frozen Fruits Market Absolute $ Opportunity (US$ Mn), 2020–2030
Figure 143: Oceania Frozen Fruits Market Value (US$ Mn) and % Growth by Region, 2020 & 2030
Figure 144: Oceania Frozen Fruits Market Y-o-Y Growth Rate by Region, 2020 - 2030
Figure 145: Oceania Frozen Fruits Market Value (US$ Mn) and % Growth by Nature, 2020 & 2030
Figure 146: Oceania Frozen Fruits Market Y-o-Y Growth Rate by Nature, 2020 - 2030
Figure 147: Oceania Frozen Fruits Market Value (US$ Mn) and % Growth by Fruit Type, 2020 & 2030
Figure 148: Oceania Frozen Fruits Market Y-o-Y Growth Rate by Fruit Type, 2020 - 2030
Figure 149: Oceania Frozen Fruits Market Value (US$ Mn) and % Growth by Form, 2020 & 2030
Figure 150: Oceania Frozen Fruits Market Y-o-Y Growth Rate by Form, 2020 - 2030
Figure 151: Oceania Frozen Fruits Market Value (US$ Mn) and % Growth by End Use, 2020 & 2030
Figure 152: Oceania Frozen Fruits Market Y-o-Y Growth Rate by End Use, 2020 - 2030
Figure 153: Oceania Frozen Fruits Market Value (US$ Mn) and % Growth by Distribution Channel, 2020 & 2030
Figure 154: Oceania Frozen Fruits Market Y-o-Y Growth Rate by Distribution Channel, 2020 - 2030
Figure 155: Oceania Frozen Fruits Market Attractiveness Analysis by Region, 2020 - 2030
Figure 156: Oceania Frozen Fruits Market Attractiveness Analysis by Nature, 2020 - 2030
Figure 157: Oceania Frozen Fruits Market Attractiveness Analysis by Fruit Type, 2020 - 2030
Figure 158: Oceania Frozen Fruits Market Attractiveness Analysis by Form, 2020 - 2030
Figure 159: Oceania Frozen Fruits Market Attractiveness Analysis by End Use, 2020 - 2030
Figure 160: Oceania Frozen Fruits Market Attractiveness Analysis by Distribution Channel, 2020 - 2030
Copyright © Transparency Market Research, Inc. All Rights reserved
Trust Online

Frozen Fruits Market
