Exploration and Production (E&P) Software Market - Snapshot
Exploration & Production (E&P) is an upstream segment of the oil & gas industry which plays an important role in the process of locating, testing, and drilling of oil & gas. E&P software is an integrated solution which is completely dedicated to managing every process from exploration to production. With recent advancements in digital technology, the deployment of E&P software by oil & gas companies has increased to a great extent. The global E&P software market is currently driven by growing investment in the oil & gas sector, rising exploration of unconventional gas resources, and technological advancements. Fluctuating prices of oil & gas worldwide has been identified as the major inhibitor to the market’s growth.
The global exploration & production (E&P) software market has been segmented on the basis of deployment type, operation type, software type, and geography. On the basis of deployment type, the market is segmented into on-premise software and cloud-based software. Cloud-based E&P are a type of system where information regarding exploration and production are present on the cloud. Cloud-based technology is most preferred by small businesses. Due to rising level of digitization and rising awareness of cloud computing technologies, cloud-based E&P software is expected to show significant growth rate during the forecast period. In terms of operation type, the market is segmented into on-shore and off-shore. On-shore exploration & production software refers to the implementation of software in the development of oil fields, gas deposits, and geothermal energy on land. It could be conventional or unconventional. In terms of operation type, the global E&P software market was led by on-shore operation type. However, the demand is projected to shift toward off-shore operations due to the rising offshore activities. In terms of software type, the market is segmented into risk management mapping, seismic amplitude analysis, portfolio aggregation, performance tracking, navigation system, resource valuation, reservoir characterization, reservoir simulation, drilling, and production. Portfolio aggregation software is used to combine oil and gas project and asset level data from various external sources with an aim to make organized and appropriate decisions at the portfolio level and determine optimal allocation of resources. The production software has been identified as the fastest growing segment during the forecast period, due to upward trend in production in the upstream oil & gas sector around the world.
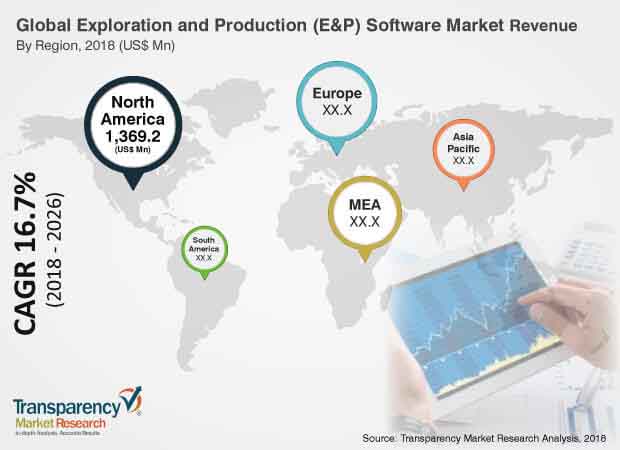
In terms of region, North America led the exploration & production (E&P) software market in the year 2017 and is expected to remain dominant throughout the forecast period from 2018 to 2026.
The North American E&P software market is mainly driven by several new technological advancements in the E&P sector. The growth of the Europe E&P software market is mainly supported by growing number of initiatives by governments to support the oil & gas industry in Europe. The Asia Pacific E&P software market is driven by growing demand for liquid hydrocarbons in the region.
The global exploration & production (E&P) software market is largely driven by innovative digital solutions. For instance, in 2017, GE Oil & Gas was committed to introducing the next industrial era in the oil & gas sector. In its several labs and factories, the company is constantly trying to push the boundaries of technology to analyze and resolve today’s toughest commercial & operational challenges. In order to fulfil its strategy, the company has been seen making several acquisitions and forging partnerships with some of the leading service providers of the oil & gas industry.
Key players profiled in the global exploration & production (E&P) software market include Schlumberger Limited, ION Geophysical Corporation, Exprodat Consulting Ltd. (Now Part of Getech Group Plc), Halliburton Company, Baker Hughes Incorporated, IHS Inc., Emerson Electric Co., Computer Modelling Group Ltd., Kongsberg Gruppen ASA, GE Oil & Gas, Pason Systems Corp., Paradigm B.V., ETL Solutions Ltd., Ikon Science Limited, GEPlan Consulting Srl, Interactive Network Technologies, Inc., Peloton, Petroleum Experts Ltd., RockFlow Dynamics, LLC, OVS Group LLC, P2 Energy Solutions (Formerly Merrick Systems), Petrolink Services, Inc., eDrilling AS, TDE Group GmbH, and Etech International, Inc.
1. Preface
1.1. Market Definition and Scope
1.2. Market Segmentation
1.3. Key Research Objectives
1.4. Research Highlights
2. Assumptions and Research Methodology
3. Executive Summary : Global Exploration and Production (E&P) Software Market
4. Market Overview
4.1. Introduction
4.2. Market Dynamics
4.2.1. Drivers
4.2.2. Restraints
4.2.3. Opportunities
4.3. Key Market Indicators
4.3.1. Global Production in Oil & Gas Industry
4.4. Global Exploration and Production (E&P) Software Market Analysis and Forecast, 2016-2026
4.4.1. Market Revenue Projections (US$ Mn)
4.5. Porter’s Five Forces Analysis
4.6. Ecosystem Analysis
4.7. Market Outlook
5. Global Exploration and Production (E&P) Software Market Analysis and Forecast, by Deployment Type
5.1. Overview & Definitions
5.2. Global Exploration and Production (E&P) Software Market Size (US$ Mn) Forecast, by Deployment Type, 2016-2026
5.2.1. On-premise
5.2.2. Cloud
5.3. Market Attractiveness by Deployment Type
6. Global Exploration and Production (E&P) Software Market Analysis and Forecast, by Operation Type
6.1. Overview& Definitions
6.2. Global Exploration and Production (E&P) Software Market Size (US$ Mn) Forecast, by Operation Type, 2016-2026
6.2.1. On-shore
6.2.2. Off-shore
6.3. Market Attractiveness by Operation Type
7. Global Exploration and Production (E&P) Software Market Analysis and Forecast, by Software Type
7.1. Overview & Definitions
7.2. Global Exploration and Production (E&P) Software Market Size (US$ Mn) Forecast, by Software Type, 2016-2026
7.2.1. Risk Management Mapping
7.2.2. Seismic Amplitude Analysis
7.2.3. Portfolio Aggregation
7.2.4. Performance Tracking
7.2.5. Navigation System
7.2.6. Resource Valuation
7.2.7. Reservoir Characterization
7.2.7.1. Reservoir Imaging
7.2.7.2. Reservoir Monitoring
7.2.7.3. Subsurface Evaluation
7.2.7.4. Pressure and Flow-rate Measurement
7.2.8. Reservoir Simulation
7.2.8.1. Black Oil Simulator
7.2.8.2. Compositional Simulator
7.2.8.3. Thermal Compositional Simulator
7.2.9. Drilling
7.2.9.1. Well Planning
7.2.9.2. Drilling Engineering
7.2.9.3. Drilling operations
7.2.10. Production
7.2.10.1. Production Engineering
7.2.10.2. Production operations
7.3. Market Attractiveness, by Software Type
8. Global Exploration and Production (E&P) Software Market Analysis and Forecast, by Region
8.1. Key Findings
8.2. Global Exploration and Production (E&P) Software Market Size (US$ Mn) Forecast, by Region, 2016-2026
8.2.1. North America
8.2.2. Europe
8.2.3. Asia Pacific
8.2.4. Middle East & Africa
8.2.5. South America
8.3. Market Attractiveness, by Region
9. North America Exploration and Production (E&P) Software Market Analysis and Forecast
9.1. Key Findings
9.2. Key Trends
9.3. Exploration and Production (E&P) Software Market Size (US$ Mn) Forecast, by Deployment Type, 2016-2026
9.3.1. On-premise
9.3.2. Cloud
9.4. Exploration and Production (E&P) Software Market Size (US$ Mn) Forecast, by Operation Type, 2016-2026
9.4.1. On-shore
9.4.2. Off-shore
9.5. Exploration and Production (E&P) Software Market Size (US$ Mn) Forecast, by Software Type, 2016-2026
9.5.1. Risk Management Mapping
9.5.2. Seismic Amplitude Analysis
9.5.3. Portfolio Aggregation
9.5.4. Performance Tracking
9.5.5. Navigation System
9.5.6. Resource Valuation
9.5.7. Reservoir Characterization
9.5.7.1. Reservoir Imaging
9.5.7.2. Reservoir Monitoring
9.5.7.3. Subsurface Evaluation
9.5.7.4. Pressure and Flow-rate Measurement
9.5.8. Reservoir Simulation
9.5.8.1. Black Oil Simulator
9.5.8.2. Compositional Simulator
9.5.8.3. Thermal Compositional Simulator
9.5.9. Drilling
9.5.9.1. Well Planning
9.5.9.2. Drilling Engineering
9.5.9.3. Drilling operations
9.5.10. Production
9.5.10.1. Production Engineering
9.5.10.2. Production operations
9.6. Exploration and Production (E&P) Software Market Size (US$ Mn) Forecast, by Country, 2016-2026
9.6.1. The U.S.
9.6.2. Canada
9.6.3. Rest of North America
9.7. Market Attractiveness Analysis
9.7.1. By Deployment Type
9.7.2. By Operation Type
9.7.3. By Software Type
9.7.4. By Country
10. Europe Exploration and Production (E&P) Software Market Analysis and Forecast
10.1. Key Findings
10.2. Key Trends
10.3. Exploration and Production (E&P) Software Market Size (US$ Mn) Forecast, by Deployment Type, 2016-2026
10.3.1. On-premise
10.3.2. Cloud
10.4. Exploration and Production (E&P) Software Market Size (US$ Mn) Forecast, by Operation Type, 2016-2026
10.4.1. On-shore
10.4.2. Off-shore
10.5. Exploration and Production (E&P) Software Market Size (US$ Mn) Forecast, by Software Type, 2016-2026
10.5.1. Risk Management Mapping
10.5.2. Seismic Amplitude Analysis
10.5.3. Portfolio Aggregation
10.5.4. Performance Tracking
10.5.5. Navigation System
10.5.6. Resource Valuation
10.5.7. Reservoir Characterization
10.5.7.1. Reservoir Imaging
10.5.7.2. Reservoir Monitoring
10.5.7.3. Subsurface Evaluation
10.5.7.4. Pressure and Flow-rate Measurement
10.5.8. Reservoir Simulation
10.5.8.1. Black Oil Simulator
10.5.8.2. Compositional Simulator
10.5.8.3. Thermal Compositional Simulator
10.5.9. Drilling
10.5.9.1. Well Planning
10.5.9.2. Drilling Engineering
10.5.9.3. Drilling operations
10.5.10. Production
10.5.10.1. Production Engineering
10.5.10.2. Production operations
10.6. Exploration and Production (E&P) Software Market Size (US$ Mn) Forecast, by Country, 2016-2026
10.6.1. Germany
10.6.2. France
10.6.3. UK
10.6.4. Rest of Europe
10.7. Market Attractiveness Analysis
10.7.1. By Deployment Type
10.7.2. By Operation Type
10.7.3. By Software Type
10.7.4. By Country
11. Asia Pacific Exploration and Production (E&P) Software Market Analysis and Forecast
11.1. Key Findings
11.2. Key Trends
11.3. Exploration and Production (E&P) Software Market Size (US$ Mn) Forecast, by Deployment Type, 2016-2026
11.3.1. On-premise
11.3.2. Cloud
11.4. Exploration and Production (E&P) Software Market Size (US$ Mn) Forecast, by Operation Type, 2016-2026
11.4.1. On-shore
11.4.2. Off-shore
11.5. Exploration and Production (E&P) Software Market Size (US$ Mn) Forecast, by Software Type, 2016-2026
11.5.1. Risk Management Mapping
11.5.2. Seismic Amplitude Analysis
11.5.3. Portfolio Aggregation
11.5.4. Performance Tracking
11.5.5. Navigation System
11.5.6. Resource Valuation
11.5.7. Reservoir Characterization
11.5.7.1. Reservoir Imaging
11.5.7.2. Reservoir Monitoring
11.5.7.3. Subsurface Evaluation
11.5.7.4. Pressure and Flow-rate Measurement
11.5.8. Reservoir Simulation
11.5.8.1. Black Oil Simulator
11.5.8.2. Compositional Simulator
11.5.8.3. Thermal Compositional Simulator
11.5.9. Drilling
11.5.9.1. Well Planning
11.5.9.2. Drilling Engineering
11.5.9.3. Drilling operations
11.5.10. Production
11.5.10.1. Production Engineering
11.5.10.2. Production operations
11.6. Exploration and Production (E&P) Software Market Size (US$ Mn) Forecast, by Country, 2016-2026
11.6.1. China
11.6.2. Japan
11.6.3. India
11.6.4. Australia
11.6.5. Rest of Asia Pacific
11.7. Market Attractiveness Analysis
11.7.1. By Deployment Type
11.7.2. By Operation Type
11.7.3. By Software Type
11.7.4. By Country
12. Middle East & Africa (MEA) Exploration and Production (E&P) Software Market Analysis and Forecast
12.1. Key Findings
12.2. Key Trends
12.3. Exploration and Production (E&P) Software Market Size (US$ Mn) Forecast, by Deployment Type, 2016-2026
12.3.1. On-premise
12.3.2. Cloud
12.4. Exploration and Production (E&P) Software Market Size (US$ Mn) Forecast, by Operation Type, 2016-2026
12.4.1. On-shore
12.4.2. Off-shore
12.5. Exploration and Production (E&P) Software Market Size (US$ Mn) Forecast, by Software Type, 2016-2026
12.5.1. Risk Management Mapping
12.5.2. Seismic Amplitude Analysis
12.5.3. Portfolio Aggregation
12.5.4. Performance Tracking
12.5.5. Navigation System
12.5.6. Resource Valuation
12.5.7. Reservoir Characterization
12.5.7.1. Reservoir Imaging
12.5.7.2. Reservoir Monitoring
12.5.7.3. Subsurface Evaluation
12.5.7.4. Pressure and Flow-rate Measurement
12.5.8. Reservoir Simulation
12.5.8.1. Black Oil Simulator
12.5.8.2. Compositional Simulator
12.5.8.3. Thermal Compositional Simulator
12.5.9. Drilling
12.5.9.1. Well Planning
12.5.9.2. Drilling Engineering
12.5.9.3. Drilling operations
12.5.10. Production
12.5.10.1. Production Engineering
12.5.10.2. Production operations
12.6. Exploration and Production (E&P) Software Market Size (US$ Mn) Forecast, by Country, 2016-2026
12.6.1. GCC
12.6.2. South Africa
12.6.3. Rest of MEA
12.7. Market Attractiveness Analysis
12.7.1. By Deployment Type
12.7.2. By Operation Type
12.7.3. By Software Type
12.7.4. By Country
13. South America Exploration and Production (E&P) Software Market Analysis and Forecast
13.1. Key Findings
13.2. Key Trends
13.3. Exploration and Production (E&P) Software Market Size (US$ Mn) Forecast, by Deployment Type, 2016-2026
13.3.1. On-premise
13.3.2. Cloud
13.4. Exploration and Production (E&P) Software Market Size (US$ Mn) Forecast, by Operation Type, 2016-2026
13.4.1. On-shore
13.4.2. Off-shore
13.5. Exploration and Production (E&P) Software Market Size (US$ Mn) Forecast, by Software Type, 2016-2026
13.5.1. Risk Management Mapping
13.5.2. Seismic Amplitude Analysis
13.5.3. Portfolio Aggregation
13.5.4. Performance Tracking
13.5.5. Navigation System
13.5.6. Resource Valuation
13.5.7. Reservoir Characterization
13.5.7.1. Reservoir Imaging
13.5.7.2. Reservoir Monitoring
13.5.7.3. Subsurface Evaluation
13.5.7.4. Pressure and Flow-rate Measurement
13.5.8. Reservoir Simulation
13.5.8.1. Black Oil Simulator
13.5.8.2. Compositional Simulator
13.5.8.3. Thermal Compositional Simulator
13.5.9. Drilling
13.5.9.1. Well Planning
13.5.9.2. Drilling Engineering
13.5.9.3. Drilling operations
13.5.10. Production
13.5.10.1. Production Engineering
13.5.10.2. Production operations
13.6. Exploration and Production (E&P) Software Market Size (US$ Mn) Forecast, by Country, 2016-2026
13.6.1. Brazil
13.6.2. Rest of South America
13.7. Market Attractiveness Analysis
13.7.1. By Deployment Type
13.7.2. By Operation Type
13.7.3. By Software Type
13.7.4. By Country
14. Competition Landscape
14.1. Market Player – Competition Matrix (By Tier and Size of the Company)
14.2. Market Share Analysis by Company (2017)
14.3. Company Profiles
14.3.1. Schlumberger Limited
14.3.1.1. Company Overview
14.3.1.2. Financials
14.3.1.3. SWOT Analysis
14.3.1.4. Strategy
14.3.2. Paradigm B.V.
14.3.2.1. Company Overview
14.3.2.2. Financials
14.3.2.3. SWOT Analysis
14.3.2.4. Strategy
14.3.3. ION Geophysical Corporation
14.3.3.1. Company Overview
14.3.3.2. Financials
14.3.3.3. SWOT Analysis
14.3.3.4. Strategy
14.3.4. ETL Solutions Ltd.
14.3.4.1. Company Overview
14.3.4.2. Financials
14.3.4.3. SWOT Analysis
14.3.4.4. Strategy
14.3.5. Ikon Science Limited
14.3.5.1. Company Overview
14.3.5.2. Financials
14.3.5.3. SWOT Analysis
14.3.5.4. Strategy
14.3.6. Interactive Network Technologies, Inc.
14.3.6.1. Company Overview
14.3.6.2. Financials
14.3.6.3. SWOT Analysis
14.3.6.4. Strategy
14.3.7. Exprodat Consulting Ltd.
14.3.7.1. Company Overview
14.3.7.2. Financials
14.3.7.3. SWOT Analysis
14.3.7.4. Strategy
14.3.8. GEPlan Consulting Srl
14.3.8.1. Company Overview
14.3.8.2. Financials
14.3.8.3. SWOT Analysis
14.3.8.4. Strategy
14.3.9. Landmark Solutions
14.3.9.1. Company Overview
14.3.9.2. Financials
14.3.9.3. SWOT Analysis
14.3.9.4. Strategy
14.3.10. Baker Hughes Incorporated
14.3.10.1. Company Overview
14.3.10.2. Financials
14.3.10.3. SWOT Analysis
14.3.10.4. Strategy
14.3.11. HIS Inc.
14.3.11.1. Company Overview
14.3.11.2. Financials
14.3.11.3. SWOT Analysis
14.3.11.4. Strategy
14.3.12. Merson Electric Co.
14.3.12.1. Company Overview
14.3.12.2. Financials
14.3.12.3. SWOT Analysis
14.3.12.4. Strategy
14.3.13. Peloton
14.3.13.1. Company Overview
14.3.13.2. Financials
14.3.13.3. SWOT Analysis
14.3.13.4. Strategy
14.3.14. Computer Modelling Group Ltd.
14.3.14.1. Company Overview
14.3.14.2. Financials
14.3.14.3. SWOT Analysis
14.3.14.4. Strategy
14.3.15. Petroleum Experts Ltd.
14.3.15.1. Company Overview
14.3.15.2. Financials
14.3.15.3. SWOT Analysis
14.3.15.4. Strategy
14.3.16. Kongberg Gruppen
14.3.16.1. Company Overview
14.3.16.2. Financials
14.3.16.3. SWOT Analysis
14.3.16.4. Strategy
14.3.17. RockFlow Dynamics LLC
14.3.17.1. Company Overview
14.3.17.2. Financials
14.3.17.3. SWOT Analysis
14.3.17.4. Strategy
14.3.18. GE Oil & Gas
14.3.18.1. Company Overview
14.3.18.2. Financials
14.3.18.3. SWOT Analysis
14.3.18.4. Strategy
14.3.19. OVS Group LLCCompany Overview
14.3.19.1. Company Overview
14.3.19.2. Financials
14.3.19.3. SWOT Analysis
14.3.19.4. Strategy
14.3.20. P2 Energy Solutions
14.3.20.1. Company Overview
14.3.20.2. Financials
14.3.20.3. SWOT Analysis
14.3.20.4. Strategy
14.3.21. Petrolink Services Inc.
14.3.21.1. Company Overview
14.3.21.2. Financials
14.3.21.3. SWOT Analysis
14.3.21.4. Strategy
14.3.22. eDrilling AS
14.3.22.1. Company Overview
14.3.22.2. Financials
14.3.22.3. SWOT Analysis
14.3.22.4. Strategy
14.3.23. Pason Systems Corp.
14.3.23.1. Company Overview
14.3.23.2. Financials
14.3.23.3. SWOT Analysis
14.3.23.4. Strategy
14.3.24. Etech International, Inc.
List of Tables
Table 1: Global Exploration and Production (E&P) Software Market Size (US$ Mn) Forecast, by Deployment Type, 2016–2026
Table 2: Global Exploration and Production (E&P) Software Market Size (US$ Mn) Forecast, by Operation Type, 2016–2026
Table 3: Global Exploration and Production (E&P) Software Market Size (US$ Mn) Forecast, by Software Type, 2016–2026
Table 4: Global Exploration and Production (E&P) Software Market Size (US$ Mn) Forecast, by Software Type, 2016–2026
Table 5: Global Exploration and Production (E&P) Reservoir Characterization Software Market Size (US$ Mn) Forecast, by Type, 2016–2026
Table 6: Global Exploration and Production (E&P) Reservoir Simulation Software Market Size (US$ Mn) Forecast, by Type, 2016–2026
Table 7: Global Exploration and Production (E&P) Drilling Software Market Size (US$ Mn) Forecast, by Type, 2016–2026
Table 8: Global Exploration and Production (E&P) Well Planning Software Market Size (US$ Mn) Forecast, by Type, 2016–2026
Table 9: Global Exploration and Production (E&P) Drilling Engineering Software Market Size (US$ Mn) Forecast, by Type, 2016–2026
Table 10: Global Exploration and Production (E&P) Drilling Engineering Software Market Size (US$ Mn) Forecast, by Type, 2016–2026
Table 11: Global Exploration and Production (E&P) Drilling Operations Software Market Size (US$ Mn) Forecast, by Type, 2016–2026
Table 12: Global Exploration and Production (E&P) Drilling Operations Software Market Size (US$ Mn) Forecast, by Type, 2016–2026
Table 13: Global Exploration and Production (E&P) Production Software Market Size (US$ Mn) Forecast, by Type, 2016–2026
Table 14: Global Exploration and Production (E&P) Production Engineering Software Market Size (US$ Mn) Forecast, by Type, 2016–2026
Table 15: Global Exploration and Production (E&P) Production Operations Software Market Size (US$ Mn) Forecast, by Type, 2016–2026
Table 16: Global Exploration and Production (E&P) Drilling Engineering Software Market Size (US$ Mn) Forecast, by Region, 2016–2026
Table 17: North America Exploration and Production (E&P) Software Market Size (US$ Mn) Forecast, by Deployment Type, 2016–2026
Table 18: North America Exploration and Production (E&P) Software Market Size (US$ Mn) Forecast, by Operation Type, 2016–2026
Table 19: North America Exploration and Production (E&P) Software Market Size (US$ Mn) Forecast, by Software Type, 2016–2026
Table 20: North America Exploration and Production (E&P) Software Market Size (US$ Mn) Forecast, by Software Type, 2016–2026
Table 21: North America Exploration and Production (E&P) Reservoir Characterization Software Market Size (US$ Mn) Forecast, by Type, 2016–2026
Table 22: North America Exploration and Production (E&P) Reservoir Simulation Software Market Size (US$ Mn) Forecast, by Type, 2016–2026
Table 23: North America Exploration and Production (E&P) Drilling Software Market Size (US$ Mn) Forecast, by Type, 2016–2026
Table 24: North America Exploration and Production (E&P) Well Planning Software Market Size (US$ Mn) Forecast, by Type, 2016–2026
Table 25: North America Exploration and Production (E&P) Drilling Engineering Software Market Size (US$ Mn) Forecast, by Type, 2016–2026
Table 26: North America Exploration and Production (E&P) Drilling Engineering Software Market Size (US$ Mn) Forecast, by Type, 2016–2026
Table 27: North America Exploration and Production (E&P) Drilling Operations Software Market Size (US$ Mn) Forecast, by Type, 2016–2026
Table 28: North America Exploration and Production (E&P) Drilling Operations Software Market Size (US$ Mn) Forecast, by Type, 2016–2026
Table 29: North America Exploration and Production (E&P) Production Software Market Size (US$ Mn) Forecast, by Type, 2016–2026
Table 30: North America Exploration and Production (E&P) Production Engineering Software Market Size (US$ Mn) Forecast, by Type, 2016–2026
Table 31: North America Exploration and Production (E&P) Production Operations Software Market Size (US$ Mn) Forecast, by Type, 2016–2026
Table 32: North America Exploration and Production (E&P) Software Market Size (US$ Mn) Forecast, by Region/Country, 2016–2026
Table 33: Europe Exploration and Production (E&P) Software Market Size (US$ Mn) Forecast, by Deployment Type, 2016–2026
Table 34: Europe Exploration and Production (E&P) Software Market Size (US$ Mn) Forecast, by Operation Type, 2016–2026
Table 35: Europe Exploration and Production (E&P) Software Market Size (US$ Mn) Forecast, by Software Type, 2016–2026
Table 36: Europe Exploration and Production (E&P) Software Market Size (US$ Mn) Forecast, by Software Type, 2016–2026
Table 37: Europe Exploration and Production (E&P) Reservoir Characterization Software Market Size (US$ Mn) Forecast, by Type, 2016–2026
Table 38: Europe Exploration and Production (E&P) Reservoir Simulation Software Market Size (US$ Mn) Forecast, by Type, 2016–2026
Table 39: Europe Exploration and Production (E&P) Drilling Software Market Size (US$ Mn) Forecast, by Type, 2016–2026
Table 40: Europe Exploration and Production (E&P) Well Planning Software Market Size (US$ Mn) Forecast, by Type, 2016–2026
Table 41: Europe Exploration and Production (E&P) Drilling Engineering Software Market Size (US$ Mn) Forecast, by Type, 2016–2026
Table 42: Europe Exploration and Production (E&P) Drilling Engineering Software Market Size (US$ Mn) Forecast, by Type, 2016–2026
Table 43: Europe Exploration and Production (E&P) Drilling Operations Software Market Size (US$ Mn) Forecast, by Type, 2016–2026
Table 44: Europe Exploration and Production (E&P) Drilling Operations Software Market Size (US$ Mn) Forecast, by Type, 2016–2026
Table 45: Europe Exploration and Production (E&P) Production Software Market Size (US$ Mn) Forecast, by Type, 2016–2026
Table 46: Europe Exploration and Production (E&P) Production Engineering Software Market Size (US$ Mn) Forecast, by Type, 2016–2026
Table 47: Europe Exploration and Production (E&P) Production Operations Software Market Size (US$ Mn) Forecast, by Type, 2016–2026
Table 48: Europe Exploration and Production (E&P) Software Market Size (US$ Mn) Forecast, by Region/Country, 2016–2026
Table 49: Asia Pacific Exploration and Production (E&P) Software Market Size (US$ Mn) Forecast, by Deployment Type, 2016–2026
Table 50: Asia Pacific Exploration and Production (E&P) Software Market Size (US$ Mn) Forecast, by Operation Type, 2016–2026
Table 51: Asia Pacific Exploration and Production (E&P) Software Market Size (US$ Mn) Forecast, by Software Type, 2016–2026
Table 52: Asia Pacific Exploration and Production (E&P) Software Market Size (US$ Mn) Forecast, by Software Type, 2016–2026
Table 53: Asia Pacific Exploration and Production (E&P) Reservoir Characterization Software Market Size (US$ Mn) Forecast, by Type, 2016–2026
Table 54: Asia Pacific Exploration and Production (E&P) Reservoir Simulation Software Market Size (US$ Mn) Forecast, by Type, 2016–2026
Table 55: Asia Pacific Exploration and Production (E&P) Drilling Software Market Size (US$ Mn) Forecast, by Type, 2016–2026
Table 56: Asia Pacific Exploration and Production (E&P) Well Planning Software Market Size (US$ Mn) Forecast, by Type, 2016–2026
Table 57: Asia Pacific Exploration and Production (E&P) Drilling Engineering Software Market Size (US$ Mn) Forecast, by Type, 2016–2026
Table 58: Asia Pacific Exploration and Production (E&P) Drilling Engineering Software Market Size (US$ Mn) Forecast, by Type, 2016–2026
Table 59: Asia Pacific Exploration and Production (E&P) Drilling Operations Software Market Size (US$ Mn) Forecast, by Type, 2016–2026
Table 60: Asia Pacific Exploration and Production (E&P) Drilling Operations Software Market Size (US$ Mn) Forecast, by Type, 2016–2026
Table 61: Asia Pacific Exploration and Production (E&P) Production Software Market Size (US$ Mn) Forecast, by Type, 2016–2026
Table 62 :Asia Pacific Exploration and Production (E&P) Production Engineering Software Market Size (US$ Mn) Forecast, by Type, 2016–2026
Table 63: Asia Pacific Exploration and Production (E&P) Production Operations Software Market Size (US$ Mn) Forecast, by Type, 2016–2026
Table 64: Asia Pacific Exploration and Production (E&P) Software Market Size (US$ Mn) Forecast, by Region/Country, 2016–2026
Table 65: Middle East & Africa Exploration and Production (E&P) Software Market Size (US$ Mn) Forecast, by Deployment Type, 2016–2026
Table 66: Middle East & Africa Exploration and Production (E&P) Software Market Size (US$ Mn) Forecast, by Operation Type, 2016–2026
Table 67: Middle East & Africa Exploration and Production (E&P) Software Market Size (US$ Mn) Forecast, by Software Type, 2016–2026
Table 68: Middle East & Africa Exploration and Production (E&P) Software Market Size (US$ Mn) Forecast, by Software Type, 2016–2026
Table 69: Middle East & Africa Exploration and Production (E&P) Reservoir Characterization Software Market Size (US$ Mn) Forecast, by Type, 2016–2026
Table 70: Middle East & Africa Exploration and Production (E&P) Reservoir Simulation Software Market Size (US$ Mn) Forecast, by Type, 2016–2026
Table 71: Middle East & Africa Exploration and Production (E&P) Drilling Software Market Size (US$ Mn) Forecast, by Type, 2016–2026
Table 72: Middle East & Africa Exploration and Production (E&P) Well Planning Software Market Size (US$ Mn) Forecast, by Type, 2016–2026
Table 73: Middle East & Africa Exploration and Production (E&P) Drilling Engineering Software Market Size (US$ Mn) Forecast, by Type, 2016–2026
Table 74: Middle East & Africa Exploration and Production (E&P) Drilling Engineering Software Market Size (US$ Mn) Forecast, by Type, 2016–2026
Table 75: Middle East & Africa Exploration and Production (E&P) Drilling Operations Software Market Size (US$ Mn) Forecast, by Type, 2016–2026
Table 76: Middle East & Africa Exploration and Production (E&P) Drilling Operations Software Market Size (US$ Mn) Forecast, by Type, 2016–2026
Table 77: Middle East & Africa Exploration and Production (E&P) Production Software Market Size (US$ Mn) Forecast, by Type, 2016–2026
Table 78: Middle East & Africa Exploration and Production (E&P) Production Engineering Software Market Size (US$ Mn) Forecast, by Type, 2016–2026
Table 79: Middle East & Africa Exploration and Production (E&P) Production Operations Software Market Size (US$ Mn) Forecast, by Type, 2016–2026
Table 80: Middle East & Africa Exploration and Production (E&P) Software Market Size (US$ Mn) Forecast, by Region/Country, 2016–2026
Table 81: South America Exploration and Production (E&P) Software Market Size (US$ Mn) Forecast, by Deployment Type, 2016–2026
Table 82: South America Exploration and Production (E&P) Software Market Size (US$ Mn) Forecast, by Operation Type, 2016–2026
Table 83: South America Exploration and Production (E&P) Software Market Size (US$ Mn) Forecast, by Software Type, 2016–2026
Table 84: South America Exploration and Production (E&P) Software Market Size (US$ Mn) Forecast, by Software Type, 2016–2026
Table 85: South America Exploration and Production (E&P) Reservoir Characterization Software Market Size (US$ Mn) Forecast, by Type, 2016–2026
Table 86: South America Exploration and Production (E&P) Reservoir Simulation Software Market Size (US$ Mn) Forecast, by Type, 2016–2026
Table 87: South America Exploration and Production (E&P) Drilling Software Market Size (US$ Mn) Forecast, by Type, 2016–2026
Table 88: South America Exploration and Production (E&P) Well Planning Software Market Size (US$ Mn) Forecast, by Type, 2016–2026
Table 89: South America Exploration and Production (E&P) Drilling Engineering Software Market Size (US$ Mn) Forecast, by Type, 2016–2026
Table 90: South America Exploration and Production (E&P) Drilling Engineering Software Market Size (US$ Mn) Forecast, by Type, 2016–2026
Table 91: South America Exploration and Production (E&P) Drilling Operations Software Market Size (US$ Mn) Forecast, by Type, 2016–2026
Table 92: South America Exploration and Production (E&P) Drilling Operations Software Market Size (US$ Mn) Forecast, by Type, 2016–2026
Table 93: South America Exploration and Production (E&P) Production Software Market Size (US$ Mn) Forecast, by Type, 2016–2026
Table 94: South America Exploration and Production (E&P) Production Engineering Software Market Size (US$ Mn) Forecast, by Type, 2016–2026
Table 95: South America Exploration and Production (E&P) Production Operations Software Market Size (US$ Mn) Forecast, by Type, 2016–2026
Table 96: South America Exploration and Production (E&P) Software Market Size (US$ Mn) Forecast, by Region/Country, 2016–2026
List of Figures
Figure: 01 Gross Domestic Product (GDP) per Capita; Analysis (1/2) (US$ Tn), by Major Countries, 2012-2017
Figure: 02 Global Oil and Gas CAPEX (US$ Mn), 2015 – 2017
Figure: 03 Global Oil and Gas IT Spending CAPEX (US$ Mn), 2015 – 2017
Figure: 04 Global Exploration and Production (E&P) Software Market Size (US$ Mn) and Forecast, 2012 – 2026
Figure: 05 Global Exploration and Production (E&P) Software Market Opportunity Analysis, 2016 – 2026
Figure: 06 Global Exploration and Production (E&P) Software Market Value Share (Value %), by Deployment, 2018
Figure: 07 Global Exploration and Production (E&P) Software Market Value Share (Value %), by Operation, 2018
Figure: 08 Global Exploration and Production (E&P) Software Market Value Share (Value %), by Software, 2018
Figure: 09 Global Exploration and Production (E&P) Software Market Value Share (Value %), by Region, 2018
Figure: 10 Global Exploration and Production (E&P) Software Market Revenue Share (%) Analysis, by Deployment Type, 2018 and 2026
Figure: 11 Global Exploration and Production (E&P) Software Market Attractiveness Analysis, by Deployment Type
Figure: 12 Global Exploration and Production (E&P) Software Market Revenue Share (%) Analysis, by Operation Type, 2018 and 2026
Figure: 13 Global Exploration and Production (E&P) Software Market Attractiveness Analysis, by Operation Type
Figure: 14 Global Exploration and Production (E&P) Software Market Revenue Share (%) Analysis, by Software Type, 2018 and 2026
Figure: 15 Global Exploration and Production (E&P) Software Market Attractiveness Analysis, by Software Type
Figure: 16 North America Exploration and Production (E&P) Software Market Size (US$ Mn) Forecast, 2016–2026
Figure: 17 North America Exploration and Production (E&P) Software Market Size Y-o-Y Growth Projections, 2017–2026
Figure: 18 Upstream investment in North America is expected to rise due to a 53% increase in U.S. shale investment in 2017 as compared to 2016
Figure: 19 North America Exploration and Production (E&P) Software Market Revenue Share (%) Analysis, by Deployment Type, 2018 and 2026
Figure 20: North America Exploration and Production (E&P) Software Market Revenue Share (%) Analysis, by Operation Type, 2018 and 2026
Figure 21: North America Exploration and Production (E&P) Software Market Revenue Share (%) Analysis, by Software Type, 2018 and 2026
Figure 22: North America Exploration and Production (E&P) Software Market Revenue Share (%) Analysis, Region/Country, 2018 and 2026
Figure 23: North America Exploration and Production (E&P) Software Market Attractiveness Analysis by Country
Figure 24: North America Exploration and Production (E&P) Software Market Attractiveness Analysis by Deployment Type
Figure 25: North America Exploration and Production (E&P) Software Market Attractiveness Analysis by Operation Type
Figure 26: North America Exploration and Production (E&P) Software Market Attractiveness Analysis by Software Type
Figure 27: Europe Exploration and Production (E&P) Software Market Size (US$ Mn) Forecast, 2016–2026
Figure 28: Europe Exploration and Production (E&P) Software Market Size Y-o-Y Growth Projections, 2017–2026
Figure 29: Europe has also seen a rise in upstream investment, with Russia (a major economy) witnessing a 6% rise in investment in 2017 as compared to 2016
Figure 30: Europe Exploration and Production (E&P) Software Market Revenue Share (%) Analysis, by Deployment Type, 2018 and 2026
Figure 31: Europe Exploration and Production (E&P) Software Market Revenue Share (%) Analysis, by Operation Type, 2018 and 2026
Figure 32: Europe Exploration and Production (E&P) Software Market Revenue Share (%) Analysis, by Software Type, 2018 and2026
Figure 33: Europe Exploration and Production (E&P) Software Market Revenue Share (%) Analysis, Region/Country, 2018 and 2026
Figure 34: Europe Exploration and Production (E&P) Software Market Attractiveness Analysis, by Country
Figure 35: Europe Exploration and Production (E&P) Software Market Attractiveness Analysis, by Deployment Type
Figure 36: Europe Exploration and Production (E&P) Software Market Attractiveness Analysis, by Operation Type
Figure 37: Europe Exploration and Production (E&P) Software Market Attractiveness Analysis, by Software Type
Figure 38: Asia Pacific Exploration and Production (E&P) Software Market Size (US$ Mn) Forecast, 2016–2026
Figure 39: Asia Pacific Exploration and Production (E&P) Software Market Size Y-o-Y Growth Projections, 2017–2026
Figure 40: Asia Pacific has seen a rise in energy investment lead by China, which constituted 21% of the global investment in energy in 2017
Figure 41: Asia Pacific Exploration and Production (E&P) Software Market Revenue Share (%) Analysis, by Deployment Type, 2018 and 2026
Figure 42: Asia Pacific Exploration and Production (E&P) Software Market Revenue Share (%) Analysis, by Operation Type, 2018 and 2026
Figure 43: Asia Pacific Exploration and Production (E&P) Software Market Revenue Share (%) Analysis, by Software Type, 2018 and 2026
Figure 44: Asia Pacific Exploration and Production (E&P) Software Market Revenue Share (%) Analysis, Region/Country, 2018 and 2026
Figure 45: Asia Pacific Exploration and Production (E&P) Software Market Attractiveness Analysis, by Country
Figure 46: Asia Pacific Exploration and Production (E&P) Software Market Attractiveness Analysis, by Deployment Type
Figure 47: Asia Pacific Exploration and Production (E&P) Software Market Attractiveness Analysis, by Operation Type
Figure 48: Asia Pacific Exploration and Production (E&P) Software Market Attractiveness Analysis, by Software Type
Figure 49: Middle East & Africa Exploration and Production (E&P) Software Market Size (US$ Mn) Forecast, 2016–2026
Figure 50: Middle East & Africa Exploration and Production (E&P) Software Market Size Y-o-Y Growth Projections, 2017–2026
Figure 51: Middle East & Africa has seen mixed upstream oil & gas investment, with the Middle East showing a 4% increase in investment and Africa showing a 9% decrease in investment
Figure 52: Middle East & Africa Exploration and Production (E&P) Software Market Revenue Share (%) Analysis, by Deployment Type, 2018 and 2026
Figure 53: Middle East & Africa Exploration and Production (E&P) Software Market Revenue Share (%) Analysis, by Operation Type, 2018 and 2026
Figure 54: Middle East & Africa Exploration and Production (E&P) Software Market Revenue Share (%) Analysis, by Software Type, 2018 and 2026
Figure 55: Middle East & Africa Exploration and Production (E&P) Software Market Revenue Share (%) Analysis, Region/Country, 2018 and 2026
Figure 56: Middle East & Africa Exploration and Production (E&P) Software Market Attractiveness Analysis by Country
Figure 57: Middle East & Africa Exploration and Production (E&P) Software Market Attractiveness Analysis by Deployment Type
Figure 58: Middle East & Africa Exploration and Production (E&P) Software Market Attractiveness Analysis, by Operation Type
Figure 59: Middle East & Africa Exploration and Production (E&P) Software Market Attractiveness Analysis, by Software Type
Figure 60: South America Exploration and Production (E&P) Software Market Size (US$ Mn) Forecast, 2016–2026
Figure 61: South America Exploration and Production (E&P) Software Market Size Y-o-Y Growth Projections, 2017–2026
Figure 62: South America has seen a decrease in upstream oil & gas investment in 2017 as compared to 2016
Figure 63: South America Exploration and Production (E&P) Software Market Revenue Share (%) Analysis, by Deployment Type, 2018 and 2026
Figure 64: South America Exploration and Production (E&P) Software Market Revenue Share (%) Analysis, by Operation Type, 2018 and 2026
Figure 65: South America Exploration and Production (E&P) Software Market Revenue Share (%) Analysis, by Software Type, 2018 and 2026
Figure 66: South America Exploration and Production (E&P) Software Market Revenue Share (%) Analysis, Region/Country, 2018 and 2026
Figure 67: South America Exploration and Production (E&P) Software Market Attractiveness Analysis, by Country
Figure 68: South America Exploration and Production (E&P) Software Market Attractiveness Analysis, by Deployment Type
Figure 69: South America Exploration and Production (E&P) Software Market Attractiveness Analysis, by Operation Type
Figure 70: South America Exploration and Production (E&P) Software Market Attractiveness Analysis, by Software Type
Copyright © Transparency Market Research, Inc. All Rights reserved
Trust Online

Exploration and Production (E&P) Software Market
