Industrial gears find vast usage across a number of industries owing to the reduction in mechanical work they bring about in a variety of industrial processes and operations. Industrial gears have equally expansive applications in heavy industries as well as in different manufacturing industries. Forming the core of most machinery used extensively in a vast array of industrial processes, the market for industrial gears in the highly industrialized European countries is expected to expand at a healthy pace in the next few years.
The Europe industrial gear market is mostly privatized and the features both international and local companies. Considering the new technologies introduced in the industrial gear market in the recent years, the market has vast potential opportunities for the manufacturers of industrial gears in the near future. As a result, the market is experiencing a high level of competition. Moreover, the entry of international players from North America and Asia Pacific into the region also facilitates the exchange of enhanced gear technologies. Growing competition is expected to ensure steady market growth rate over the forecast period
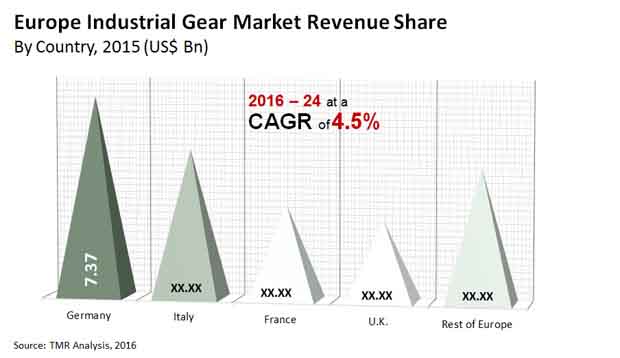
Transparency Market Research estimates that the market will exhibit a 4.5% CAGR over the period between 2016 and 2024. At this pace, the market is expected to rise from a valuation of US$24.21 bn in 2015 to US$35.23 bn by 2024.
On the basis of gear types the market is bifurcated into helical gears, bevel gears, worm gears, spur gears, herringbone gears, hypoid gears, crown gears, skew gears, spiral gears, non-circular gears, epicyclic gears, harmonic gears, and magnetic gears. Of these, the segment of helical gears held the dominant 12.4% of the overall market in 2015, in terms of revenue. The segment, however, is expected to witness a sizeable decline in its share in the Europe industrial gears market by 2024 owing to issues such as the production of more heat, less efficiency, and higher maintenance cost as compared to other gears.
Gear varieties such as worm gear, herringbone gear, and magnetic gear are expected to gain more focus and witness increased adoption across a number of industries over the period between 2016 and 2024. The segment of magnetic gears is expected to exhibit the most promising growth over the said period, an estimated 6.6% CAGR from 2016 through 2024; light weight, compact designs, and low costs of these gears are expected to work in their favor.
In terms of geography, the Europe industrial gears market is examined for U.K., Germany, Italy, France and Rest of Europe. Of these, the market in Germany dominated in terms of revenue contribution to the overall market in 2015. The presence of a large number of industries and a steadily expanding manufacturing sector in the country is fuelling the demand of industrial gears.
Over the forecast period, however, the market for industrial gears in Germany will lose prominence to other regional markets such as France, Italy, and countries in the Rest of the Europe segment, including Spain, Belgium, and the Netherlands. The Rest of the Europe segment will exhibit the most promising pace of growth, an estimated 5.5% CAGR from 2016 to 2024. The market in this region will primarily benefit from the flourishing manufacturing industries like construction, steel, and iron.
Some of the key players in the industrial gear market are Siemens AG (Germany), Klingelnberg GmbH (Switzerland), Precipart Corporation (U.S.), RenoldPlc (U.K.), BonfiglioliRiduttori S.P.A. (Italy), BMT International S.A. (Luxembourg), Rossi SpA (Italy), Getriebebau NORD GmbH &Co. KG (Germany), NGC (China), and Sumitomo Heavy Industries Ltd. (Japan).
Industrial gears are utilized in a wide range of industries because they reduce mechanical activity in a variety of industrial operations and processes. Industrial gears are equally expansive in heavy industry and in various processing sectors. Industrial gears are at the heart of most equipment utilized in a wide range of industrial applications, and the demand for them in highly developed European countries is expected to grow at a healthy rate in the coming years. This factor is likely to foster development of the Europe industrial gear market in the years to come.
The mostly privatized Europe industrial gear market has both local and foreign firms. In view of the introduction of advanced technology in the industrial gear market in recent years, market participants are likely to have huge growth opportunities in the years to come. As a consequence, the competition in the Europe industrial gear market is strong. Furthermore, it facilitates the exchange of improved gear technology with international players from North America and Asia-Pacific into the region. Growing competition is expected to ensure consistent demand growth in the forthcoming years.
Thanks to the ease of installation and consistency of this equipment, spur gear is one of the key forces in the development of the Europe industrial gear market. Another significant benefit of these gears is that they maintain a steady velocity ratio. Most of the automotive gear market in Europe is privatized and both foreign and local industries are part of this sector. In view of the modern innovations applied to the said industry, the market is estimated to offer industrial gear producers lucrative prospects. This leads to a significant degree of competition among existing market players.
Industrial gears contribute to the reduction of mechanical labor in industries by lowering the workload. It operates seamlessly for different equipment and does the hard work. In heavy industries, these gears are utilized to determine the course of rotational force from one axis to the other. The huge cost of repairs is stifling the Europe industrial gear market. The repair of the gears is one of the most important concerns for the manufacturing industry. Furthermore, the cost of spare parts is also high, resulting in a huge financial outlay.
Modern pinion wheels discover huge utilization across various businesses inferable from the decrease in mechanical work they achieve in an assortment of modern cycles and activities. Modern pinion wheels have similarly sweeping applications in hefty businesses just as in various manufacturing ventures. Framing the center of most hardware utilized widely in a huge swath of modern cycles, the market for mechanical cog wheels in the exceptionally industrialized European nations is required to grow at a sound speed in the following not many years.
Interests in discrete assembling areas like bundling, plastics, auto, and material taking care of are required to set out deals open doors for industrial gear. The assembling of mass-delivered vehicles and handling of food, pharm, biotech, and so forth commonly depends on transports and gear to carry the parts and gatherings to an area where robots or laborers are entrusted with a particular capacity. These electric engines are regularly associated straightforwardly to gearboxes with the assistance of gear as these are utilized for driving transports, lifts, robot arms, and so forth.
Machines utilized in the packaging business should convey elite in regularly requesting conditions. High velocity and precise and repeatable developments are essential in conditions where temperature, pressing factor, and loads can put a strain on electromechanical parts, including bundling gear. This grandstands a chance for the development of the industrial gear market.
The Europe industrial gear market is for the most part privatized and the highlights both global and nearby organizations. Considering the new advancements presented in the industrial gear market in the new years, the market has immense expected freedoms for the makers of industrial gears soon. Therefore, the market is encountering a significant degree of rivalry. Besides, the passage of global players from North America and Asia Pacific into the area additionally works with the trading of improved gear innovations. Developing rivalry is required to guarantee consistent market development rate in the coming years.
1. Preface
1.1. Market Definition and Scope
1.2. Market Segmentation
1.3. Key Research Objectives
1.4. Research Highlights
2. Assumptions
3. Research Methodology
4. Executive Summary
5. Market Overview
5.1. Introduction
5.2. Market Dynamics
5.2.1. Drivers
5.2.2. Restraints
5.2.3. Opportunities
5.3. Key Trends Analysis
5.3.1. Demand Side Analysis
5.3.2. Supply Side Analysis
5.4. Key Market Indicators
5.4.1. Premium Grade Industrial Gear
5.4.2. Increasing Crude Steel Production
5.4.3. Industrial Gear Manufacturers
5.5. Porter’s Five Forces Analysis
5.6. Technology Overview
5.7. Value Chain Analysis
5.7.1. Managing Supply Chain Risk and Disruption – Considering Impact of COVID-19
5.8. Industry SWOT Analysis
5.9. Global Industrial Gear Market Analysis and Forecast, 2018 - 2030
5.9.1. Market Revenue Projections (US$ Mn)
5.9.2. Market Revenue Projections (Million Units)
6. Global Industrial Gear Market Analysis and Forecast, By Product Type
6.1. Global Industrial Gear Market Size (US$ Mn, Million Units) Forecast, By Product Type, 2018 - 2030
6.1.1. Spur Gear
6.1.2. Planetary Gear
6.1.3. Helical Gear
6.1.4. Rack and Pinion Gear
6.1.5. Worm Gear
6.1.6. Bevel Gear
6.1.7. Others
6.2. Incremental Opportunity, By Product Type
7. Global Industrial Gear Market Analysis and Forecast, by Application
7.1. Global Industrial Gear Market Size (US$ Mn, Million Units), by Application, 2018 - 2030
7.1.1. Oilfield Equipment
7.1.2. Mining Equipment
7.1.3. Industrial Machinery
7.1.4. Power Plants
7.1.5. Construction Machinery
7.1.6. Others
7.2. Global Incremental Opportunity, by Application
8. Global Industrial Gear Market Analysis and Forecast, by Distribution Channel
8.1. Global Industrial Gear Market Size (US$ Mn, Million Units), by Distribution Channel, 2018 - 2030
8.1.1. Online
8.1.2. Offline
8.2. Global Incremental Opportunity, by Distribution Channel
9. Global Industrial Gear Market Analysis and Forecast, by Region
9.1. Industrial Gear Market Size (US$ Mn & Million Units), by Region, 2018 - 2030
9.1.1. North America
9.1.2. Europe
9.1.3. Asia Pacific
9.1.4. Middle East & Africa
9.1.5. South America
9.2. Global Incremental Opportunity, by Region
10. North America Industrial Gear Market Analysis and Forecast
10.1. Regional Snapshot
10.1.1. By Product Type
10.1.2. By Application
10.1.3. By Distribution Channel
10.1.4. By Country
10.2. Key Trend Analysis
10.2.1. Demand Side
10.2.2. Supply Side
10.3. Price Trend Analysis
10.3.1. Weighted Average Price
10.3.2. Price Impact-COVID-19
10.4. Impact Analysis of COVID- 19
10.5. Industrial Gear Market Size (US$ Mn, Million Units) Forecast, By Product Type, 2018 - 2030
10.5.1. Spur Gear
10.5.2. Planetary Gear
10.5.3. Helical Gear
10.5.4. Rack and Pinion Gear
10.5.5. Worm Gear
10.5.6. Bevel Gear
10.5.7. Others
10.6. Industrial Gear Market Size (US$ Mn, Million Units), by Application, 2018 - 2030
10.6.1. Oilfield Equipment
10.6.2. Mining Equipment
10.6.3. Industrial Machinery
10.6.4. Power Plants
10.6.5. Construction Machinery
10.6.6. Others
10.7. Industrial Gear Market Size (US$ Mn, Million Units), by Distribution Channel, 2018 - 2030
10.7.1. Online
10.7.2. Offline
10.8. Industrial Gear Market Size (US$ Mn & Million Units) Forecast, by Country & Sub-region, 2018 - 2030
10.8.1. The U.S.
10.8.2. Canada
10.8.3. Rest of North America
10.9. Incremental Opportunity Analysis
11. Europe Industrial Gear Market Analysis and Forecast
11.1. Regional Snapshot
11.1.1. By Product Type
11.1.2. By Application
11.1.3. By Distribution Channel
11.1.4. By Country
11.2. Key Trend Analysis
11.2.1. Demand Side
11.2.2. Supply Side
11.3. Price Trend Analysis
11.3.1. Weighted Average Price
11.3.2. Price Impact-COVID-19
11.4. Impact Analysis of COVID- 19
11.5. Industrial Gear Market Size (US$ Mn, Million Units) Forecast, By Product Type, 2018 - 2030
11.5.1. Spur Gear
11.5.2. Planetary Gear
11.5.3. Helical Gear
11.5.4. Rack and Pinion Gear
11.5.5. Worm Gear
11.5.6. Bevel Gear
11.5.7. Others
11.6. Industrial Gear Market Size (US$ Mn, Million Units), by Application, 2018 - 2030
11.6.1. Oilfield Equipment
11.6.2. Mining Equipment
11.6.3. Industrial Machinery
11.6.4. Power Plants
11.6.5. Construction Machinery
11.6.6. Others
11.7. Industrial Gear Market Size (US$ Mn, Million Units), by Distribution Channel, 2018 - 2030
11.7.1. Online
11.7.2. Offline
11.8. Industrial Gear Market Size (US$ Mn & Million Units) Forecast, by Country & Sub-region, 2018 - 2030
11.8.1. Germany
11.8.2. U.K.
11.8.3. France
11.8.4. Rest of Europe
11.9. Incremental Opportunity Analysis
12. Asia Pacific Industrial Gear Market Analysis and Forecast
12.1. Regional Snapshot
12.1.1. By Product Type
12.1.2. By Application
12.1.3. By Distribution Channel
12.1.4. By Country
12.2. Key Trend Analysis
12.2.1. Demand Side
12.2.2. Supply Side
12.3. Price Trend Analysis
12.3.1. Weighted Average Price
12.3.2. Price Impact-COVID-19
12.4. Impact Analysis of COVID- 19
12.5. Industrial Gear Market Size (US$ Mn, Million Units) Forecast, By Product Type, 2018 - 2030
12.5.1. Spur Gear
12.5.2. Planetary Gear
12.5.3. Helical Gear
12.5.4. Rack and Pinion Gear
12.5.5. Worm Gear
12.5.6. Bevel Gear
12.5.7. Others
12.6. Industrial Gear Market Size (US$ Mn, Million Units), by Application, 2018 - 2030
12.6.1. Oilfield Equipment
12.6.2. Mining Equipment
12.6.3. Industrial Machinery
12.6.4. Power Plants
12.6.5. Construction Machinery
12.6.6. Others
12.7. Industrial Gear Market Size (US$ Mn, Million Units), by Distribution Channel, 2018 - 2030
12.7.1. Online
12.7.2. Offline
12.8. Industrial Gear Market Size (US$ Mn & Million Units) Forecast, by Country & Sub-region, 2018 - 2030
12.8.1. China
12.8.2. India
12.8.3. Japan
12.8.4. South Korea
12.8.5. Rest of Asia Pacific
13. Middle East & Africa Industrial Gear Market Analysis and Forecast
13.1. Regional Snapshot
13.1.1. By Product Type
13.1.2. By Application
13.1.3. By Distribution Channel
13.1.4. By Country
13.2. Key Trend Analysis
13.2.1. Demand Side
13.2.2. Supply Side
13.3. Price Trend Analysis
13.3.1. Weighted Average Price
13.3.2. Price Impact-COVID-19
13.4. Impact Analysis of COVID- 19
13.5. Industrial Gear Market Size (US$ Mn, Million Units) Forecast, By Product Type, 2018 - 2030
13.5.1. Spur Gear
13.5.2. Planetary Gear
13.5.3. Helical Gear
13.5.4. Rack and Pinion Gear
13.5.5. Worm Gear
13.5.6. Bevel Gear
13.5.7. Others
13.6. Industrial Gear Market Size (US$ Mn, Million Units), by Application, 2018 - 2030
13.6.1. Oilfield Equipment
13.6.2. Mining Equipment
13.6.3. Industrial Machinery
13.6.4. Power Plants
13.6.5. Construction Machinery
13.6.6. Others
13.7. Industrial Gear Market Size (US$ Mn, Million Units), by Distribution Channel, 2018 - 2030
13.7.1. Online
13.7.2. Offline
13.8. Industrial Gear Market Size (US$ Mn & Million Units) Forecast, by Country & Sub-region, 2018 - 2030
13.8.1. GCC
13.8.2. South Africa
13.8.3. Rest of Middle East & Africa
13.9. Incremental Opportunity Analysis
14. South America Industrial Gear Market Analysis and Forecast
14.1. Regional Snapshot
14.1.1. By Product Type
14.1.2. By Application
14.1.3. By Distribution Channel
14.1.4. By Country
14.2. Key Trend Analysis
14.2.1. Demand Side
14.2.2. Supply Side
14.3. Price Trend Analysis
14.3.1. Weighted Average Price
14.3.2. Price Impact-COVID-19
14.4. Impact Analysis of COVID- 19
14.5. Industrial Gear Market Size (US$ Mn, Million Units) Forecast, By Product Type, 2018 - 2030
14.5.1. Spur Gear
14.5.2. Planetary Gear
14.5.3. Helical Gear
14.5.4. Rack and Pinion Gear
14.5.5. Worm Gear
14.5.6. Bevel Gear
14.5.7. Others
14.6. Industrial Gear Market Size (US$ Mn, Million Units), by Application, 2018 - 2030
14.6.1. Oilfield Equipment
14.6.2. Mining Equipment
14.6.3. Industrial Machinery
14.6.4. Power Plants
14.6.5. Construction Machinery
14.6.6. Others
14.7. Industrial Gear Market Size (US$ Mn, Million Units), by Distribution Channel, 2018 - 2030
14.7.1. Online
14.7.2. Offline
14.8. Industrial Gear Market Size (US$ Mn & Million Units) Forecast, by Country & Sub-region, 2018 - 2030
14.8.1. Brazil
14.8.2. Rest of South America
14.9. Incremental Opportunity Analysis
15. Competition Landscape
15.1. Market Player – Competition Dashboard
15.2. Company Profiles (Details – Company Overview, Sales Area/Geographical Presence, Revenue, COVID – 19 Response, Strategy & Business Overview)
15.2.1. ABB Ltd
15.2.1.1. Company Overview
15.2.1.2. Sales Area/Geographical Presence
15.2.1.3. Revenue
15.2.1.4. COVID – 19 Response
15.2.1.5. Strategy & Business Overview
15.2.2. Siemens AG
15.2.2.1. Company Overview
15.2.2.2. Sales Area/Geographical Presence
15.2.2.3. Revenue
15.2.2.4. COVID – 19 Response
15.2.2.5. Strategy & Business Overview
15.2.3. Martin Sprocket & Gear, Inc.
15.2.3.1. Company Overview
15.2.3.2. Sales Area/Geographical Presence
15.2.3.3. Revenue
15.2.3.4. COVID – 19 Response
15.2.3.5. Strategy & Business Overview
15.2.4. Hota Industrial Manufacturing Co., Ltd.
15.2.4.1. Company Overview
15.2.4.2. Sales Area/Geographical Presence
15.2.4.3. Revenue
15.2.4.4. COVID – 19 Response
15.2.4.5. Strategy & Business Overview
15.2.5. OKUBO GEAR Co., Ltd.
15.2.5.1. Company Overview
15.2.5.2. Sales Area/Geographical Presence
15.2.5.3. Revenue
15.2.5.4. COVID – 19 Response
15.2.5.5. Strategy & Business Overview
15.2.6. Bharat Gears Ltd.
15.2.6.1. Company Overview
15.2.6.2. Sales Area/Geographical Presence
15.2.6.3. Revenue
15.2.6.4. COVID – 19 Response
15.2.6.5. Strategy & Business Overview
15.2.7. Elecon Engineering Company Limited
15.2.7.1. Company Overview
15.2.7.2. Sales Area/Geographical Presence
15.2.7.3. Revenue
15.2.7.4. COVID – 19 Response
15.2.7.5. Strategy & Business Overview
15.2.8. Precipart Corporation
15.2.8.1. Company Overview
15.2.8.2. Sales Area/Geographical Presence
15.2.8.3. Revenue
15.2.8.4. COVID – 19 Response
15.2.8.5. Strategy & Business Overview
15.2.9. Kohara Gear Industry Co., Ltd.
15.2.9.1. Company Overview
15.2.9.2. Sales Area/Geographical Presence
15.2.9.3. Revenue
15.2.9.4. COVID – 19 Response
15.2.9.5. Strategy & Business Overview
15.2.10. Aero Gear Incorporated
15.2.10.1. Company Overview
15.2.10.2. Sales Area/Geographical Presence
15.2.10.3. Revenue
15.2.10.4. COVID – 19 Response
15.2.10.5. Strategy & Business Overview
15.2.11. Shanthi Gears Limited
15.2.11.1. Company Overview
15.2.11.2. Sales Area/Geographical Presence
15.2.11.3. Revenue
15.2.11.4. COVID – 19 Response
15.2.11.5. Strategy & Business Overview
15.2.12. Ashoka Machine Tools Corporation
15.2.12.1. Company Overview
15.2.12.2. Sales Area/Geographical Presence
15.2.12.3. Revenue
15.2.12.4. COVID – 19 Response
15.2.12.5. Strategy & Business Overview
15.2.13. Cleveland Gear Company Inc.
15.2.13.1. Company Overview
15.2.13.2. Sales Area/Geographical Presence
15.2.13.3. Revenue
15.2.13.4. COVID – 19 Response
15.2.13.5. Strategy & Business Overview
15.2.14. Meritech Group
15.2.14.1. Company Overview
15.2.14.2. Sales Area/Geographical Presence
15.2.14.3. Revenue
15.2.14.4. COVID – 19 Response
15.2.14.5. Strategy & Business Overview
15.2.15. Bevel Gears India Pvt. Ltd.
15.2.15.1. Company Overview
15.2.15.2. Sales Area/Geographical Presence
15.2.15.3. Revenue
15.2.15.4. COVID – 19 Response
15.2.15.5. Strategy & Business Overview
16. Key Takeaways
16.1. Solution to Overcome the Current Situation (COVID-19 Impact)
16.2. Identification of Potential Market Spaces
16.2.1. Product Type
16.2.2. Application
16.2.3. Distribution Channel
16.2.4. Region
List of Tables
Table 1: Global Industrial Gear Market, Volume Size and Forecast, By Product Type, Million Units, 2018 - 2030
Table 2: Global Industrial Gear Market, Value Size and Forecast, By Product Type, US$ Mn, 2018 - 2030
Table 3: Global Industrial Gear Market, Volume Size and Forecast, By Application, Million Units, 2018 - 2030
Table 4: Global Industrial Gear Market, Value Size and Forecast, By Application, US$ Mn, 2018 - 2030
Table 5: Global Industrial Gear Market, Volume Size and Forecast, By Distribution Channel, Million Units, 2018 - 2030
Table 6: Global Industrial Gear Market, Value Size and Forecast, By Distribution Channel, US$ Mn, 2018 - 2030
Table 7: Global Industrial Gear Market, Volume Size and Forecast, By Region, Million Units, 2018 - 2030
Table 8: Global Industrial Gear Market, Value Size and Forecast, By Region, US$ Mn, 2018 - 2030
Table 9: North America Industrial Gear Market, Volume Size and Forecast, By Product Type, Million Units, 2018 - 2030
Table 10: North America Industrial Gear Market, Value Size and Forecast, By Product Type, US$ Mn, 2018 - 2030
Table 11: North America Industrial Gear Market, Volume Size and Forecast, By Application, Million Units, 2018 - 2030
Table 12: North America Industrial Gear Market, Value Size and Forecast, By Application, US$ Mn, 2018 - 2030
Table 13: North America Industrial Gear Market, Volume Size and Forecast, By Distribution Channel, Million Units, 2018 - 2030
Table 14: North America Industrial Gear Market, Value Size and Forecast, By Distribution Channel, US$ Mn, 2018 - 2030
Table 15: North America Industrial Gear Market, Volume Size and Forecast, By Country, Million Units, 2018 - 2030
Table 16: North America Industrial Gear Market, Value Size and Forecast, By Country, US$ Mn, 2018 - 2030
Table 17: Europe Industrial Gear Market, Volume Size and Forecast, By Product Type, Million Units, 2018 - 2030
Table 18: Europe Industrial Gear Market, Value Size and Forecast, By Product Type, US$ Mn, 2018 - 2030
Table 19: Europe Industrial Gear Market, Volume Size and Forecast, By Application, Million Units, 2018 - 2030
Table 20: Europe Industrial Gear Market, Value Size and Forecast, By Application, US$ Mn, 2018 - 2030
Table 21: Europe Industrial Gear Market, Volume Size and Forecast, By Distribution Channel, Million Units, 2018 - 2030
Table 22: Europe Industrial Gear Market, Value Size and Forecast, By Distribution Channel, US$ Mn, 2018 - 2030
Table 23: Europe Industrial Gear Market, Volume Size and Forecast, By Country, Million Units, 2018 - 2030
Table 24: Europe Industrial Gear Market, Value Size and Forecast, By Country, US$ Mn, 2018 - 2030
Table 25: Asia Pacific Industrial Gear Market, Volume Size and Forecast, By Product Type, Million Units, 2018 - 2030
Table 26: Asia Pacific Industrial Gear Market, Value Size and Forecast, By Product Type, US$ Mn, 2018 - 2030
Table 27: Asia Pacific Industrial Gear Market, Volume Size and Forecast, By Application, Million Units, 2018 - 2030
Table 28: Asia Pacific Industrial Gear Market, Value Size and Forecast, By Application, US$ Mn, 2018 - 2030
Table 29: Asia Pacific Industrial Gear Market, Volume Size and Forecast, By Distribution Channel, Million Units, 2018 - 2030
Table 30: Asia Pacific Industrial Gear Market, Value Size and Forecast, By Distribution Channel, US$ Mn, 2018 - 2030
Table 31: Asia Pacific Industrial Gear Market, Volume Size and Forecast, By Country, Million Units, 2018 - 2030
Table 32: Asia Pacific Industrial Gear Market, Value Size and Forecast, By Country, US$ Mn, 2018 - 2030
Table 33: Middle East & Africa Industrial Gear Market, Volume Size and Forecast, By Product Type, Million Units, 2018 - 2030
Table 34: Middle East & Africa Industrial Gear Market, Value Size and Forecast, By Product Type, US$ Mn, 2018 - 2030
Table 35: Middle East & Africa Industrial Gear Market, Volume Size and Forecast, By Application, Million Units, 2018 - 2030
Table 36: Middle East & Africa Industrial Gear Market, Value Size and Forecast, By Application, US$ Mn, 2018 - 2030
Table 37: Middle East & Africa Industrial Gear Market, Volume Size and Forecast, By Distribution Channel, Million Units, 2018 - 2030
Table 38: Middle East & Africa Industrial Gear Market, Value Size and Forecast, By Distribution Channel, US$ Mn, 2018 - 2030
Table 39: Middle East & Africa Industrial Gear Market, Volume Size and Forecast, By Country, Million Units, 2018 - 2030
Table 40: Middle East & Africa Industrial Gear Market, Value Size and Forecast, By Country, US$ Mn, 2018 - 2030
Table 41: South America Industrial Gear Market, Volume Size and Forecast, By Product Type, Million Units, 2018 - 2030
Table 42: South America Industrial Gear Market, Value Size and Forecast, By Product Type, US$ Mn, 2018 - 2030
Table 43: South America Industrial Gear Market, Volume Size and Forecast, By Application, Million Units, 2018 - 2030
Table 44: South America Industrial Gear Market, Value Size and Forecast, By Application, US$ Mn, 2018 - 2030
Table 45: South America Industrial Gear Market, Volume Size and Forecast, By Distribution Channel, Million Units, 2018 - 2030
Table 46: South America Industrial Gear Market, Value Size and Forecast, By Distribution Channel, US$ Mn, 2018 - 2030
Table 47: South America Industrial Gear Market, Volume Size and Forecast, By Country, Million Units, 2018 - 2030
Table 48: South America Industrial Gear Market, Value Size and Forecast, By Country, US$ Mn, 2018 - 2030
List of Figures
Figure 1: Global Industrial Gear Market, Volume Size and Forecast, By Product Type, Million Units, 2018 - 2030
Figure 2: Global Industrial Gear Market, Value Size and Forecast, By Product Type, US$ Mn, 2018 - 2030
Figure 3: Global Industrial Gear Market, Incremental Opportunity, By Product Type, US$ Mn, 2020 - 2030
Figure 4: Global Industrial Gear Market, Volume Size and Forecast, By Application, Million Units, 2018 - 2030
Figure 5: Global Industrial Gear Market, Value Size and Forecast, By Application, US$ Mn, 2018 - 2030
Figure 6: Global Industrial Gear Market, Incremental Opportunity, By Application, US$ Mn, 2020 - 2030
Figure 7: Global Industrial Gear Market, Volume Size and Forecast, By Distribution Channel, Million Units, 2018 - 2030
Figure 8: Global Industrial Gear Market, Value Size and Forecast, By Distribution Channel, US$ Mn, 2018 - 2030
Figure 9: Global Industrial Gear Market, Incremental Opportunity, By Distribution Channel, US$ Mn, 2020 - 2030
Figure 10: Global Industrial Gear Market, Volume Size and Forecast, By Region, Million Units, 2018 - 2030
Figure 11: Global Industrial Gear Market, Value Size and Forecast, By Region, US$ Mn, 2018 - 2030
Figure 12: Global Industrial Gear Market, Incremental Opportunity, By Region, US$ Mn, 2020 - 2030
Figure 13: North America Industrial Gear Market, Volume Size and Forecast, By Product Type, Million Units, 2018 - 2030
Figure 14: North America Industrial Gear Market, Value Size and Forecast, By Product Type, US$ Mn, 2018 - 2030
Figure 15: North America Industrial Gear Market, Incremental Opportunity, By Product Type, US$ Mn, 2020 - 2030
Figure 16: North America Industrial Gear Market, Volume Size and Forecast, By Application, Million Units, 2018 - 2030
Figure 17: North America Industrial Gear Market, Value Size and Forecast, By Application, US$ Mn, 2018 - 2030
Figure 18: North America Industrial Gear Market, Incremental Opportunity, By Application, US$ Mn, 2020 - 2030
Figure 19: North America Industrial Gear Market, Volume Size and Forecast, By Distribution Channel, Million Units, 2018 - 2030
Figure 20: North America Industrial Gear Market, Value Size and Forecast, By Distribution Channel, US$ Mn, 2018 - 2030
Figure 21: North America Industrial Gear Market, Incremental Opportunity, By Distribution Channel, US$ Mn, 2020 - 2030
Figure 22: North America Industrial Gear Market, Volume Size and Forecast, By Country, Million Units, 2018 - 2030
Figure 23: North America Industrial Gear Market, Value Size and Forecast, By Country, US$ Mn, 2018 - 2030
Figure 24: North America Industrial Gear Market, Incremental Opportunity, By Country, US$ Mn, 2020 - 2030
Figure 25: Europe Industrial Gear Market, Volume Size and Forecast, By Product Type, Million Units, 2018 - 2030
Figure 26: Europe Industrial Gear Market, Value Size and Forecast, By Product Type, US$ Mn, 2018 - 2030
Figure 27: Europe Industrial Gear Market, Incremental Opportunity, By Product Type, US$ Mn, 2020 - 2030
Figure 28: Europe Industrial Gear Market, Volume Size and Forecast, By Application, Million Units, 2018 - 2030
Figure 29: Europe Industrial Gear Market, Value Size and Forecast, By Application, US$ Mn, 2018 - 2030
Figure 30: Europe Industrial Gear Market, Incremental Opportunity, By Application, US$ Mn, 2020 - 2030
Figure 31: Europe Industrial Gear Market, Volume Size and Forecast, By Distribution Channel, Million Units, 2018 - 2030
Figure 32: Europe Industrial Gear Market, Value Size and Forecast, By Distribution Channel, US$ Mn, 2018 - 2030
Figure 33: Europe Industrial Gear Market, Incremental Opportunity, By Distribution Channel, US$ Mn, 2020 - 2030
Figure 34: Europe Industrial Gear Market, Volume Size and Forecast, By Country, Million Units, 2018 - 2030
Figure 35: Europe Industrial Gear Market, Value Size and Forecast, By Country, US$ Mn, 2018 - 2030
Figure 36: Europe Industrial Gear Market, Incremental Opportunity, By Country, US$ Mn, 2020 - 2030
Figure 37: Asia Pacific Industrial Gear Market, Volume Size and Forecast, By Product Type, Million Units, 2018 - 2030
Figure 38: Asia Pacific Industrial Gear Market, Value Size and Forecast, By Product Type, US$ Mn, 2018 - 2030
Figure 39: Asia Pacific Industrial Gear Market, Incremental Opportunity, By Product Type, US$ Mn, 2020 - 2030
Figure 40: Asia Pacific Industrial Gear Market, Volume Size and Forecast, By Application, Million Units, 2018 - 2030
Figure 41: Asia Pacific Industrial Gear Market, Value Size and Forecast, By Application, US$ Mn, 2018 - 2030
Figure 42: Asia Pacific Industrial Gear Market, Incremental Opportunity, By Application, US$ Mn, 2020 - 2030
Figure 43: Asia Pacific Industrial Gear Market, Volume Size and Forecast, By Distribution Channel, Million Units, 2018 - 2030
Figure 44: Asia Pacific Industrial Gear Market, Value Size and Forecast, By Distribution Channel, US$ Mn, 2018 - 2030
Figure 45: Asia Pacific Industrial Gear Market, Incremental Opportunity, By Distribution Channel, US$ Mn, 2020 - 2030
Figure 46: Asia Pacific Industrial Gear Market, Volume Size and Forecast, By Country, Million Units, 2018 - 2030
Figure 47: Asia Pacific Industrial Gear Market, Value Size and Forecast, By Country, US$ Mn, 2018 - 2030
Figure 48: Asia Pacific Industrial Gear Market, Incremental Opportunity, By Country, US$ Mn, 2020 - 2030
Figure 49: Middle East & Africa Industrial Gear Market, Volume Size and Forecast, By Product Type, Million Units, 2018 - 2030
Figure 50: Middle East & Africa Industrial Gear Market, Value Size and Forecast, By Product Type, US$ Mn, 2018 - 2030
Figure 51: Middle East & Africa Industrial Gear Market, Incremental Opportunity, By Product Type, US$ Mn, 2020 - 2030
Figure 52: Middle East & Africa Industrial Gear Market, Volume Size and Forecast, By Application, Million Units, 2018 - 2030
Figure 53: Middle East & Africa Industrial Gear Market, Value Size and Forecast, By Application, US$ Mn, 2018 - 2030
Figure 54: Middle East & Africa Industrial Gear Market, Incremental Opportunity, By Application, US$ Mn, 2020 - 2030
Figure 55: Middle East & Africa Industrial Gear Market, Volume Size and Forecast, By Distribution Channel, Million Units, 2018 - 2030
Figure 56: Middle East & Africa Industrial Gear Market, Value Size and Forecast, By Distribution Channel, US$ Mn, 2018 - 2030
Figure 57: Middle East & Africa Industrial Gear Market, Incremental Opportunity, By Distribution Channel, US$ Mn, 2020 - 2030
Figure 58: Middle East & Africa Industrial Gear Market, Volume Size and Forecast, By Country, Million Units, 2018 - 2030
Figure 59: Middle East & Africa Industrial Gear Market, Value Size and Forecast, By Country, US$ Mn, 2018 - 2030
Figure 60: Middle East & Africa Industrial Gear Market, Incremental Opportunity, By Country, US$ Mn, 2020 - 2030
Figure 61: South America Industrial Gear Market, Volume Size and Forecast, By Product Type, Million Units, 2018 - 2030
Figure 62: South America Industrial Gear Market, Value Size and Forecast, By Product Type, US$ Mn, 2018 - 2030
Figure 63: South America Industrial Gear Market, Incremental Opportunity, By Product Type, US$ Mn, 2020 - 2030
Figure 64: South America Industrial Gear Market, Volume Size and Forecast, By Application, Million Units, 2018 - 2030
Figure 65: South America Industrial Gear Market, Value Size and Forecast, By Application, US$ Mn, 2018 - 2030
Figure 66: South America Industrial Gear Market, Incremental Opportunity, By Application, US$ Mn, 2020 - 2030
Figure 67: South America Industrial Gear Market, Volume Size and Forecast, By Distribution Channel, Million Units, 2018 - 2030
Figure 68: South America Industrial Gear Market, Value Size and Forecast, By Distribution Channel, US$ Mn, 2018 - 2030
Figure 69: South America Industrial Gear Market, Incremental Opportunity, By Distribution Channel, US$ Mn, 2020 - 2030
Figure 70: South America Industrial Gear Market, Volume Size and Forecast, By Country, Million Units, 2018 - 2030
Figure 71: South America Industrial Gear Market, Value Size and Forecast, By Country, US$ Mn, 2018 - 2030
Figure 72: South America Industrial Gear Market, Incremental Opportunity, By Country, US$ Mn, 2020 - 2030
Copyright © Transparency Market Research, Inc. All Rights reserved
Trust Online

Europe Industrial Gear Market
