Analysts’ Viewpoint on Global Elevators Market Scenario
Increase in launch of smart elevators is driving the global elevators market. IoT-integrated smart elevators anticipate traffic and respond in real-time. They can be remotely operated or serviced via mobile applications. Rapid urbanization and rise in penetration of internet are also anticipated to propel the market during the forecast period. Elevator manufacturers are introducing cable-less elevators that run on magnetic propulsion and are faster in terms of travel time. Elevator industry trends suggest that product diversity and R&D investments are expected to contribute significantly to the market growth in the near future. The market is also witnessing a surge in demand for advanced integrated products, with additional features such as touch panel control instead of traditional buttons.
Elevator is an electric lift used for vertical transportation of goods and people along floors in buildings. Vacuum pumps, shafts, motors, control units, counterweights, machine drives, and guide rails are major parts of elevators. Building lifts, capsule lifts, hydraulic elevators, pneumatic elevators, passenger lifts, freight elevators, traction elevators/cable-driven elevators, residential elevators, and machine room-less elevators are different types of elevators. Elevators enhance the value of properties and reduce the risk of falls on steps, particularly among children and the elderly. They provide a smooth and comfortable ride from floor to floor. Warehouse freight elevators are installed in commercial buildings and warehouses to assist the transportation of goods between floors.
Elevator industry statistics demonstrate a meteoric rise in elevator usage by over 2 billion people across the globe, as faster and more energy-efficient lifts are making inroads. Cables made from carbon fiber have replaced woven steel cables, as they are more flexible, durable, and have a longer lifecycle than metal cables. The usage of carbon fiber also increases the speed of elevators due to 90% reduction in their weight.
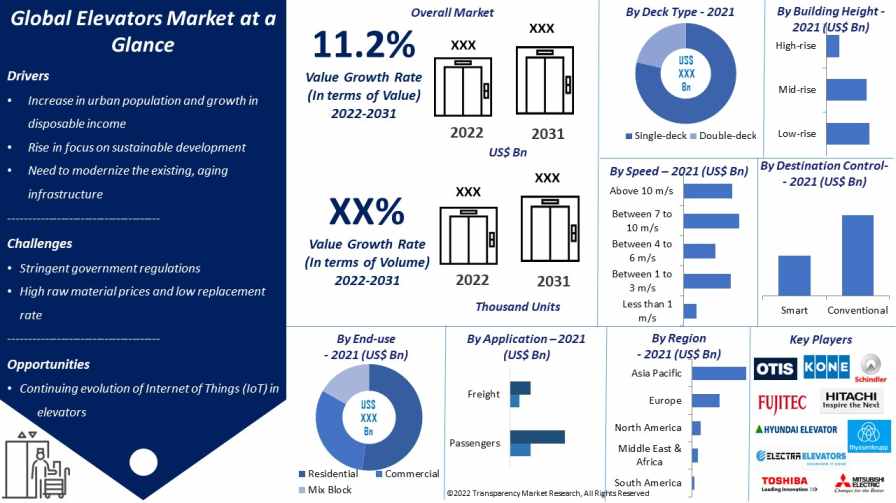
Increase in urban population and growth in disposable income are propelling the residential elevator market size. As of 2021, 4.46 billion people lived in urban areas, a rise from 751 million in 1950. The population is projected to reach 6.68 billion by 2050, with an additional 2.22 billion people shifting to urban areas. Cities such as Beijing, Mumbai, and Tokyo are continually improving their urban planning and building capabilities with robust communication and transportation systems to attract domestic and foreign direct investment. Low-income and lower-middle-income countries are focused on offering affordable housing solutions and efficient management of cities to boost urbanization. These trends are creating a favorable environment for the growth of the global elevators market.
Rise in demand for energy-efficient elevators in green buildings is fueling the global elevators market. Buildings account for a significant portion of energy & resource consumption and emission of greenhouse gases. This has led to a rise in adoption of sustainable building solutions.
Governments across the globe are offering tax benefits for green buildings. This is propelling the demand for smart and energy-efficient building solutions. Smart elevators and escalators are energy-efficient and reduce operational costs. Electric motors installed in these elevators reduce friction by raising counterweights, thereby saving energy. Leadership in Energy and Environmental Design (LEED) certification is a widely recognized emblem of sustainable accomplishment, and many infrastructure projects aspire to achieve it. It has prompted the integration of environment-friendly features such as LED lighting, water-based paint, and recycled building materials in conventional elevators. Market players are also developing recyclable elevator parts to achieve sustainable production goals.
Asia Pacific is expected to dominate the global elevators market during the forecast period. China is the largest market for elevators in terms of new installations, followed by India. Around 60%-65% of new installations occur in these countries. The market in North America and Europe is anticipated to grow at a considerable pace in the near future, due to the rise in demand for mid-rise elevators such as traction elevators in countries such as the U.S., Canada, Germany, France, the U.K., and Italy. The Middle East is projected to be one of the emerging markets for elevators during the forecast period. Rapid growth in the construction sector is expected to boost the installation of smart elevators and escalators in the region.
Manufacturers are significantly investing in R&D activities to enhance their elevator market share. Key players are increasingly adopting strategies such as expansion of product portfolio and merger and acquisitions. Companies are also focusing on IoT integration, as it allows product operators and manufacturers to collect, share, and analyze data of elevators. Otis Elevator Company, KONE OYJ, Schindler, Fujitec, Hitachi Ltd., Hyundai Elevator, Electra Elevator, Mitsubishi Electric Corporation, ThyssenKrupp AG, and Toshiba are the prominent players operating in this market.
Each of these players has been profiled in the global elevators market report based on parameters such as company overview, financial overview, business strategies, product portfolio, business segments, and recent developments.
|
Attribute |
Detail |
|
Market Size Value in 2021 |
US$ 75.23 Bn |
|
Market Forecast Value in 2031 |
US$ 215.31 Bn |
|
Growth Rate (CAGR) |
11.2% |
|
Forecast Period |
2022–2031 |
|
Historical Data Available for |
2017–2020 |
|
Quantitative Units |
US$ Bn for Value & Thousand Units for Volume |
|
Market Analysis |
Includes cross segment analysis at regional as well as country level. Furthermore, qualitative analysis includes drivers, restraints, opportunities, key trends, Porter’s Five Forces analysis, value chain analysis, and key trend analysis. |
|
Competition Landscape |
|
|
Format |
Electronic (PDF) + Excel |
|
Market Segmentation |
|
|
Regions Covered |
|
|
Countries Covered |
|
|
Companies Profiled |
|
|
Customization Scope |
Available upon request |
|
Pricing |
Available upon request |
The global elevators market was valued at US$ 75.23 Bn in 2021
The global elevators market is projected to advance at a CAGR of 11.2% from 2022 to 2031
Rapid urbanization and rise in population are expected to drive the global elevators market during the forecast period
The single-deck segment accounted for significant share of the global market in 2021
North America is likely to be one of the lucrative markets in the next few years
Otis Elevator Company, KONE OYJ, Schindler, Fujitec, Hitachi Ltd., Hyundai Elevator, Electra Elevator, Mitsubishi Electric Corporation, ThyssenKrupp AG, and Toshiba
1. Preface
1.1. Market Definition and Scope
1.2. Market Segmentation
1.3. Key Research Objectives
1.4. Research Highlights
2. Assumptions
3. Research Methodology
4. Executive Summary
5. Market Overview
5.1. Regional Snapshot
5.2. Market Dynamics
5.2.1. Drivers
5.2.2. Restraints
5.2.3. Opportunities
5.3. Key Trends Analysis
5.3.1. Demand Side Analysis
5.3.2. Supply Side Analysis
5.4. Key Market Indicators
5.5. Porter’s Five Forces Analysis
5.6. Value Chain Analysis
5.7. Industry SWOT Analysis
5.8. Regulatory Framework
5.9. Global Elevators Market Analysis and Forecast, 2017 - 2031
5.9.1. Market Revenue Projections (US$ Mn)
5.9.2. Market Revenue Projections (Thousand Units)
6. Global Elevators Market Analysis and Forecast, By Deck Type
6.1. Elevators Market (US$ Mn and Thousand Units) Forecast, By Deck Type, 2017 - 2031
6.1.1. Single-deck
6.1.2. Double-deck
6.2. Incremental Opportunity, By Deck Type
7. Global Elevators Market Analysis and Forecast, By Building Height
7.1. Elevators Market (US$ Mn and Thousand Units) Forecast, By Building Height, 2017 - 2031
7.1.1. Low-rise
7.1.2. Mid-rise
7.1.3. High-rise
7.2. Incremental Opportunity, By Building Height
8. Global Elevators Market Analysis and Forecast, By Speed
8.1. Elevators Market (US$ Mn and Thousand Units) Forecast, By Speed, 2017 - 2031
8.1.1. Less than 1 m/s
8.1.2. Between 1 to 3 m/s
8.1.3. Between 4 to 6 m/s
8.1.4. Between 7 to 10 m/s
8.1.5. Above 10 m/s
8.2. Incremental Opportunity, By Speed
9. Global Elevators Market Analysis and Forecast, By Destination Control
9.1. Elevators Market (US$ Mn and Thousand Units) Forecast, By Destination Control, 2017 - 2031
9.1.1. Smart
9.1.2. Conventional
9.2. Incremental Opportunity, By Destination Control
10. Global Elevators Market Analysis and Forecast, By End-use
10.1. Elevators Market (US$ Mn and Thousand Units) Forecast, By End-use, 2017 - 2031
10.1.1. Residential
10.1.2. Commercial
10.1.3. Mix Block
10.2. Incremental Opportunity, By End-use
11. Global Elevators Market Analysis and Forecast, By Application
11.1. Elevators Market (US$ Mn and Thousand Units) Forecast, By Application, 2017 - 2031
11.1.1. Passenger
11.1.2. Freight
11.2. Incremental Opportunity, By Application
12. Global Elevators Market Analysis and Forecast, by Region
12.1. Elevators Market (US$ Mn and Thousand Units), Region, 2017 - 2031
12.1.1. North America
12.1.2. Europe
12.1.3. Asia Pacific
12.1.4. Middle East & Africa
12.1.5. South America
12.2. Incremental Opportunity, by Region
13. North America Elevators Market Analysis and Forecast
13.1. Regional Snapshot
13.2. Price Trend Analysis
13.2.1. Weighted Average Selling Price (US$)
13.3. Key Trends Analysis
13.3.1. Demand Side
13.3.2. Supply Side
13.4. Key Supplier Analysis
13.5. Elevators Market (US$ Mn and Thousand Units) Forecast, By Deck Type, 2017 - 2031
13.5.1. Single-deck
13.5.2. Double-deck
13.6. Elevators Market (US$ Mn and Thousand Units) Forecast, By Building Height, 2017 - 2031
13.6.1. Low-rise
13.6.2. Mid-rise
13.6.3. High-rise
13.7. Elevators Market (US$ Mn and Thousand Units) Forecast, By Speed, 2017 - 2031
13.7.1. Less than 1 m/s
13.7.2. Between 1 to 3 m/s
13.7.3. Between 4 to 6 m/s
13.7.4. Between 7 to 10 m/s
13.7.5. Above 10 m/s
13.8. Elevators Market (US$ Mn and Thousand Units) Forecast, By Destination Control, 2017 - 2031
13.8.1. Smart
13.8.2. Conventional
13.9. Elevators Market (US$ Mn and Thousand Units) Forecast, By End-use, 2017 - 2031
13.9.1. Residential
13.9.2. Commercial
13.9.3. Mix Block
13.10. Elevators Market (US$ Mn and Thousand Units) Forecast, By Application, 2017 - 2031
13.10.1. Passenger
13.10.2. Freight
13.11. Elevators Market (US$ Mn and Thousand Units) Forecast, By Country & Sub-region, 2017 - 2031
13.11.1. U.S.
13.11.2. Canada
13.11.3. Rest of North America
13.12. Incremental Opportunity Analysis
14. Europe Elevators Market Analysis and Forecast
14.1. Regional Snapshot
14.2. Price Trend Analysis
14.2.1. Weighted Average Selling Price (US$)
14.3. Key Trends Analysis
14.3.1. Demand Side
14.3.2. Supply Side
14.4. Key Supplier Analysis
14.5. Elevators Market (US$ Mn and Thousand Units) Forecast, By Deck Type, 2017 - 2031
14.5.1. Single-deck
14.5.2. Double-deck
14.6. Elevators Market (US$ Mn and Thousand Units) Forecast, By Building Height, 2017 - 2031
14.6.1. Low-rise
14.6.2. Mid-rise
14.6.3. High-rise
14.7. Elevators Market (US$ Mn and Thousand Units) Forecast, By Speed, 2017 - 2031
14.7.1. Less than 1 m/s
14.7.2. Between 1 to 3 m/s
14.7.3. Between 4 to 6 m/s
14.7.4. Between 7 to 10 m/s
14.7.5. Above 10 m/s
14.8. Elevators Market (US$ Mn and Thousand Units) Forecast, By Destination Control, 2017 - 2031
14.8.1. Smart
14.8.2. Conventional
14.9. Elevators Market (US$ Mn and Thousand Units) Forecast, By End-use, 2017 - 2031
14.9.1. Residential
14.9.2. Commercial
14.9.3. Mix Block
14.10. Elevators Market (US$ Mn and Thousand Units) Forecast, By Application, 2017 - 2031
14.10.1. Passenger
14.10.2. Freight
14.11. Elevators Market (US$ Mn and Thousand Units) Forecast, By Country & Sub-region, 2017 - 2031
14.11.1. U.K
14.11.2. Germany
14.11.3. France
14.11.4. Italy
14.11.5. Rest of Europe
14.12. Incremental Opportunity Analysis
15. Asia Pacific Elevators Market Analysis and Forecast
15.1. Regional Snapshot
15.2. Price Trend Analysis
15.2.1. Weighted Average Selling Price (US$)
15.3. Key Trends Analysis
15.3.1. Demand Side
15.3.2. Supply Side
15.4. Key Supplier Analysis
15.5. Elevators Market (US$ Mn and Thousand Units) Forecast, By Deck Type, 2017 - 2031
15.5.1. Single-deck
15.5.2. Double-deck
15.6. Elevators Market (US$ Mn and Thousand Units) Forecast, By Building Height, 2017 - 2031
15.6.1. Low-rise
15.6.2. Mid-rise
15.6.3. High-rise
15.7. Elevators Market (US$ Mn and Thousand Units) Forecast, By Speed, 2017 - 2031
15.7.1. Less than 1 m/s
15.7.2. Between 1 to 3 m/s
15.7.3. Between 4 to 6 m/s
15.7.4. Between 7 to 10 m/s
15.7.5. Above 10 m/s
15.8. Elevators Market (US$ Mn and Thousand Units) Forecast, By Destination Control, 2017 - 2031
15.8.1. Smart
15.8.2. Conventional
15.9. Elevators Market (US$ Mn and Thousand Units) Forecast, By End-use, 2017 - 2031
15.9.1. Residential
15.9.2. Commercial
15.9.3. Mix Block
15.10. Elevators Market (US$ Mn and Thousand Units) Forecast, By Application, 2017 - 2031
15.10.1. Passenger
15.10.2. Freight
15.11. Elevators Market (US$ Mn and Thousand Units) Forecast, By Country & Sub-region, 2017 - 2031
15.11.1. China
15.11.2. India
15.11.3. Japan
15.11.4. Rest of Asia Pacific
15.12. Incremental Opportunity Analysis
16. Middle East & Africa Elevators Market Analysis and Forecast
16.1. Regional Snapshot
16.2. Price Trend Analysis
16.2.1. Weighted Average Selling Price (US$)
16.3. Key Trends Analysis
16.3.1. Demand Side
16.3.2. Supply Side
16.4. Key Supplier Analysis
16.5. Elevators Market (US$ Mn and Thousand Units) Forecast, By Deck Type, 2017 - 2031
16.5.1. Single-deck
16.5.2. Double-deck
16.6. Elevators Market (US$ Mn and Thousand Units) Forecast, By Building Height, 2017 - 2031
16.6.1. Low-rise
16.6.2. Mid-rise
16.6.3. High-rise
16.7. Elevators Market (US$ Mn and Thousand Units) Forecast, By Speed, 2017 - 2031
16.7.1. Less than 1 m/s
16.7.2. Between 1 to 3 m/s
16.7.3. Between 4 to 6 m/s
16.7.4. Between 7 to 10 m/s
16.7.5. Above 10 m/s
16.8. Elevators Market (US$ Mn and Thousand Units) Forecast, By Destination Control, 2017 - 2031
16.8.1. Smart
16.8.2. Conventional
16.9. Elevators Market (US$ Mn and Thousand Units) Forecast, By End-use, 2017 - 2031
16.9.1. Residential
16.9.2. Commercial
16.9.3. Mix Block
16.10. Elevators Market (US$ Mn and Thousand Units) Forecast, By Application, 2017 - 2031
16.10.1. Passenger
16.10.2. Freight
16.11. Elevators Market (US$ Mn and Thousand Units) Forecast, By Country & Sub-region, 2017 - 2031
16.11.1. GCC
16.11.2. South Africa
16.11.3. Rest of Middle East & Africa
16.12. Incremental Opportunity Analysis
17. South America Elevators Market Analysis and Forecast
17.1. Regional Snapshot
17.2. Price Trend Analysis
17.2.1. Weighted Average Selling Price (US$)
17.3. Key Trends Analysis
17.3.1. Demand Side
17.3.2. Supply Side
17.4. Key Supplier Analysis
17.5. Elevators Market (US$ Mn and Thousand Units) Forecast, By Deck Type, 2017 - 2031
17.5.1. Single-deck
17.5.2. Double-deck
17.6. Elevators Market (US$ Mn and Thousand Units) Forecast, By Building Height, 2017 - 2031
17.6.1. Low-rise
17.6.2. Mid-rise
17.6.3. High-rise
17.7. Elevators Market (US$ Mn and Thousand Units) Forecast, By Speed, 2017 - 2031
17.7.1. Less than 1 m/s
17.7.2. Between 1 to 3 m/s
17.7.3. Between 4 to 6 m/s
17.7.4. Between 7 to 10 m/s
17.7.5. Above 10 m/s
17.8. Elevators Market (US$ Mn and Thousand Units) Forecast, By Destination Control, 2017 - 2031
17.8.1. Smart
17.8.2. Conventional
17.9. Elevators Market (US$ Mn and Thousand Units) Forecast, By End-use, 2017 - 2031
17.9.1. Residential
17.9.2. Commercial
17.9.3. Mix Block
17.10. Elevators Market (US$ Mn and Thousand Units) Forecast, By Application, 2017 - 2031
17.10.1. Passenger
17.10.2. Freight
17.11. Elevators Market (US$ Mn and Thousand Units) Forecast, By Country & Sub-region, 2017 - 2031
17.11.1. Brazil
17.11.2. Rest of South America
17.12. Incremental Opportunity Analysis
18. Competition Landscape
18.1. Market Player – Competition Dashboard
18.2. Market Revenue Share Analysis (%), By Company, (2021)
18.3. Company Profiles (Details – Company Overview, Sales Area/Geographical Presence, Revenue, Strategy & Business Overview)
18.3.1. Otis Elevator Company
18.3.1.1. Company Overview
18.3.1.2. Sales Area/Geographical Presence
18.3.1.3. Revenue
18.3.1.4. Strategy & Business Overview
18.3.2. KONE Oyj
18.3.2.1. Company Overview
18.3.2.2. Sales Area/Geographical Presence
18.3.2.3. Revenue
18.3.2.4. Strategy & Business Overview
18.3.3. Schindler
18.3.3.1. Company Overview
18.3.3.2. Sales Area/Geographical Presence
18.3.3.3. Revenue
18.3.3.4. Strategy & Business Overview
18.3.4. Fujitec Co., Ltd.
18.3.4.1. Company Overview
18.3.4.2. Sales Area/Geographical Presence
18.3.4.3. Revenue
18.3.4.4. Strategy & Business Overview
18.3.5. Hitachi, Ltd.
18.3.5.1. Company Overview
18.3.5.2. Sales Area/Geographical Presence
18.3.5.3. Revenue
18.3.5.4. Strategy & Business Overview
18.3.6. Hyundai Elevator Co., Ltd.
18.3.6.1. Company Overview
18.3.6.2. Sales Area/Geographical Presence
18.3.6.3. Revenue
18.3.6.4. Strategy & Business Overview
18.3.7. Electra Elevators
18.3.7.1. Company Overview
18.3.7.2. Sales Area/Geographical Presence
18.3.7.3. Revenue
18.3.7.4. Strategy & Business Overview
18.3.8. Mitsubishi Electric Corporation
18.3.8.1. Company Overview
18.3.8.2. Sales Area/Geographical Presence
18.3.8.3. Revenue
18.3.8.4. Strategy & Business Overview
18.3.9. ThyssenKrupp AG
18.3.9.1. Company Overview
18.3.9.2. Sales Area/Geographical Presence
18.3.9.3. Revenue
18.3.9.4. Strategy & Business Overview
18.3.10. Toshiba Corporation
18.3.10.1. Company Overview
18.3.10.2. Sales Area/Geographical Presence
18.3.10.3. Revenue
18.3.10.4. Strategy & Business Overview
19. Key Takeaway
19.1. Identification of Potential Market Spaces
19.1.1. Deck Type
19.1.2. Building Height
19.1.3. Speed
19.1.4. Destination Control
19.1.5. End-use
19.1.6. Application
19.1.7. Region
19.2. Prevailing Market Risks
List of Tables
Table 1: Global Elevators Market Volume (Thousand Units) by Deck Type, 2017 - 2031
Table 2: Global Elevators Market Value (US$ Mn) by Deck Type, 2017 - 2031
Table 3: Global Elevators Market Volume (Thousand Units) by Building Height, 2017 - 2031
Table 4: Global Elevators Market Value (US$ Mn) by Building Height, 2017 - 2031
Table 5: Global Elevators Market Volume (Thousand Units) by Speed, 2017 - 2031
Table 6: Global Elevators Market Value (US$ Mn) by Speed, 2017 - 2031
Table 7: Global Elevators Market Volume (Thousand Units) by Destination Control, 2017 - 2031
Table 8: Global Elevators Market Value (US$ Mn) by Destination Control, 2017 - 2031
Table 9: Global Elevators Market Volume (Thousand Units)by End-use, 2017 - 2031
Table 10: Global Elevators Market Value (US$ Mn)by End-use, 2017 - 2031
Table 11: Global Elevators Market Volume (Thousand Units) by Application, 2017 - 2031
Table 12: Global Elevators Market Value (US$ Mn) by Application, 2017 - 2031
Table 13: Global Elevators Market Volume (Thousand Units) by Region, 2017 - 2031
Table 14: Global Elevators Market Value (US$ Mn) by Region, 2017 - 2031
Table 15: North America Elevators Market Volume (Thousand Units) by Deck Type, 2017 - 2031
Table 16: North America Elevators Market Value (US$ Mn) by Deck Type, 2017 - 2031
Table 17: North America Elevators Market Volume (Thousand Units) by Building Height, 2017 - 2031
Table 18: North America Elevators Market Value (US$ Mn) by Building Height, 2017 - 2031
Table 19: North America Elevators Market Volume (Thousand Units) by Speed, 2017 - 2031
Table 20: North America Elevators Market Value (US$ Mn) by Speed, 2017 - 2031
Table 21: North America Elevators Market Volume (Thousand Units) by Destination Control, 2017 - 2031
Table 22: North America Elevators Market Value (US$ Mn) by Destination Control, 2017 - 2031
Table 23: North America Elevators Market Volume (Thousand Units)by End-use, 2017 - 2031
Table 24: North America Elevators Market Value (US$ Mn)by End-use, 2017 - 2031
Table 25: North America Elevators Market Volume (Thousand Units) by Application, 2017 - 2031
Table 26: North America Elevators Market Value (US$ Mn) by Application, 2017 - 2031
Table 27: North America Elevators Market Volume (Thousand Units) by Region, 2017 - 2031
Table 28: North America Elevators Market Value (US$ Mn) by Region, 2017 - 2031
Table 29: Europe Elevators Market Volume (Thousand Units) by Deck Type, 2017 - 2031
Table 30: Europe Elevators Market Value (US$ Mn) by Deck Type, 2017 - 2031
Table 31: Europe Elevators Market Volume (Thousand Units) by Building Height, 2017 - 2031
Table 32: Europe Elevators Market Value (US$ Mn) by Building Height, 2017 - 2031
Table 33: Europe Elevators Market Volume (Thousand Units) by Speed, 2017 - 2031
Table 34: Europe Elevators Market Value (US$ Mn) by Speed, 2017 - 2031
Table 35: Europe Elevators Market Volume (Thousand Units) by Destination Control, 2017 - 2031
Table 36: Europe Elevators Market Value (US$ Mn) by Destination Control, 2017 - 2031
Table 37: Europe Elevators Market Volume (Thousand Units)by End-use, 2017 - 2031
Table 38: Europe Elevators Market Value (US$ Mn)by End-use, 2017 - 2031
Table 39: Europe Elevators Market Volume (Thousand Units) by Application, 2017 - 2031
Table 40: Europe Elevators Market Value (US$ Mn) by Application, 2017 - 2031
Table 41: Europe Elevators Market Volume (Thousand Units) by Region, 2017 - 2031
Table 42: Europe Elevators Market Value (US$ Mn) by Region, 2017 - 2031
Table 43: APAC Elevators Market Volume (Thousand Units) by Deck Type, 2017 - 2031
Table 44: APAC Elevators Market Value (US$ Mn) by Deck Type, 2017 - 2031
Table 45: APAC Elevators Market Volume (Thousand Units) by Building Height, 2017 - 2031
Table 46: APAC Elevators Market Value (US$ Mn) by Building Height, 2017 - 2031
Table 47: APAC Elevators Market Volume (Thousand Units) by Speed, 2017 - 2031
Table 48: APAC Elevators Market Value (US$ Mn) by Speed, 2017 - 2031
Table 49: APAC Elevators Market Volume (Thousand Units) by Destination Control, 2017 - 2031
Table 50: APAC Elevators Market Value (US$ Mn) by Destination Control, 2017 - 2031
Table 51: APAC Elevators Market Volume (Thousand Units)by End-use, 2017 - 2031
Table 52: APAC Elevators Market Value (US$ Mn)by End-use, 2017 - 2031
Table 53: APAC Elevators Market Volume (Thousand Units) by Application, 2017 - 2031
Table 54: APAC Elevators Market Value (US$ Mn) by Application, 2017 - 2031
Table 55: APAC Elevators Market Volume (Thousand Units) by Region, 2017 - 2031
Table 56: APAC Elevators Market Value (US$ Mn) by Region, 2017 - 2031
Table 57: MEA Elevators Market Volume (Thousand Units) by Deck Type, 2017 - 2031
Table 58: MEA Elevators Market Value (US$ Mn) by Deck Type, 2017 - 2031
Table 59: MEA Elevators Market Volume (Thousand Units) by Building Height, 2017 - 2031
Table 60: MEA Elevators Market Value (US$ Mn) by Building Height, 2017 - 2031
Table 61: MEA Elevators Market Volume (Thousand Units) by Speed, 2017 - 2031
Table 62: MEA Elevators Market Value (US$ Mn) by Speed, 2017 - 2031
Table 63: MEA Elevators Market Volume (Thousand Units) by Destination Control, 2017 - 2031
Table 64: MEA Elevators Market Value (US$ Mn) by Destination Control, 2017 - 2031
Table 65: MEA Elevators Market Volume (Thousand Units)by End-use, 2017 - 2031
Table 66: MEA Elevators Market Value (US$ Mn)by End-use, 2017 - 2031
Table 67: MEA Elevators Market Volume (Thousand Units) by Application, 2017 - 2031
Table 68: MEA Elevators Market Value (US$ Mn) by Application, 2017 - 2031
Table 69: MEA Elevators Market Volume (Thousand Units) by Region, 2017 - 2031
Table 70: MEA Elevators Market Value (US$ Mn) by Region, 2017 - 2031
Table 71: South America Elevators Market Volume (Thousand Units) by Deck Type, 2017 - 2031
Table 72: South America Elevators Market Value (US$ Mn) by Deck Type, 2017 - 2031
Table 73: South America Elevators Market Volume (Thousand Units) by Building Height, 2017 - 2031
Table 74: South America Elevators Market Value (US$ Mn) by Building Height, 2017 - 2031
Table 75: South America Elevators Market Volume (Thousand Units) by Speed, 2017 - 2031
Table 76: South America Elevators Market Value (US$ Mn) by Speed, 2017 - 2031
Table 77: South America Elevators Market Volume (Thousand Units) by Destination Control, 2017 - 2031
Table 78: South America Elevators Market Value (US$ Mn) by Destination Control, 2017 - 2031
Table 79: South America Elevators Market Volume (Thousand Units)by End-use, 2017 - 2031
Table 80: South America Elevators Market Value (US$ Mn)by End-use, 2017 - 2031
Table 81: South America Elevators Market Volume (Thousand Units) by Application, 2017 - 2031
Table 82: South America Elevators Market Value (US$ Mn) by Application, 2017 - 2031
Table 83: South America Elevators Market Volume (Thousand Units) by Region, 2017 - 2031
Table 84: South America Elevators Market Value (US$ Mn) by Region, 2017 - 2031
List of Figures
Figure 1: Global Elevators Market Volume (Thousand Units) by Deck Type, 2017 - 2031
Figure 2: Global Elevators Market Value (US$ Mn) by Deck Type, 2017 - 2031
Figure 3: Global Elevators Market Incremental Opportunity by Deck Type, Forecast 2022 - 2031
Figure 4: Global Elevators Market Volume (Thousand Units) by Building Height, 2017 - 2031
Figure 5: Global Elevators Market Value (US$ Mn) by Building Height, 2017 - 2031
Figure 6: Global Elevators Market Incremental Opportunity by Building Height, Forecast 2022 - 2031
Figure 7: Global Elevators Market Volume (Thousand Units) by Speed, 2017 - 2031
Figure 8: Global Elevators Market Value (US$ Mn) by Speed, 2017 - 2031
Figure 9: Global Elevators Market Incremental Opportunity by Speed, Forecast, 2022 - 2031
Figure 10: Global Elevators Market Volume (Thousand Units) by Destination Control, 2017 - 2031
Figure 11: Global Elevators Market Value (US$ Mn) by Destination Control, 2017 - 2031
Figure 12: Global Elevators Market Incremental Opportunity by Destination Control, Forecast 2022 - 2031
Figure 13: Global Elevators Market Volume (Thousand Units)by End-use, 2017 - 2031
Figure 14: Global Elevators Market Value (US$ Mn)by End-use, 2017 - 2031
Figure 15: Global Elevators Market Incremental Opportunity by End-use, Forecast 2022 - 2031
Figure 16: Global Elevators Market Volume (Thousand Units) by Application, 2017 - 2031
Figure 17: Global Elevators Market Value (US$ Mn) by Application, 2017 - 2031
Figure 18: Global Elevators Market Incremental Opportunity by Application, Forecast 2022 - 2031
Figure 19: Global Elevators Market Volume (Thousand Units) by Region, 2017 - 2031
Figure 20: Global Elevators Market Value (US$ Mn) by Region, 2017 - 2031
Figure 21: Global Elevators Market Incremental Opportunity by Region, Forecast 2022 - 2031
Figure 22: North America Elevators Market Volume (Thousand Units) by Deck Type, 2017 - 2031
Figure 23: North America Elevators Market Value (US$ Mn) by Deck Type, 2017 - 2031
Figure 24: North America Elevators Market Incremental Opportunity by Deck Type, Forecast 2022 - 2031
Figure 25: North America Elevators Market Volume (Thousand Units) by Building Height, 2017 - 2031
Figure 26: North America Elevators Market Value (US$ Mn) by Building Height, 2017 - 2031
Figure 27: North America Elevators Market Incremental Opportunity by Building Height, Forecast 2022 - 2031
Figure 28: North America Elevators Market Volume (Thousand Units) by Speed, 2017 - 2031
Figure 29: North America Elevators Market Value (US$ Mn) by Speed, 2017 - 2031
Figure 30: North America Elevators Market Incremental Opportunity by Speed, Forecast, 2022 - 2031
Figure 31: North America Elevators Market Volume (Thousand Units) by Destination Control, 2017 - 2031
Figure 32: North America Elevators Market Value (US$ Mn) by Destination Control, 2017 - 2031
Figure 33: North America Elevators Market Incremental Opportunity by Destination Control, Forecast 2022 - 2031
Figure 34: North America Elevators Market Volume (Thousand Units)by End-use, 2017 - 2031
Figure 35: North America Elevators Market Value (US$ Mn)by End-use, 2017 - 2031
Figure 36: North America Elevators Market Incremental Opportunity by End-use, Forecast 2022 - 2031
Figure 37: North America Elevators Market Volume (Thousand Units) by Application, 2017 - 2031
Figure 38: North America Elevators Market Value (US$ Mn) by Application, 2017 - 2031
Figure 39: North America Elevators Market Incremental Opportunity by Application, Forecast 2022 - 2031
Figure 40: North America Elevators Market Volume (Thousand Units) by Region, 2017 - 2031
Figure 41: North America Elevators Market Value (US$ Mn) by Region, 2017 - 2031
Figure 42: North America Elevators Market Incremental Opportunity by Region, Forecast 2022 - 2031
Figure 43: Europe Elevators Market Volume (Thousand Units) by Deck Type, 2017 - 2031
Figure 44: Europe Elevators Market Value (US$ Mn) by Deck Type, 2017 - 2031
Figure 45: Europe Elevators Market Incremental Opportunity by Deck Type, Forecast 2022 - 2031
Figure 46: Europe Elevators Market Volume (Thousand Units) by Building Height, 2017 - 2031
Figure 47: Europe Elevators Market Value (US$ Mn) by Building Height, 2017 - 2031
Figure 48: Europe Elevators Market Incremental Opportunity by Building Height, Forecast 2022 - 2031
Figure 49: Europe Elevators Market Volume (Thousand Units) by Speed, 2017 - 2031
Figure 50: Europe Elevators Market Value (US$ Mn) by Speed, 2017 - 2031
Figure 51: Europe Elevators Market Incremental Opportunity by Speed, Forecast, 2022 - 2031
Figure 52: Europe Elevators Market Volume (Thousand Units) by Destination Control, 2017 - 2031
Figure 53: Europe Elevators Market Value (US$ Mn) by Destination Control, 2017 - 2031
Figure 54: Europe Elevators Market Incremental Opportunity by Destination Control, Forecast 2022 - 2031
Figure 55: Europe Elevators Market Volume (Thousand Units)by End-use, 2017 - 2031
Figure 56: Europe Elevators Market Value (US$ Mn)by End-use, 2017 - 2031
Figure 57: Europe Elevators Market Incremental Opportunity by End-use, Forecast 2022 - 2031
Figure 58: Europe Elevators Market Volume (Thousand Units) by Application, 2017 - 2031
Figure 59: Europe Elevators Market Value (US$ Mn) by Application, 2017 - 2031
Figure 60: Europe Elevators Market Incremental Opportunity by Application, Forecast 2022 - 2031
Figure 61: Europe Elevators Market Volume (Thousand Units) by Region, 2017 - 2031
Figure 62: Europe Elevators Market Value (US$ Mn) by Region, 2017 - 2031
Figure 63: Europe Elevators Market Incremental Opportunity by Region, Forecast 2022 - 2031
Figure 64: APAC Elevators Market Volume (Thousand Units) by Deck Type, 2017 - 2031
Figure 65: APAC Elevators Market Value (US$ Mn) by Deck Type, 2017 - 2031
Figure 66: APAC Elevators Market Incremental Opportunity by Deck Type, Forecast 2022 - 2031
Figure 67: APAC Elevators Market Volume (Thousand Units) by Building Height, 2017 - 2031
Figure 68: APAC Elevators Market Value (US$ Mn) by Building Height, 2017 - 2031
Figure 69: APAC Elevators Market Incremental Opportunity by Building Height, Forecast 2022 - 2031
Figure 70: APAC Elevators Market Volume (Thousand Units) by Speed, 2017 - 2031
Figure 71: APAC Elevators Market Value (US$ Mn) by Speed, 2017 - 2031
Figure 72: APAC Elevators Market Incremental Opportunity by Speed, Forecast, 2022 - 2031
Figure 73: APAC Elevators Market Volume (Thousand Units) by Destination Control, 2017 - 2031
Figure 74: APAC Elevators Market Value (US$ Mn) by Destination Control, 2017 - 2031
Figure 75: APAC Elevators Market Incremental Opportunity by Destination Control, Forecast 2022 - 2031
Figure 76: APAC Elevators Market Volume (Thousand Units)by End-use, 2017 - 2031
Figure 77: APAC Elevators Market Value (US$ Mn)by End-use, 2017 - 2031
Figure 78: APAC Elevators Market Incremental Opportunity by End-use, Forecast 2022 - 2031
Figure 79: APAC Elevators Market Volume (Thousand Units) by Application, 2017 - 2031
Figure 80: APAC Elevators Market Value (US$ Mn) by Application, 2017 - 2031
Figure 81: APAC Elevators Market Incremental Opportunity by Application, Forecast 2022 - 2031
Figure 82: APAC Elevators Market Volume (Thousand Units) by Region, 2017 - 2031
Figure 83: APAC Elevators Market Value (US$ Mn) by Region, 2017 - 2031
Figure 84: APAC Elevators Market Incremental Opportunity by Region, Forecast 2022 - 2031
Figure 85: MEA Elevators Market Volume (Thousand Units) by Deck Type, 2017 - 2031
Figure 86: MEA Elevators Market Value (US$ Mn) by Deck Type, 2017 - 2031
Figure 87: MEA Elevators Market Incremental Opportunity by Deck Type, Forecast 2022 - 2031
Figure 88: MEA Elevators Market Volume (Thousand Units) by Building Height, 2017 - 2031
Figure 89: MEA Elevators Market Value (US$ Mn) by Building Height, 2017 - 2031
Figure 90: MEA Elevators Market Incremental Opportunity by Building Height, Forecast 2022 - 2031
Figure 91: MEA Elevators Market Volume (Thousand Units) by Speed, 2017 - 2031
Figure 92: MEA Elevators Market Value (US$ Mn) by Speed, 2017 - 2031
Figure 93: MEA Elevators Market Incremental Opportunity by Speed, Forecast, 2022 - 2031
Figure 94: MEA Elevators Market Volume (Thousand Units) by Destination Control, 2017 - 2031
Figure 95: MEA Elevators Market Value (US$ Mn) by Destination Control, 2017 - 2031
Figure 96: MEA Elevators Market Incremental Opportunity by Destination Control, Forecast 2022 - 2031
Figure 97: MEA Elevators Market Volume (Thousand Units)by End-use, 2017 - 2031
Figure 98: MEA Elevators Market Value (US$ Mn)by End-use, 2017 - 2031
Figure 99: MEA Elevators Market Incremental Opportunity by End-use, Forecast 2022 - 2031
Figure 100: MEA Elevators Market Volume (Thousand Units) by Application, 2017 - 2031
Figure 101: MEA Elevators Market Value (US$ Mn) by Application, 2017 - 2031
Figure 102: MEA Elevators Market Incremental Opportunity by Application, Forecast 2022 - 2031
Figure 103: MEA Elevators Market Volume (Thousand Units) by Region, 2017 - 2031
Figure 104: MEA Elevators Market Value (US$ Mn) by Region, 2017 - 2031
Figure 105: MEA Elevators Market Incremental Opportunity by Region, Forecast 2022 - 2031
Figure 106: South America Elevators Market Volume (Thousand Units) by Deck Type, 2017 - 2031
Figure 107: South America Elevators Market Value (US$ Mn) by Deck Type, 2017 - 2031
Figure 108: South America Elevators Market Incremental Opportunity by Deck Type, Forecast 2022 - 2031
Figure 109: South America Elevators Market Volume (Thousand Units) by Building Height, 2017 - 2031
Figure 110: South America Elevators Market Value (US$ Mn) by Building Height, 2017 - 2031
Figure 111: South America Elevators Market Incremental Opportunity by Building Height, Forecast 2022 - 2031
Figure 112: South America Elevators Market Volume (Thousand Units) by Speed, 2017 - 2031
Figure 113: South America Elevators Market Value (US$ Mn) by Speed, 2017 - 2031
Figure 114: South America Elevators Market Incremental Opportunity by Speed, Forecast, 2022 - 2031
Figure 115: South America Elevators Market Volume (Thousand Units) by Destination Control, 2017 - 2031
Figure 116: South America Elevators Market Value (US$ Mn) by Destination Control, 2017 - 2031
Figure 117: South America Elevators Market Incremental Opportunity by Destination Control, Forecast 2022 - 2031
Figure 118: South America Elevators Market Volume (Thousand Units)by End-use, 2017 - 2031
Figure 119: South America Elevators Market Value (US$ Mn)by End-use, 2017 - 2031
Figure 120: South America Elevators Market Incremental Opportunity by End-use, Forecast 2022 - 2031
Figure 121: South America Elevators Market Volume (Thousand Units) by Application, 2017 - 2031
Figure 122: South America Elevators Market Value (US$ Mn) by Application, 2017 - 2031
Figure 123: South America Elevators Market Incremental Opportunity by Application, Forecast 2022 - 2031
Figure 124: South America Elevators Market Volume (Thousand Units) by Region, 2017 - 2031
Figure 125: South America Elevators Market Value (US$ Mn) by Region, 2017 - 2031
Figure 126: South America Elevators Market Incremental Opportunity by Region, Forecast 2022 - 2031
Copyright © Transparency Market Research, Inc. All Rights reserved
Trust Online

Elevators Market
