Path-breaking innovations in multi-purpose communications are steering growth of the distributed antenna system (DAS) market. Since sports is one of the key sources of entertainment for individuals, manufacturers in the market for distributed antenna systems are increasing efficacy in multi-standard and multi-technology resources to give rise to technologically-sound stadiums. Currently, stadiums & arenas segment dominate the highest revenue among all end users in the distributed antenna system market. This end user segment is expected to reach a value of ~US$ 2.3 Bn by the end of 2020. Hence, manufacturers are increasing R&D to deploy high-density Wi-Fi mobile coverage to enhance fan experience.
Companies in the distributed antenna system (DAS) market are deploying multi-operator and multi-technology resources in building designs to accommodate various elements of the mobile operator’s equipment. Thus, vendors are making this possible by increasing the availability of hybrid active/passive distributed antenna systems.
The distributed antenna system (DAS) market is witnessing change with the introduction of cloud collaboration. For instance, in April 2019, in-building equipment and services provider Advanced RF Technologies, Inc., announced a cloud collaboration with heterogeneous network planning specialist Ranplan Wireless, through the Collaboration-Hub platform. Cloud collaboration is an innovative concept in the market for distributed antenna systems, which helps companies to gain greater control over their IP (Intellectual Property). Thus, access over network modeling and design software becomes easier for network engineers.
The trend of cloud collaboration is helping to strengthen public safety, especially in the transportation sector. As such, public safety DAS is projected for exponential growth during the forecast period. The public safety DAS segment of the distributed antenna system (DAS) market is estimated to reach a value of ~US$ 6.6 Bn by 2027. Manufacturers in the distributed antenna system (DAS) market are increasing the availability of wireless connectivity to unlock the potential of LTE and 5G systems. Proliferation of 5G and integration of IoT for in-building designs are key drivers that are catalyzing market growth.
An increase of passengers has triggered the demand for distributed antenna systems. Growing demand for seamless mobile connectivity is another key driver for the growth of the distributed antenna system (DAS) market. Manufacturers are increasing their production capacities to meet the requirements of passengers at airports and train stations. Among end users, the transportation segment of the distributed antenna system market is estimated to reach a value of ~US$ 2.4 Bn by the end of 2024.
Growing need for wireless connectivity to meet voice, data, and text messaging is catalyzing the demand for distributed antenna systems. Moreover, robust cellular coverage is becoming increasingly mainstream in developed economies of North America. In addition, this trend is gaining popularity in countries of Asia Pacific, since the region is anticipated for exponential growth during the forecast period. Solid cellular coverage plays a vital role in ensuring public safety. Hence, government organizations are increasingly installing DAS for various modes of public transportation.
Wireless communications have become a necessity in several end markets. In order to meet the needs of growing users that rely on wireless connectivity, manufacturers in the distributed antenna system (DAS) market are increasing their efficacy in multi-antenna communications. The market is largely consolidated with six leading players accounting to more than ~60% of the market share. This poses as a challenge for emerging players to innovate in multi-antenna communications due to the lack of capital and expertise in the domain.
Companies in the distributed antenna system (DAS) market are adopting optimal transit strategies to ensure uninterrupted wireless connectivity. However, the issue of per-antenna power constraints in point-to-point multiple-input single-output (MISO) and multiple-input multiple-output (MIMO) channels with joint sum poses as a challenge for manufacturers. Hence, companies are experimenting with efficient iterative algorithms to overcome the limitations of power constraints in practical systems.
Moreover, manufacturers are tapping into opportunities to integrate 5G networks with IoT in smart city environments. Paradigm shifts in urban ecosystems with rural population transitioning toward suburban and urban areas is another driver for market growth.
The collaboration between OEMs and RF (Radio Frequency) design tools is playing a crucial role in designing modern multi-layer systems. Companies in the distributed antenna system (DAS) market are increasing their efforts to enable mobile connections in challenging environments such as in high-speed trains and underground stations.
However, issues involving 5G-based IoT applications in smart city environments pose as a hurdle for manufacturers. Hence, manufacturers should employ simplicity and homogeneity in 5G IoT systems to establish well-equipped connected environments. Apart from stadiums and transportation, manufacturers should invest in developing advanced DAS to support growing hospitality, healthcare, corporate campuses, and education sectors.
Distributed Antenna System (DAS) Market: Overview
Key Drivers of Distributed Antenna System (DAS) Market
Distributed Antenna System (DAS) Market – Competition Landscape
Distributed Antenna System (DAS) Market - Company Profiles Snapshot
CommScope Inc. provides infrastructure solutions for communication networks worldwide. The company’s CommScope Connectivity Solutions segment offers optical fiber and twisted pair structured cable solutions, intelligent infrastructure software, and network rack and cabinet enclosures under the SYSTIMAX, AMP NETCONNECT, and Uniprise brands. CommScope Inc. provides DAS solutions under its mobility solutions segment.
Corning Incorporated is one of the world’s leading innovators in material science. The company provides distributed antenna system (DAS) solutions to ensure five-bar cellular coverage and adequate cellular data capacity for smartphones and enterprise networks. The company’s indoor and outdoor DAS solutions/technologies are designed to flexibly deliver licensed radio frequencies, public safety, and to ensure adequate network coverage in venues such as stadiums and arenas.
Cobham Wireless, is part of Cobham plc and operates at the component and subsystem level. The company is one of the significant global players, providing advanced wireless coverage and mobile communication systems. The company’s portfolio includes public safety solutions, development and test tools, wireless coverage, mobile communications systems, DAS solutions, and mobile and IP networks.
Other major players operating in the distributed antenna system (DAS) market and profiled in the report include
The distributed antenna system (das) market is studied from 2019 - 2027
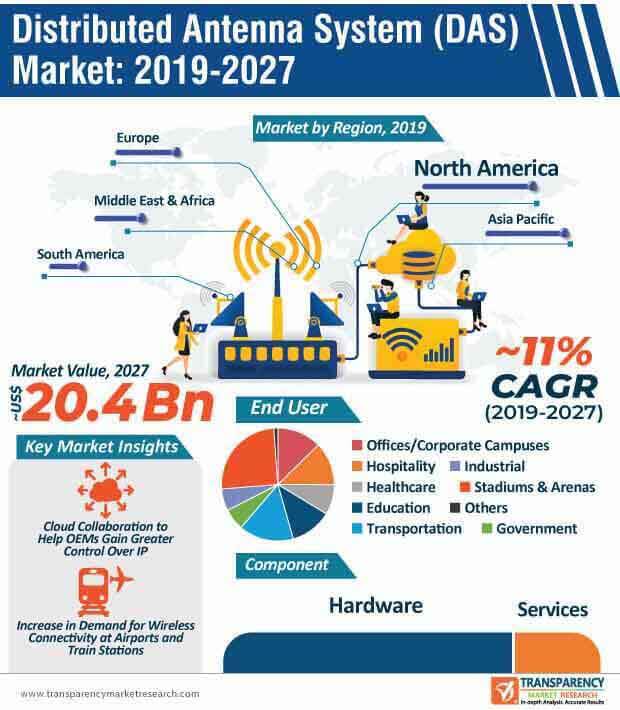
The distributed antenna system (das) market is expected to reach $20.4 billion by 2027
The distributed antenna system (das) market is growing at a CAGR of 11% over the next five years
The top companies holding the market share in the global distributed antenna system (das) market report include American Tower Corporation, AT&T Inc., Bird Technologies, Boingo Wireless, Inc., Cobham Wireless, CommScope Inc., Corning Incorporated, Dali Wireless, SOLiD, Inc., and TESSCO Technologies, Inc.
The distributed antenna system (DAS) market in North America is expected to hold a dominant share of 36% of the global market by the end of 2019
1. Preface
1.1. Market Definition and Scope
1.2. Market Segmentation
1.3. Key Research Objectives
1.4. Research Highlights
2. Assumptions and Research Methodology
3. Executive Summary : Global Distributed Antenna System (DAS) Market
4. Market Overview
4.1. Introduction
4.2. Market Dynamics
4.2.1. Drivers
4.2.2. Restraints
4.2.3. Opportunities
4.3. Key Market Indicators
4.3.1. Adoption of Portable Devices
4.4. Global Distributed Antenna System (DAS) Market Analysis and Forecasts, 2016 - 2027
4.4.1. Market Revenue Projections (US$ Mn)
4.5. Porter’s Five Force Analysis
4.6. Value Chain Analysis
4.6.1. List of Active Market Participants (Manufacturers/ Retailer/ Distributors/ Vendors)
4.6.2. Forward – Backward Integration Scenario
4.7. Market Outlook
5. Global Distributed Antenna System (DAS) Market Analysis and Forecasts, by Component
5.1. Overview & Definitions
5.2. Key Trends
5.3. Distributed Antenna System (DAS) Market Size (US$ Mn) Forecast by Component, 2017 - 2027
5.3.1. Hardware
5.3.1.1. Active
5.3.1.1.1. Head- end and Remotes
5.3.1.1.2. Trays
5.3.1.1.3. Antennas
5.3.1.1.4. Others
5.3.1.2. Passive
5.3.1.2.1. Donor Antennas
5.3.1.2.2. Trays
5.3.1.2.3. Repeaters
5.3.1.2.4. Others
5.3.1.3. Cabling
5.3.1.3.1. Coaxial
5.3.1.3.2. Optical Fiber
5.3.1.3.3. CAT5
5.3.1.3.4. Others
5.3.1.4. Hybrid
5.3.1.4.1. Head- end and Remotes
5.3.1.4.2. Repeaters
5.3.2. Service
5.3.2.1. Design and Installation
5.3.2.2. Maintenance
5.4. Component Comparison Matrix
5.5. Market Attractiveness by Component
6. Global Distributed Antenna System (DAS) Market Analysis and Forecasts, by Technology
6.1. Overview & Definition
6.2. Key Trends
6.3. Distributed Antenna System (DAS) Market Size (US$ Mn) Forecast by Technology, 2017 - 2027
6.3.1. Cellular/Commercial DAS
6.3.2. Public Safety DAS
6.4. Technology Comparison Matrix
6.5. Market Attractiveness by Technology
7. Global Distributed Antenna System (DAS) Market Analysis and Forecasts, by End-user
7.1. Overview & Definition
7.2. Key Trends
7.3. Distributed Antenna System (DAS) Market Size (US$ Mn) Forecast by End-user, 2017 - 2027
7.3.1. Offices/Corporate Campus
7.3.2. Hospitality
7.3.2.1. Hotels/Resorts
7.3.2.2. Retail/Shopping Malls
7.3.3. Health Care
7.3.4. Education
7.3.5. Transportation
7.3.5.1. Airport/Train Stations
7.3.5.2. Parking Structures/Underground/ Tunnels
7.3.6. Government
7.3.7. Industrial
7.3.8. Stadiums and Arenas
7.3.9. Others
7.4. End-user Comparison Matrix
7.5. Market Attractiveness by End-user
8. Global Distributed Antenna System (DAS) Market Analysis and Forecasts, by Region
8.1. Key Findings
8.2. Policies and Regulations
8.3. Distributed Antenna System (DAS) Market Size (US$ Mn) Forecast by Region, 2017 - 2027
8.3.1. North America
8.3.2. Europe
8.3.3. Asia Pacific
8.3.4. Middle East & Africa
8.3.5. South America
8.4. Market Attractiveness by Country/Region
9. North America Distributed Antenna System (DAS) Market Analysis and Forecast
9.1. Key Findings
9.2. Key Trends
9.3. Distributed Antenna System (DAS) Market Size (US$ Mn) Forecast by Component, 2017 - 2027
9.3.1. Hardware
9.3.1.1. Active
9.3.1.1.1. Head- end and Remotes
9.3.1.1.2. Trays
9.3.1.1.3. Antennas
9.3.1.1.4. Others
9.3.1.2. Passive
9.3.1.2.1. Donor Antennas
9.3.1.2.2. Trays
9.3.1.2.3. Repeaters
9.3.1.2.4. Others
9.3.1.3. Cabling
9.3.1.3.1. Coaxial
9.3.1.3.2. Optical Fiber
9.3.1.3.3. CAT5
9.3.1.3.4. Others
9.3.1.4. Hybrid
9.3.1.4.1. Head- end and Remotes
9.3.1.4.2. Repeaters
9.3.2. Service
9.3.2.1. Design and Installation
9.3.2.2. Maintenance
9.4. Distributed Antenna System (DAS) Market Size (US$ Mn) Forecast by Technology, 2017 - 2027
9.4.1. Cellular/Commercial DAS
9.4.2. Public Safety DAS
9.5. Distributed Antenna System (DAS) Market Size (US$ Mn) Forecast by End-user, 2017 - 2027
9.5.1. Offices/Corporate Campus
9.5.2. Hospitality
9.5.2.1. Hotels/Resorts
9.5.2.2. Retail/Shopping Malls
9.5.3. Health Care
9.5.4. Education
9.5.5. Transportation
9.5.5.1. Airport/Train Stations
9.5.5.2. Parking Structures/Underground/ Tunnels
9.5.6. Government
9.5.7. Industrial
9.5.8. Stadiums and Arenas
9.5.9. Others
9.6. Distributed Antenna System (DAS) Market Size (US$ Mn) Forecast by Country/Sub-region, 2017 - 2027
9.6.1. U.S.
9.6.2. Canada
9.6.3. Rest of North America
9.7. Market Attractiveness Analysis
9.7.1. by Country
9.7.2. by Component
9.7.3. by Technology
9.7.4. by End-user
10. Europe Distributed Antenna System (DAS) Market Analysis and Forecast
10.1. Key Findings
10.2. Key Trends
10.3. Distributed Antenna System (DAS) Market Size (US$ Mn) Forecast by Component, 2017 - 2027
10.3.1. Hardware
10.3.1.1. Active
10.3.1.1.1. Head- end and Remotes
10.3.1.1.2. Trays
10.3.1.1.3. Antennas
10.3.1.1.4. Others
10.3.1.2. Passive
10.3.1.2.1. Donor Antennas
10.3.1.2.2. Trays
10.3.1.2.3. Repeaters
10.3.1.2.4. Others
10.3.1.3. Cabling
10.3.1.3.1. Coaxial
10.3.1.3.2. Optical Fiber
10.3.1.3.3. CAT5
10.3.1.3.4. Others
10.3.1.4. Hybrid
10.3.1.4.1. Head- end and Remotes
10.3.1.4.2. Repeaters
10.3.2. Service
10.3.2.1. Design and Installation
10.3.2.2. Maintenance
10.4. Distributed Antenna System (DAS) Market Size (US$ Mn) Forecast by Technology, 2017 - 2027
10.4.1. Cellular/Commercial DAS
10.4.2. Public Safety DAS
10.5. Distributed Antenna System (DAS) Market Size (US$ Mn) Forecast by End-user, 2017 - 2027
10.5.1. Offices/Corporate Campus
10.5.2. Hospitality
10.5.2.1. Hotels/Resorts
10.5.2.2. Retail/Shopping Malls
10.5.3. Health Care
10.5.4. Education
10.5.5. Transportation
10.5.5.1. Airport/Train Stations
10.5.5.2. Parking Structures/Underground/ Tunnels
10.5.6. Government
10.5.7. Industrial
10.5.8. Stadiums and Arenas
10.5.9. Others
10.6. Distributed Antenna System (DAS) Market Size (US$ Mn) Forecast by Country/Sub-region, 2017 - 2027
10.6.1. Germany
10.6.2. France
10.6.3. U.K.
10.6.4. Italy
10.6.5. Rest of Europe
10.7. Market Attractiveness Analysis
10.7.1. by Country
10.7.2. by Component
10.7.3. by Technology
10.7.4. by End-user
11. Asia Pacific Distributed Antenna System (DAS) Market Analysis and Forecast
11.1. Key Findings
11.2. Key Trends
11.3. Distributed Antenna System (DAS) Market Size (US$ Mn) Forecast by Component, 2017 - 2027
11.3.1. Hardware
11.3.1.1. Active
11.3.1.1.1. Head- end and Remotes
11.3.1.1.2. Trays
11.3.1.1.3. Antennas
11.3.1.1.4. Others
11.3.1.2. Passive
11.3.1.2.1. Donor Antennas
11.3.1.2.2. Trays
11.3.1.2.3. Repeaters
11.3.1.2.4. Others
11.3.1.3. Cabling
11.3.1.3.1. Coaxial
11.3.1.3.2. Optical Fiber
11.3.1.3.3. CAT5
11.3.1.3.4. Others
11.3.1.4. Hybrid
11.3.1.4.1. Head- end and Remotes
11.3.1.4.2. Repeaters
11.3.2. Service
11.3.2.1. Design and Installation
11.3.2.2. Maintenance
11.4. Distributed Antenna System (DAS) Market Size (US$ Mn) Forecast by Technology, 2017 - 2027
11.4.1. Cellular/Commercial DAS
11.4.2. Public Safety DAS
11.5. Distributed Antenna System (DAS) Market Size (US$ Mn) Forecast by End-user, 2017 - 2027
11.5.1. Offices/Corporate Campus
11.5.2. Hospitality
11.5.2.1. Hotels/Resorts
11.5.2.2. Retail/Shopping Malls
11.5.3. Health Care
11.5.4. Education
11.5.5. Transportation
11.5.5.1. Airport/Train Stations
11.5.5.2. Parking Structures/Underground/ Tunnels
11.5.6. Government
11.5.7. Industrial
11.5.8. Stadiums and Arenas
11.5.9. Others
11.6. Distributed Antenna System (DAS) Market Size (US$ Mn) Forecast by Country/Sub-region, 2017 - 2027
11.6.1. China
11.6.2. Japan
11.6.3. Australia
11.6.4. South Korea
11.6.5. India
11.6.6. Indonesia
11.6.7. New Zealand
11.6.8. Singapore
11.6.9. Rest of Asia Pacific
11.7. Market Attractiveness Analysis
11.7.1. by Country
11.7.2. by Component
11.7.3. by Technology
11.7.4. by End-user
12. Middle East & Africa (MEA) Distributed Antenna System (DAS) Market Analysis and Forecast
12.1. Key Findings
12.2. Key Trends
12.3. Distributed Antenna System (DAS) Market Size (US$ Mn) Forecast by Component, 2017 - 2027
12.3.1. Hardware
12.3.1.1. Active
12.3.1.1.1. Head- end and Remotes
12.3.1.1.2. Trays
12.3.1.1.3. Antennas
12.3.1.1.4. Others
12.3.1.2. Passive
12.3.1.2.1. Donor Antennas
12.3.1.2.2. Trays
12.3.1.2.3. Repeaters
12.3.1.2.4. Others
12.3.1.3. Cabling
12.3.1.3.1. Coaxial
12.3.1.3.2. Optical Fiber
12.3.1.3.3. CAT5
12.3.1.3.4. Others
12.3.1.4. Hybrid
12.3.1.4.1. Head- end and Remotes
12.3.1.4.2. Repeaters
12.3.2. Service
12.3.2.1. Design and Installation
12.3.2.2. Maintenance
12.4. Distributed Antenna System (DAS) Market Size (US$ Mn) Forecast by Technology, 2017 - 2027
12.4.1. Cellular/Commercial DAS
12.4.2. Public Safety DAS
12.5. Distributed Antenna System (DAS) Market Size (US$ Mn) Forecast by End-user, 2017 - 2027
12.5.1. Offices/Corporate Campus
12.5.2. Hospitality
12.5.2.1. Hotels/Resorts
12.5.2.2. Retail/Shopping Malls
12.5.3. Health Care
12.5.4. Education
12.5.5. Transportation
12.5.5.1. Airport/Train Stations
12.5.5.2. Parking Structures/Underground/ Tunnels
12.5.6. Government
12.5.7. Industrial
12.5.8. Stadiums and Arenas
12.5.9. Others
12.6. Distributed Antenna System (DAS) Market Size (US$ Mn) Forecast by Country/Sub-region, 2017 - 2027
12.6.1. UAE
12.6.2. Saudi Arabia
12.6.3. South Africa
12.6.4. Rest of MEA
12.7. Market Attractiveness Analysis
12.7.1. by Country
12.7.2. by Component
12.7.3. by Technology
12.7.4. by End-user
13. South America Distributed Antenna System (DAS) Market Analysis and Forecast
13.1. Key Findings
13.2. Key Trends
13.3. Distributed Antenna System (DAS) Market Size (US$ Mn) Forecast by Component, 2017 - 2027
13.3.1. Hardware
13.3.1.1. Active
13.3.1.1.1. Head- end and Remotes
13.3.1.1.2. Trays
13.3.1.1.3. Antennas
13.3.1.1.4. Others
13.3.1.2. Passive
13.3.1.2.1. Donor Antennas
13.3.1.2.2. Trays
13.3.1.2.3. Repeaters
13.3.1.2.4. Others
13.3.1.3. Cabling
13.3.1.3.1. Coaxial
13.3.1.3.2. Optical Fiber
13.3.1.3.3. CAT5
13.3.1.3.4. Others
13.3.1.4. Hybrid
13.3.1.4.1. Head- end and Remotes
13.3.1.4.2. Repeaters
13.3.2. Service
13.3.2.1. Design and Installation
13.3.2.2. Maintenance
13.4. Distributed Antenna System (DAS) Market Size (US$ Mn) Forecast by Technology, 2017 - 2027
13.4.1. Cellular/Commercial DAS
13.4.2. Public Safety DAS
13.5. Distributed Antenna System (DAS) Market Size (US$ Mn) Forecast by End-user, 2017 - 2027
13.5.1. Offices/Corporate Campus
13.5.2. Hospitality
13.5.2.1. Hotels/Resorts
13.5.2.2. Retail/Shopping Malls
13.5.3. Health Care
13.5.4. Education
13.5.5. Transportation
13.5.5.1. Airport/Train Stations
13.5.5.2. Parking Structures/Underground/ Tunnels
13.5.6. Government
13.5.7. Industrial
13.5.8. Stadiums and Arenas
13.5.9. Others
13.6. Distributed Antenna System (DAS) Market Size (US$ Mn) Forecast by Country/Sub-region, 2017 - 2027
13.6.1. Brazil
13.6.2. Rest of South America
13.7. Market Attractiveness Analysis
13.7.1. by Country
13.7.2. by Component
13.7.3. by Technology
13.7.4. by End-user
14. Competition Landscape
14.1. Market Player – Competition Matrix
14.2. Market Share Analysis by Company (2019)
14.3. Company Profiles (Details – Overview, Financials, SWOT Analysis, Strategy)
14.3.1. American Tower Corporation
14.3.1.1. Market Presence, by Segment and Geography
14.3.1.2. Revenue and Operating Profits
14.3.1.3. Strategy and Historical Roadmap
14.3.1.4. SWOT Analysis
14.3.2. AT&T Inc.
14.3.2.1. Market Presence, by Segment and Geography
14.3.2.2. Revenue and Operating Profits
14.3.2.3. Strategy and Historical Roadmap
14.3.2.4. SWOT Analysis
14.3.3. Bird Technologies
14.3.3.1. Market Presence, by Segment and Geography
14.3.3.2. Revenue and Operating Profits
14.3.3.3. Strategy and Historical Roadmap
14.3.3.4. SWOT Analysis
14.3.4. Boingo Wireless, Inc.
14.3.4.1. Market Presence, by Segment and Geography
14.3.4.2. Revenue and Operating Profits
14.3.4.3. Strategy and Historical Roadmap
14.3.4.4. SWOT Analysis
14.3.5. Cobham Wireless
14.3.5.1. Market Presence, by Segment and Geography
14.3.5.2. Revenue and Operating Profits
14.3.5.3. Strategy and Historical Roadmap
14.3.5.4. SWOT Analysis
14.3.6. CommScope Inc.
14.3.6.1. Market Presence, by Segment and Geography
14.3.6.2. Revenue and Operating Profits
14.3.6.3. Strategy and Historical Roadmap
14.3.6.4. SWOT Analysis
14.3.7. Corning Incorporated
14.3.7.1. Market Presence, by Segment and Geography
14.3.7.2. Revenue and Operating Profits
14.3.7.3. Strategy and Historical Roadmap
14.3.7.4. SWOT Analysis
14.3.8. Dali Wireless
14.3.8.1. Market Presence, by Segment and Geography
14.3.8.2. Revenue and Operating Profits
14.3.8.3. Strategy and Historical Roadmap
14.3.8.4. SWOT Analysis
14.3.9. SOLiD, Inc.
14.3.9.1. Market Presence, by Segment and Geography
14.3.9.2. Revenue and Operating Profits
14.3.9.3. Strategy and Historical Roadmap
14.3.9.4. SWOT Analysis
14.3.10. TESSCO Technologies, Inc
14.3.10.1. Market Presence, by Segment and Geography
14.3.10.2. Revenue and Operating Profits
14.3.10.3. Strategy and Historical Roadmap
14.3.10.4. SWOT Analysis
15. Key Takeaways
List of Tables
Table 1: Global Distributed Antenna System Market Size and Forecast, by Component, 2017 – 2027 (US$ Mn)
Table 2: Global Distributed Antenna System Market Size and Forecast, by Hardware, 2017 – 2027 (US$ Mn)
Table 3: Global Distributed Antenna System Market Size and Forecast, by Hardware, by Active DAS, 2017 – 2027 (US$ Mn)
Table 4: Global Distributed Antenna System Market Size and Forecast, by Hardware, by Passive DAS, 2017 – 2027 (US$ Mn)
Table 5: Global Distributed Antenna System Market Size and Forecast, by Hardware, by Cabling, 2017 – 2027 (US$ Mn)
Table 6: Global Distributed Antenna System Market Size and Forecast, by by Hardware, Hybrid DAS, 2017 – 2027 (US$ Mn)
Table 7: Global Distributed Antenna System Market Size and Forecast, by Services, 2017 – 2027 (US$ Mn)
Table 8: Global Distributed Antenna System Market Size and Forecast, by Technology, 2017 – 2027 (US$ Mn)
Table 9: Global Distributed Antenna System Market Size and Forecast, by End-user, 2017 – 2027 (US$ Mn)
Table 10: Global Distributed Antenna System Market Size and Forecast, by End-user, by Hospitality, 2017 – 2027 (US$ Mn)
Table 11: Global Distributed Antenna System Market Size and Forecast, by End-user, by Transportation, 2017 – 2027 (US$ Mn)
Table 12: Global Distributed Antenna System Market Size and Forecast, by Region, 2017 – 2027 (US$ Mn)
Table 13: North America Distributed Antenna System Market Size and Forecast, by Component, 2017 – 2027 (US$ Mn)
Table 14: North America Distributed Antenna System Market Size and Forecast, by Hardware, 2017 – 2027 (US$ Mn)
Table 15: North America Distributed Antenna System Market Size and Forecast, by Hardware, by Active DAS, 2017 – 2027 (US$ Mn)
Table 16: North America Distributed Antenna System Market Size and Forecast, by Hardware, by Passive DAS, 2017 – 2027 (US$ Mn)
Table 17: North America Distributed Antenna System Market Size and Forecast, by Hardware, by Hybrid DAS, 2017 – 2027 (US$ Mn)
Table 18: North America Distributed Antenna System Market Size and Forecast, by Hardware, by Hybrid, 2017 – 2027 (US$ Mn)
Table 19: North America Distributed Antenna System Market Size and Forecast, by Services, 2017 – 2027 (US$ Mn)
Table 20: North America Distributed Antenna System Market Size and Forecast, by Technology, 2017 – 2027 (US$ Mn)
Table 21: North America Distributed Antenna System Market Size and Forecast, by End-user, 2017 – 2027 (US$ Mn)
Table 22: North America Distributed Antenna System Market Size and Forecast, by End-user, by Hospitality, 2017 – 2027 (US$ Mn)
Table 23: North America Distributed Antenna System Market Size and Forecast, by End-user, by Transportation, 2017 – 2027 (US$ Mn)
Table 24: North America Distributed Antenna System Market Size and Forecast, by Country, 2017 – 2027 (US$ Mn)
Table 25: Europe Distributed Antenna System Market Size and Forecast, by Component, 2017 – 2027 (US$ Mn)
Table 26: Europe Distributed Antenna System Market Size and Forecast, by Hardware, 2017 – 2027 (US$ Mn)
Table 27: Europe Distributed Antenna System Market Size and Forecast, by Hardware, by Active DAS, 2017 – 2027 (US$ Mn)
Table 28: Europe Distributed Antenna System Market Size and Forecast, by Hardware, by Passive DAS, 2017 – 2027 (US$ Mn)
Table 29: Europe Distributed Antenna System Market Size and Forecast, by Hardware, by Cabling, 2017 – 2027 (US$ Mn)
Table 30: Europe Distributed Antenna System Market Size and Forecast, by Hardware, by Hybrid, 2017 – 2027 (US$ Mn)
Table 31: Europe Distributed Antenna System Market Size and Forecast, by Services, 2017 – 2027 (US$ Mn)
Table 32: Europe Distributed Antenna System Market Size and Forecast, by Technology, 2017 – 2027 (US$ Mn)
Table 33: Europe Distributed Antenna System Market Size and Forecast, by End-user, 2017 – 2027 (US$ Mn)
Table 34: Europe Distributed Antenna System Market Size and Forecast, by End-user, by Hospitality, 2017 – 2027 (US$ Mn)
Table 35: Europe Distributed Antenna System Market Size and Forecast, by End-user, by Transportation, 2017 – 2027 (US$ Mn)
Table 36: Europe Distributed Antenna System Market Size and Forecast, by Country, 2017 – 2027 (US$ Mn)
Table 37: Asia Pacific Distributed Antenna System Market Size and Forecast, by Component, 2017 – 2027 (US$ Mn)
Table 38: Asia Pacific Distributed Antenna System Market Size and Forecast, by Hardware, 2017 – 2027 (US$ Mn)
Table 39: Asia Pacific Distributed Antenna System Market Size and Forecast, by Hardware, by Active DAS, 2017 – 2027 (US$ Mn)
Table 40: Asia Pacific Distributed Antenna System Market Size and Forecast, by Hardware, by Passive DAS, 2017 – 2027 (US$ Mn)
Table 41: Asia Pacific Distributed Antenna System Market Size and Forecast, by Hardware, by Cabling, 2017 – 2027 (US$ Mn)
Table 42: Asia Pacific Distributed Antenna System Market Size and Forecast, by Hardware, by Hybrid, 2017 – 2027 (US$ Mn)
Table 43: Asia Pacific Distributed Antenna System Market Size and Forecast, by Services, 2017 – 2027 (US$ Mn)
Table 44: Asia Pacific Distributed Antenna System Market Size and Forecast, by Technology, 2017 – 2027 (US$ Mn)
Table 45: Asia Pacific Distributed Antenna System Market Size and Forecast, by End-user, 2017 – 2027 (US$ Mn)
Table 46: Asia Pacific Distributed Antenna System Market Size and Forecast, by End-user, by Hospitality, 2017 – 2027 (US$ Mn)
Table 47: Asia Pacific Distributed Antenna System Market Size and Forecast, by End-user, by Transportation, 2017 – 2027 (US$ Mn)
Table 48: Asia Pacific Distributed Antenna System Market Size and Forecast, by Country, 2017 – 2027 (US$ Mn)
Table 49: MEA Distributed Antenna System Market Size and Forecast, by Component, 2017 – 2027 (US$ Mn)
Table 50: MEA Distributed Antenna System Market Size and Forecast, by Hardware, 2017 – 2027 (US$ Mn)
Table 51: MEA Distributed Antenna System Market Size and Forecast, by Hardware, by Active DAS, 2017 – 2027 (US$ Mn)
Table 52: MEA Distributed Antenna System Market Size and Forecast, by Hardware, by Passive DAS, 2017 – 2027 (US$ Mn)
Table 53: MEA Distributed Antenna System Market Size and Forecast, by Hardware, by Cabling, 2017 – 2027 (US$ Mn)
Table 54: MEA Distributed Antenna System Market Size and Forecast, by Hardware, by Hybrid, 2017 – 2027 (US$ Mn)
Table 55: MEA Distributed Antenna System Market Size and Forecast, by Services, 2017 – 2027 (US$ Mn)
Table 56: MEA Distributed Antenna System Market Size and Forecast, by Technology, 2017 – 2027 (US$ Mn)
Table 57: MEA Distributed Antenna System Market Size and Forecast, by End-user, 2017 – 2027 (US$ Mn)
Table 58: MEA Distributed Antenna System Market Size and Forecast, by End-user, by Hospitality, 2017 – 2027 (US$ Mn)
Table 59: MEA Distributed Antenna System Market Size and Forecast, by End-user, by Transportation, 2017 – 2027 (US$ Mn)
Table 60: MEA Distributed Antenna System Market Size and Forecast, by Country, 2017 – 2027 (US$ Mn)
Table 61: South America Distributed Antenna System Market Size and Forecast, by Component, 2017 – 2027 (US$ Mn)
Table 62: South America Distributed Antenna System Market Size and Forecast, by Hardware, 2017 – 2027 (US$ Mn)
Table 63: South America Distributed Antenna System Market Size and Forecast, by Hardware, by Active DAS, 2017 – 2027 (US$ Mn)
Table 64: South America Distributed Antenna System Market Size and Forecast, by Hardware, by Passive DAS, 2017 – 2027 (US$ Mn)
Table 65: South America Distributed Antenna System Market Size and Forecast, by Hardware, by Cabling, 2017 – 2027 (US$ Mn)
Table 66: South America Distributed Antenna System Market Size and Forecast, by Hardware, by Hybrid, 2017 – 2027 (US$ Mn)
Table 67: South America Distributed Antenna System Market Size and Forecast, by Services, 2017 – 2027 (US$ Mn)
Table 68: South America Distributed Antenna System Market Size and Forecast, by Technology, 2017 – 2027 (US$ Mn)
Table 69: South America Distributed Antenna System Market Size and Forecast, by End-user, 2017 – 2027 (US$ Mn)
Table 70: South America Distributed Antenna System Market Size and Forecast, by End-user, by Hospitality, 2017 – 2027 (US$ Mn)
Table 71: South America Distributed Antenna System Market Size and Forecast, by End-user, by Transportation, 2017 – 2027 (US$ Mn)
Table 72: South America Distributed Antenna System Market Size and Forecast, by Country, 2017 – 2027 (US$ Mn)
List of Figures
Figure 1: Global Distributed Antenna System Market Analysis and Forecast (US$ Mn), 2016 – 2027
Figure 2: Global Distributed Antenna System Market Y-o-Y Growth (Value %) Forecast, 2016 – 2027
Figure 3: Global Distributed Antenna System Market Value Share, by End-user, 2019
Figure 4: Global Distributed Antenna System Market Value Share, by Component, 2019
Figure 5: Global Distributed Antenna System Market Value Share, by Technology, 2019
Figure 6: Global Distributed Antenna System Market Value Share Analysis, by Component, 2019 and 2027
Figure 7: Global Distributed Antenna System Market Value Share Analysis, by Hardware
Figure 8: Global Distributed Antenna System Market Value Share Analysis, by Services
Figure 9: Global Distributed Antenna System Market Value Share Analysis, by Hardware, 2019 and 2027
Figure 10: Global Distributed Antenna System Market Value Share Analysis, by Hardware, by Active DAS, 2019 and 2027
Figure 11: Global Distributed Antenna System Market Value Share Analysis, by Hardware, by Passive DAS, 2019 and 2027
Figure 12: Global Distributed Antenna System Market Value Share Analysis, by Hardware, by Cabling, 2019 and 2027
Figure 13: Global Distributed Antenna System Market Value Share Analysis, by Hardware, by Hybrid DAS, 2019 and 2027
Figure 14: Global Distributed Antenna System Market Value Share Analysis, by Services, 2019 and 2027
Figure 15: Global Distributed Antenna System Market Value Share Analysis, by Design & Installation Services
Figure 16: Global Distributed Antenna System Market Value Share Analysis, by Maintenance Services
Figure 17: Global Distributed Antenna System Comparison Matrix, by Component
Figure 18: Global Distributed Antenna System Market Attractiveness Analysis, by Hardware
Figure 19: Global Distributed Antenna System Market Attractiveness Analysis, by Services
Figure 20: Global Distributed Antenna System Market Value Share Analysis, by Technology, 2019 and 2027
Figure 21: Global Distributed Antenna System Market Value Share Analysis, by Cellular/Commercial DAS
Figure 22: Global Distributed Antenna System Market Value Share Analysis, by Public Safety
Figure 23: Global Distributed Antenna System Comparison Matrix, by Technology
Figure 24: Global Distributed Antenna System Market Attractiveness Analysis, by Technology
Figure 25: Global Distributed Antenna System Market Value Share Analysis, by End-user, 2019 and 2027
Figure 26: Global Distributed Antenna System Market Value Share Analysis, by Offices/Corporate Campus
Figure 27: Global Distributed Antenna System Market Value Share Analysis, by Hospitality
Figure 28: Global Distributed Antenna System Market Value Share Analysis, by Healthcare
Figure 29: Global Distributed Antenna System Market Value Share Analysis, by Education
Figure 30: Global Distributed Antenna System Market Value Share Analysis, by Transportation
Figure 31: Global Distributed Antenna System Market Value Share Analysis, by Government
Figure 32: Global Distributed Antenna System Market Value Share Analysis, by Industrial
Figure 33: Global Distributed Antenna System Market Value Share Analysis, by Stadiums and Arenas
Figure 34: Global Distributed Antenna System Market Value Share Analysis, by Others
Figure 35: Global Distributed Antenna System Market Value Share Analysis, by End-user, by Hospitality, 2019 and 2027
Figure 36: Global Distributed Antenna System Market Value Share Analysis, by End-user, by Transportation, 2019 and 2027
Figure 37: Global Distributed Antenna System Comparison Matrix by End-user
Figure 38: Global Distributed Antenna System Market Attractiveness Analysis, by End-user
Figure 39: Global Distributed Antenna System Market Value Share Analysis, by Region, 2019 and 2027
Figure 40: Global Distributed Antenna System Market Attractiveness Analysis, by Region
Figure 41: North America Distributed Antenna System Market Analysis and Forecast (US$ Mn), 2017 – 2027
Figure 42: North America Distributed Antenna System Market Value Share Analysis, by Component, 2019 and 2027
Figure 43: North America Distributed Antenna System Market Value Share Analysis, by Hardware, 2019 and 2027
Figure 44: North America Distributed Antenna System Market Value Share Analysis, by Hardware, by Active DAS, 2019 and 2027
Figure 45: North America Distributed Antenna System Market Value Share Analysis, by Hardware, by Passive DAS, 2019 and 2027
Figure 46: North America Distributed Antenna System Market Value Share Analysis, by Hardware, by Cabling, 2019 and 2027
Figure 47: North America Distributed Antenna System Market Value Share Analysis, by Hardware, by Hybrid DAS, 2019 and 2027
Figure 48: North America Distributed Antenna System Market Value Share Analysis, by Services, 2019 and 2027
Figure 49: North America Distributed Antenna System Market Value Share Analysis, by Technology, 2019 and 2027
Figure 50: North America Distributed Antenna System Market Value Share Analysis, by End-user, 2019 and 2027
Figure 51: North America Distributed Antenna System Market Value Share Analysis, by End-user, by Hospitality, 2019 and 2027
Figure 52: North America Distributed Antenna System Market Value Share Analysis, by End-user, by Transportation, 2019 and 2027
Figure 53: North America Distributed Antenna System Market Value Share Analysis, by Country, 2019 and 2027
Figure 54: North America Distributed Antenna System Market Attractiveness Analysis, by Hardware
Figure 55: North America Distributed Antenna System Market Attractiveness Analysis, by Services
Figure 56: North America Distributed Antenna System Market Attractiveness Analysis, by End-user
Figure 57: North America Distributed Antenna System Market Attractiveness Analysis, by Country
Figure 58: Europe Distributed Antenna System Market Analysis and Forecast (US$ Mn), 2017 – 2027
Figure 59: Europe Distributed Antenna System Market Value Share Analysis, by Component, 2019 and 2027
Figure 60: Europe Distributed Antenna System Market Value Share Analysis, by Hardware, 2019 and 2027
Figure 61: Europe Distributed Antenna System Market Value Share Analysis, by Hardware, by Active DAS, 2019 and 2027
Figure 62: Europe Distributed Antenna System Market Value Share Analysis, by Hardware, by Passive DAS, 2019 and 2027
Figure 63: Europe Distributed Antenna System Market Value Share Analysis, by Hardware, by Cabling, 2019 and 2027
Figure 64: Europe Distributed Antenna System Market Value Share Analysis, by Hardware, by Hybrid, 2019 and 2027
Figure 65: Europe Distributed Antenna System Market Value Share Analysis, by Services, 2019 and 2027
Figure 66: Europe Distributed Antenna System Market Value Share Analysis, by Technology, 2019 and 2027
Figure 67: Europe Distributed Antenna System Market Value Share Analysis, by End-user, 2019 and 2027
Figure 68: Europe Distributed Antenna System Market Value Share Analysis, by End-user, by Hospitality, 2019 and 2027
Figure 69: Europe Distributed Antenna System Market Value Share Analysis, by End-user, by Transportation, 2019 and 2027
Figure 70: Europe Distributed Antenna System Market Value Share Analysis, by Country, 2019 and 2027
Figure 71: Europe Distributed Antenna System Market Attractiveness Analysis, by Hardware
Figure 72: Europe Distributed Antenna System Market Attractiveness Analysis, by Services
Figure 73: Europe Distributed Antenna System Market Attractiveness Analysis, by End-user
Figure 74: Europe Distributed Antenna System Market Attractiveness Analysis, by Country
Figure 75: Asia Pacific Distributed Antenna System Market Analysis and Forecast (US$ Mn), 2017 – 2027
Figure 76: Asia Pacific Distributed Antenna System Market Value Share Analysis, by Component, 2019 and 2027
Figure 77: Asia Pacific Distributed Antenna System Market Value Share Analysis, by Hardware, 2019 and 2027
Figure 78: Asia Pacific Distributed Antenna System Market Value Share Analysis, by Hardware, by Active DAS, 2019 and 2027
Figure 79: Asia Pacific Distributed Antenna System Market Value Share Analysis, by Hardware, by Passive DAS, 2019 and 2027
Figure 80: Asia Pacific Distributed Antenna System Market Value Share Analysis, by Hardware, by Cabling, 2019 and 2027
Figure 81: Asia Pacific Distributed Antenna System Market Value Share Analysis, by Hardware, by Hybrid, 2019 and 2027
Figure 82: Asia Pacific Distributed Antenna System Market Value Share Analysis, by Services, 2019 and 2027
Figure 83: Asia Pacific Distributed Antenna System Market Value Share Analysis, by Technology, 2019 and 2027
Figure 84: Asia Pacific Distributed Antenna System Market Value Share Analysis, by End-user, 2019 and 2027
Figure 85: Asia Pacific Distributed Antenna System Market Value Share Analysis, by End-user, by Hospitality, 2019 and 2027
Figure 86: Asia Pacific Distributed Antenna System Market Value Share Analysis, by End-user, by Transportation, 2019 and 2027
Figure 87: Asia Pacific Distributed Antenna System Market Value Share Analysis, by Country, 2019 and 2027
Figure 88: Asia Pacific Distributed Antenna System Market Attractiveness Analysis, by Hardware
Figure 89: Asia Pacific Distributed Antenna System Market Attractiveness Analysis, by End-user
Figure 90: Asia Pacific Distributed Antenna System Market Attractiveness Analysis, by Services
Figure 91: Asia Pacific Distributed Antenna System Market Attractiveness Analysis, by Country
Figure 92: MEA Distributed Antenna System Market Analysis and Forecast (US$ Mn), 2017 – 2027
Figure 93: MEA Distributed Antenna System Market Value Share Analysis, by Component, 2019 and 2027
Figure 94: MEA Distributed Antenna System Market Value Share Analysis, by Hardware, 2019 and 2027
Figure 95: MEA Distributed Antenna System Market Value Share Analysis, by Hardware, by Active DAS, 2019 and 2027
Figure 96: MEA Distributed Antenna System Market Value Share Analysis, by Hardware, by Passive DAS, 2019 and 2027
Figure 97: MEA Distributed Antenna System Market Value Share Analysis, by Hardware, by Cabling, 2019 and 2027
Figure 98: MEA Distributed Antenna System Market Value Share Analysis, by Hardware, by Hybrid, 2019 and 2027
Figure 99: MEA Distributed Antenna System Market Value Share Analysis, by Services, 2019 and 2027
Figure 100: MEA Distributed Antenna System Market Value Share Analysis, by Technology, 2019 and 2027
Figure 101: MEA Distributed Antenna System Market Value Share Analysis, by End-user, 2019 and 2027
Figure 102: MEA Distributed Antenna System Market Value Share Analysis, by End-user, by Hospitality, 2019 and 2027
Figure 103: MEA Distributed Antenna System Market Value Share Analysis, by End-user, by Transportation, 2019 and 2027
Figure 104: MEA Distributed Antenna System Market Value Share Analysis, by Country, 2019 and 2027
Figure 105: MEA Distributed Antenna System Market Attractiveness Analysis, by Hardware
Figure 106: MEA Distributed Antenna System Market Attractiveness Analysis, by Services
Figure 107: MEA Distributed Antenna System Market Attractiveness Analysis, by End-user
Figure 108: MEA Distributed Antenna System Market Attractiveness Analysis, by Country
Figure 109: South America Distributed Antenna System Market Analysis and Forecast (US$ Mn), 2017 – 2027
Figure 110: South America Distributed Antenna System Market Value Share Analysis, by Component, 2019 and 2027
Figure 111: South America Distributed Antenna System Market Value Share Analysis, by Hardware, 2019 and 2027
Figure 112: South America Distributed Antenna System Market Value Share Analysis, by Hardware, by Active DAS, 2019 and 2027
Figure 113: South America Distributed Antenna System Market Value Share Analysis, by Hardware, by Passive DAS, 2019 and 2027
Figure 114: South America Distributed Antenna System Market Value Share Analysis, by Hardware, by Cabling, 2019 and 2027
Figure 115: South America Distributed Antenna System Market Value Share Analysis, by Hardware, by Hybrid, 2019 and 2027
Figure 116: South America Distributed Antenna System Market Value Share Analysis, by Services, 2019 and 2027
Figure 117: South America Distributed Antenna System Market Value Share Analysis, by Technology, 2019 and 2027
Figure 118: South America Distributed Antenna System Market Value Share Analysis, by End-user, 2019 and 2027
Figure 119: South America Distributed Antenna System Market Value Share Analysis, by End-user, by Hospitality, 2019 and 2027
Figure 120: South America Distributed Antenna System Market Value Share Analysis, by End-user, by Transportation, 2019 and 2027
Figure 121: South America Distributed Antenna System Market Value Share Analysis, by Country, 2019 and 2027
Figure 122: South America Distributed Antenna System Market Attractiveness Analysis, by Hardware
Figure 123: South America Distributed Antenna System Market Attractiveness Analysis, by Services
Figure 124: South America Distributed Antenna System Market Attractiveness Analysis, by End-user
Figure 125: South America Distributed Antenna System Market Attractiveness Analysis, by Country
Copyright © Transparency Market Research, Inc. All Rights reserved
Trust Online

Distributed Antenna System (DAS) Market Forecast Report, 2019 - 2027
