Analysts’ Viewpoint on Direct Reduced Iron Market Scenario
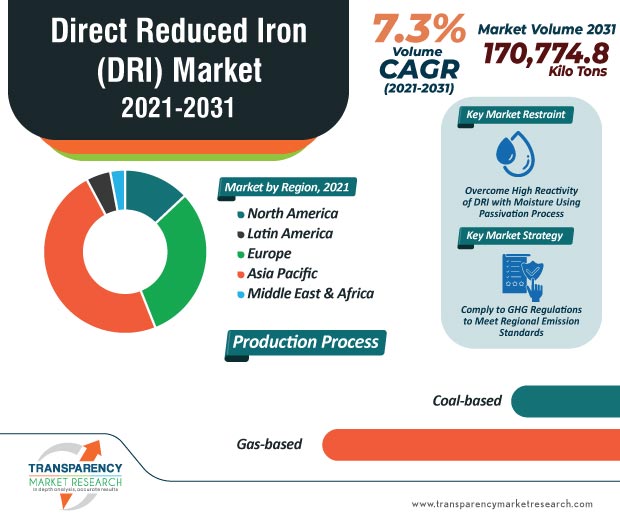
Industrialists in the direct reduced iron market are adopting contingency planning to overcome challenges in supply chain disruptions and other uncertainties due to the coronavirus pandemic. Compliance to GHG regulations is helping industrialists to bolster their credibility credentials. However, the high reactivity of DRI with moisture is emerging as a challenge for industrialists. Hence, participants in the market should acquire proficiency in passivation and ageing processes to reduce the oxidation process during transit. The high consumption of steel in construction of commercial buildings, aircraft hangers, and metro stations is translating into revenue opportunities for DRI manufacturers. Moreover, structural steel design components used for the construction of beams, channels, and angles is fueling the demand for DRI.
Apart from gas-based and coal-based techniques, participants in the direct reduced iron market are increasing research in green hydrogen-based direct reduced iron (DRI) production. Industrialists are taking active steps to move the current fossil-based economy to a greener economy, owing to issues of global warming and other environmental issues.
Steel production with BF/BOF (Blast Furnace-Basic Oxygen Furnace) processes are fossil-based wherein the reducing gas is obtained from coal or natural gas that leads to a large amount of CO2 emissions. Hence, companies in the direct reduced iron market are increasing R&D capabilities in hydrogen-based DRI production, which can be further processed into steel using an EAF (electric arc furnace).
Companies in the direct reduced iron market are witnessing a staggered growth in business activities due to the ongoing coronavirus pandemic. Nevertheless, overall market sentiments are improving due to significant reduction in cases and worldwide vaccination drives. Participants in the market are taking data-driven decisions before investing in new technologies and regions. They are drawing an analysis to understand their high-risk clients and customers where recovery of debt may be an issue.
Stakeholders in the direct reduced iron market are becoming competitive in pricing for steel, iron, and other raw materials to gain an edge over other market players. They are taking into consideration micro and macroeconomic factors to tide over the challenges caused by the COVID-19 pandemic.
The high reactivity of DRI with moisture is emerging as a challenge to industrialists. Unlike blast furnace pig iron, which is almost pure metal, DRI contains some siliceous gangue, which needs to be removed in the EAF. This leads to increased power consumption, ultimately leading to high cost. Hence, industrialists are gaining proficiency in processes such as passivation, whereby the briquettes are coated with sodium silicate or in ageing processes in which the briquettes are allowed to form an iron oxide coating. These processes are intended to reduce or inhibit the oxidation process during transit.
It has been found that during the production of steel, emissions released by using steel scraps as raw material are comparatively higher than the DRI that is used as feedstock for steel manufacturing. Such findings are benefitting industrialists in the direct reduced iron market.
DRI helps companies working in the steel manufacturing industry in the production of cost-effective carbon steel, which plays an instrumental role in the manufacture of high quality steel products. This is compelling companies in the direct reduced iron market to increase their production capabilities. Since steel scrap prices are constantly fluctuating, the demand for DRI is soaring.
Market players should take a closer look into the regulatory landscape besides unlocking income sources in hydrogen-based DRI production. The awareness of GHG (greenhouse gas) emission regulations for existing fossil fuel-fired power plants in the Affordable Clean Energy (ACE) Rule is benefitting stakeholders in the North America direct reduced iron market.
Since Europe is the second largest producer of steel worldwide, industrialists in the direct reduced iron market are tapping value-grab opportunities in the region. The EU, which currently accounts for 10% of global GHG emissions, is riding the crest of popularity for hydrogen-based DRI production to become climate neutral by 2050.
|
Attribute |
Detail |
|
Market Size Value in 2020 (Base Year) |
US$ 21.87 Bn |
|
Market Forecast Value in 2031 |
US$ 50.64 Bn |
|
Growth Rate (CAGR) |
8% |
|
Forecast Period |
2021-2031 |
|
Quantitative Units |
US$ Mn for Value & Kilo Tons for Volume |
|
Market Analysis |
It includes cross segment analysis at global as well as regional level. Qualitative analysis includes drivers, restraints, opportunities, key trends, Porter’s Five Forces analysis, supply chain analysis, and parent industry overview. |
|
Competition Landscape |
|
|
Format |
Electronic (PDF) + Excel |
|
Market Segmentation |
|
|
Regions Covered |
|
|
Countries Covered |
|
|
Companies Profiled |
|
|
Customization Scope |
Available upon Request |
|
Pricing |
Available upon Request |
1. Executive Summary
1.1. Direct Reduced Iron Market Snapshot
1.2. Current Market and Future Potential
2. Market Overview
2.1. Market Segmentation
2.2. Market Trends
2.3. Market Dynamics
2.3.1. Drivers
2.3.2. Restraints
2.3.3. Opportunities
2.4. Porter’s Five Forces Analysis
2.5. Regulatory Analysis
2.6. Value Chain Analysis
2.6.1. List of Direct Reduced Iron Manufacturers
2.6.2. List of Potential Customers
3. COVID-19 Impact Analysis
4. Global Direct Reduced Iron Market Analysis and Forecast, by Form, 2020–2031
4.1. Introduction and Definitions
4.2. Global Direct Reduced Iron Market Volume (Kilo Tons) and Value (US$ Mn) Forecast, by Form, 2020–2031
4.2.1. Pellets
4.2.2. Lumps
4.3. Global Direct Reduced Iron Market Attractiveness, by Form
5. Global Direct Reduced Iron Market Analysis and Forecast, by Production Process, 2020–2031
5.1. Introduction and Definitions
5.2. Global Direct Reduced Iron Market Volume (Kilo Tons) and Value (US$ Mn) Forecast, by Production Process, 2020–2031
5.2.1. Gas-based
5.2.2. Coal-based
5.3. Global Direct Reduced Iron Market Attractiveness, by Production Process
6. Global Direct Reduced Iron Market Analysis and Forecast, by Grade, 2020–2031
6.1. Introduction and Definitions
6.2. Global Direct Reduced Iron Market Volume (Kilo Tons) and Value (US$ Mn) Forecast, Grade, 2020–2031
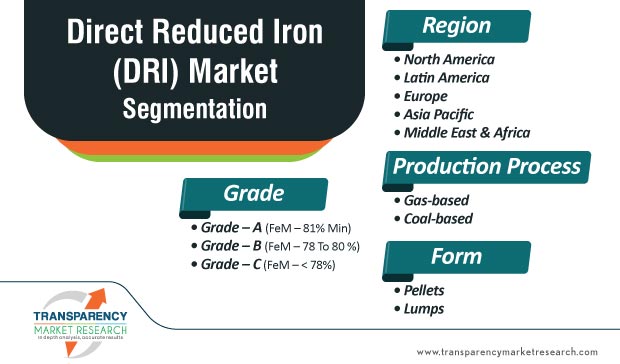
6.2.1. Grade – A (FeM – 81% Min)
6.2.2. Grade – B (FeM – 78 To 80 %)
6.2.3. Grade – C (FeM – < 78%)
6.3. Global Direct Reduced Iron Market Attractiveness, by Grade
7. Global Direct Reduced Iron Market Analysis and Forecast, by Region, 2020–2031
7.1. Key Findings
7.2. Global Direct Reduced Iron Market Volume (Kilo Tons) and Value (US$ Mn) Forecast, by Region, 2020–2031
7.2.1. North America
7.2.2. Europe
7.2.3. Asia Pacific
7.2.4. Latin America
7.2.5. Middle East & Africa
7.3. Global Direct Reduced Iron Market Attractiveness, by Region
8. North America Direct Reduced Iron Market Analysis and Forecast, 2020–2031
8.1. Key Findings
8.2. North America Direct Reduced Iron Market Volume (Kilo Tons) and Value (US$ Mn) Forecast, by Form, 2020–2031
8.3. North America Direct Reduced Iron Market Volume (Kilo Tons) and Value (US$ Mn) Forecast, by Production Process, 2020–2031
8.4. North America Direct Reduced Iron Market Volume (Kilo Tons) and Value (US$ Mn) Forecast, by Grade, 2020–2031
8.5. North America Direct Reduced Iron Market Volume (Kilo Tons) and Value (US$ Mn) Forecast, by Country, 2020–2031
8.5.1. U.S. Direct Reduced Iron Market Volume (Kilo Tons) and Value (US$ Mn) Forecast, by Form, 2020–2031
8.5.2. U.S. Direct Reduced Iron Market Volume (Kilo Tons) and Value (US$ Mn) Forecast, by Production Process, 2020–2031
8.5.3. U.S. Direct Reduced Iron Market Volume (Kilo Tons) and Value (US$ Mn) Forecast, by Grade, 2020–2031
8.5.4. Canada Direct Reduced Iron Market Volume (Kilo Tons) and Value (US$ Mn) Forecast, by Form, 2020–2031
8.5.5. Canada Direct Reduced Iron Market Volume (Kilo Tons) and Value (US$ Mn) Forecast, by Production Process, 2020–2031
8.5.6. Canada Direct Reduced Iron Market Volume (Kilo Tons) and Value (US$ Mn) Forecast, by Grade, 2020–2031
8.6. North America Direct Reduced Iron Market Attractiveness Analysis
9. Europe Direct Reduced Iron Market Analysis and Forecast, 2020–2031
9.1. Key Findings
9.2. Europe Direct Reduced Iron Market Volume (Kilo Tons) and Value (US$ Mn) Forecast, by Form, 2020–2031
9.3. Europe Direct Reduced Iron Market Volume (Kilo Tons) and Value (US$ Mn) Forecast, by Production Process, 2020–2031
9.4. Europe Direct Reduced Iron Market Volume (Kilo Tons) and Value (US$ Mn) Forecast, by Grade, 2020–2031
9.5. Europe Direct Reduced Iron Market Volume (Kilo Tons) and Value (US$ Mn) Forecast, by Country and Sub-region, 2020-2031
9.5.1. Germany Direct Reduced Iron Market Volume (Kilo Tons) and Value (US$ Mn) Forecast, by Form, 2020–2031
9.5.2. Germany Direct Reduced Iron Market Volume (Kilo Tons) and Value (US$ Mn) Forecast, by Production Process, 2020–2031
9.5.3. Germany Direct Reduced Iron Market Volume (Kilo Tons) and Value (US$ Mn) Forecast, by Grade, 2020–2031
9.5.4. France Direct Reduced Iron Market Volume (Kilo Tons) and Value (US$ Mn) Forecast, by Form, 2020–2031
9.5.5. France Direct Reduced Iron Market Volume (Kilo Tons) and Value (US$ Mn) Forecast, by Production Process, 2020–2031
9.5.6. France Direct Reduced Iron Market Volume (Kilo Tons) and Value (US$ Mn) Forecast, by Grade 2020–2031
9.5.7. U.K. Direct Reduced Iron Market Volume (Kilo Tons) and Value (US$ Mn) Forecast, by Form, 2020–2031
9.5.8. U.K. Direct Reduced Iron Market Volume (Kilo Tons) and Value (US$ Mn) Forecast, by Production Process, 2020–2031
9.5.9. U.K. Direct Reduced Iron Market Volume (Kilo Tons) and Value (US$ Mn) Forecast, by Grade, 2020–2031
9.5.10. Italy Direct Reduced Iron Market Volume (Kilo Tons) and Value (US$ Mn) Forecast, by Form, 2020–2031
9.5.11. Italy Direct Reduced Iron Market Volume (Kilo Tons) and Value (US$ Mn) Forecast, by Production Process, 2020–2031
9.5.12. Italy Direct Reduced Iron Market Volume (Kilo Tons) and Value (US$ Mn) Forecast, by Grade, 2020–2031
9.5.13. Russia & CIS Direct Reduced Iron Market Volume (Kilo Tons) and Value (US$ Mn) Forecast, by Form, 2020–2031
9.5.14. Russia & CIS Direct Reduced Iron Market Volume (Kilo Tons) and Value (US$ Mn) Forecast, by Production Process, 2020–2031
9.5.15. Russia & CIS Direct Reduced Iron Market Volume (Kilo Tons) and Value (US$ Mn) Forecast, by Grade, 2020–2031
9.5.16. Rest of Europe Direct Reduced Iron Market Volume (Kilo Tons) and Value (US$ Mn) Forecast, by Form, 2020–2031
9.5.17. Rest of Europe Direct Reduced Iron Market Volume (Kilo Tons) and Value (US$ Mn) Forecast, by Production Process, 2020–2031
9.5.18. Rest of Europe Direct Reduced Iron Market Volume (Kilo Tons) and Value (US$ Mn) Forecast, by Grade, 2020–2031
9.6. Europe Direct Reduced Iron Market Attractiveness Analysis
10. Asia Pacific Direct Reduced Iron Market Analysis and Forecast, 2020–2031
10.1. Key Findings
10.2. Asia Pacific Direct Reduced Iron Market Volume (Kilo Tons) and Value (US$ Mn) Forecast, by Form
10.3. Asia Pacific Direct Reduced Iron Market Volume (Kilo Tons) and Value (US$ Mn) Forecast, by Production Process, 2020–2031
10.4. Asia Pacific Direct Reduced Iron Market Volume (Kilo Tons) and Value (US$ Mn) Forecast, by Grade, 2020–2031
10.5. Asia Pacific Direct Reduced Iron Market Volume (Kilo Tons) and Value (US$ Mn) Forecast, by Country and Sub-region, 2020-2031
10.5.1. China Direct Reduced Iron Market Volume (Kilo Tons) and Value (US$ Mn) Forecast, by Form, 2020–2031
10.5.2. China Direct Reduced Iron Market Volume (Kilo Tons) and Value (US$ Mn) Forecast, by Production Process, 2020–2031
10.5.3. China Direct Reduced Iron Market Volume (Kilo Tons) and Value (US$ Mn) Forecast, by Grade, 2020–2031
10.5.4. Japan Direct Reduced Iron Market Volume (Kilo Tons) and Value (US$ Mn) Forecast, by Form, 2020–2031
10.5.5. Japan Direct Reduced Iron Market Volume (Kilo Tons) and Value (US$ Mn) Forecast, by Production Process, 2020–2031
10.5.6. Japan Direct Reduced Iron Market Volume (Kilo Tons) and Value (US$ Mn) Forecast, Grade, 2020–2031
10.5.7. India Direct Reduced Iron Market Volume (Kilo Tons) and Value (US$ Mn) Forecast, by Form, 2020–2031
10.5.8. India Direct Reduced Iron Market Volume (Kilo Tons) and Value (US$ Mn) Forecast, by Production Process, 2020–2031
10.5.9. India Direct Reduced Iron Market Volume (Kilo Tons) and Value (US$ Mn) Forecast, by Grade, 2020–2031
10.5.10. ASEAN Direct Reduced Iron Market Volume (Kilo Tons) and Value (US$ Mn) Forecast, by Form, 2020–2031
10.5.11. ASEAN Direct Reduced Iron Market Volume (Kilo Tons) and Value (US$ Mn) Forecast, by Production Process, 2020–2031
10.5.12. ASEAN Direct Reduced Iron Market Volume (Kilo Tons) and Value (US$ Mn) Forecast, by Grade, 2020–2031
10.5.13. Rest of Asia Pacific Direct Reduced Iron Market Volume (Kilo Tons) and Value (US$ Mn) Forecast, by Form, 2020–2031
10.5.14. Rest of Asia Pacific Direct Reduced Iron Market Volume (Kilo Tons) and Value (US$ Mn) Forecast, by Production Process, 2020–2031
10.5.15. Rest of Asia Pacific Direct Reduced Iron Market Volume (Kilo Tons) and Value (US$ Mn) Forecast, by Grade, 2020–2031
10.6. Asia Pacific Direct Reduced Iron Market Attractiveness Analysis
11. Latin America Direct Reduced Iron Market Analysis and Forecast, 2020–2031
11.1. Key Findings
11.2. Latin America Direct Reduced Iron Market Volume (Kilo Tons) and Value (US$ Mn) Forecast, by Form, 2020–2031
11.3. Latin America Direct Reduced Iron Market Volume (Kilo Tons) and Value (US$ Mn) Forecast, by Production Process, 2020–2031
11.4. Latin America Direct Reduced Iron Market Volume (Kilo Tons) and Value (US$ Mn) Forecast, by Grade, 2020–2031
11.5. Latin America Direct Reduced Iron Market Volume (Kilo Tons) and Value (US$ Mn) Forecast, by Country and Sub-region, 2020-2031
11.5.1. Brazil Direct Reduced Iron Market Volume (Kilo Tons) and Value (US$ Mn) Forecast, by Form, 2020–2031
11.5.2. Brazil Direct Reduced Iron Market Volume (Kilo Tons) and Value (US$ Mn) Forecast, by Production Process, 2020–2031
11.5.3. Brazil Direct Reduced Iron Market Volume (Kilo Tons) and Value (US$ Mn) Forecast, Grade, 2020–2031
11.5.4. Mexico Direct Reduced Iron Market Volume (Kilo Tons) and Value (US$ Mn) Forecast, by Form, 2020–2031
11.5.5. Mexico Direct Reduced Iron Market Volume (Kilo Tons) and Value (US$ Mn) Forecast, by Production Process, 2020–2031
11.5.6. Mexico Direct Reduced Iron Market Volume (Kilo Tons) and Value (US$ Mn) Forecast, by Grade, 2020–2031
11.5.7. Rest of Latin America Direct Reduced Iron Market Volume (Kilo Tons) and Value (US$ Mn) Forecast, by Form, 2020–2031
11.5.8. Rest of Latin America Direct Reduced Iron Market Volume (Kilo Tons) and Value (US$ Mn) Forecast, by Production Process, 2020–2031
11.5.9. Rest of Latin America Direct Reduced Iron Market Volume (Kilo Tons) and Value (US$ Mn) Forecast, by Grade, 2020–2031
11.6. Latin America Direct Reduced Iron Market Attractiveness Analysis
12. Middle East & Africa Direct Reduced Iron Market Analysis and Forecast, 2020–2031
12.1. Key Findings
12.2. Middle East & Africa Direct Reduced Iron Market Volume (Kilo Tons) and Value (US$ Mn) Forecast, by Form, 2020–2031
12.3. Middle East & Africa Direct Reduced Iron Market Volume (Kilo Tons) and Value (US$ Mn) Forecast, by Production Process, 2020–2031
12.4. Middle East & Africa Direct Reduced Iron Market Volume (Kilo Tons) and Value (US$ Mn) Forecast, by Grade, 2020–2031
12.5. Middle East & Africa Direct Reduced Iron Market Volume (Kilo Tons) and Value (US$ Mn) Forecast, by Country and Sub-region, 2020-2031
12.5.1. GCC Direct Reduced Iron Market Volume (Kilo Tons) and Value (US$ Mn) Forecast, by Form, 2020–2031
12.5.2. GCC Direct Reduced Iron Market Volume (Kilo Tons) and Value (US$ Mn) Forecast, by Production Process, 2020–2031
12.5.3. GCC Direct Reduced Iron Market Volume (Kilo Tons) and Value (US$ Mn) Forecast, by Grade, 2020–2031
12.5.4. South Africa Direct Reduced Iron Market Volume (Kilo Tons) and Value (US$ Mn) Forecast, by Form, 2020–2031
12.5.5. South Africa Direct Reduced Iron Market Volume (Kilo Tons) and Value (US$ Mn) Forecast, by Production Process, 2020–2031
12.5.6. South Africa Direct Reduced Iron Market Volume (Kilo Tons) and Value (US$ Mn) Forecast, by Grade, 2020–2031
12.5.7. Rest of Middle East & Africa Direct Reduced Iron Market Volume (Kilo Tons) and Value (US$ Mn) Forecast, by Form, 2020–2031
12.5.8. Rest of Middle East & Africa Direct Reduced Iron Market Volume (Kilo Tons) and Value (US$ Mn) Forecast, by Production Process, 2020–2031
12.5.9. Rest of Middle East & Africa Direct Reduced Iron Market Volume (Kilo Tons) and Value (US$ Mn) Forecast, by Grade, 2020–2031
12.6. Middle East & Africa Direct Reduced Iron Market Attractiveness Analysis
13. Competition Landscape
13.1. Global Direct Reduced Iron Company Market Share Analysis, 2020
13.2. Company Profiles (Details – Overview, Financials, Recent Developments, and Strategy)
13.2.1. Qatar Steel
13.2.1.1. Company Description
13.2.1.2. Business Overview
13.2.1.3. Financial Overview
13.2.1.4. Strategic Overview
13.2.2. JSW Ispat Special Products Limited
13.2.2.1. Company Description
13.2.2.2. Business Overview
13.2.2.3. Financial Overview
13.2.2.4. Strategic Overview
13.2.3. Kobe Steel Ltd
13.2.3.1. Company Description
13.2.3.2. Business Overview
13.2.3.3. Financial Overview
13.2.3.4. Strategic Overview
13.2.4. ArcelorMittal
13.2.4.1. Company Description
13.2.4.2. Business Overview
13.2.4.3. Financial Overview
13.2.4.4. Strategic Overview
13.2.5. NUCOR
13.2.5.1. Company Description
13.2.5.2. Business Overview
13.2.5.3. Financial Overview
13.2.5.4. Strategic Overview
13.2.6. Midrex Technologies Inc.
13.2.6.1. Company Description
13.2.6.2. Business Overview
13.2.6.3. Financial Overview
13.2.6.4. Strategic Overview
13.2.7. Khouzestan Steel Company
13.2.7.1. Company Description
13.2.7.2. Business Overview
13.2.7.3. Financial Overview
13.2.7.4. Strategic Overview
13.2.8. Gallantt Group of Industries
13.2.8.1. Company Description
13.2.8.2. Business Overview
13.2.8.3. Financial Overview
13.2.8.4. Strategic Overview
13.2.9. Welspun Group
13.2.9.1. Company Description
13.2.9.2. Business Overview
13.2.9.3. Financial Overview
13.2.9.4. Strategic Overview
13.2.10. Jindal Shadeed Iron & Steel LLC
13.2.10.1. Company Description
13.2.10.2. Business Overview
13.2.10.3. Financial Overview
13.2.10.4. Strategic Overview
13.2.11. AM/NS India
13.2.11.1. Company Description
13.2.11.2. Business Overview
13.2.11.3. Financial Overview
13.2.11.4. Strategic Overview
13.2.12. Tosyali Algeria A.S.
13.2.12.1. Company Description
13.2.12.2. Business Overview
13.2.12.3. Financial Overview
13.2.12.4. Strategic Overview
13.2.13. Tuwairqi Steel Mills Limited
13.2.13.1. Company Description
13.2.13.2. Business Overview
13.2.13.3. Financial Overview
13.2.13.4. Strategic Overview
14. Primary Research: Key Insights
15. Appendix
List of Tables
Table 1: Global Direct Reduced Iron Market Volume (Kilo Tons) Forecast, by Form, 2020–2031
Table 2: Global Direct Reduced Iron Market Value (US$ Mn) Forecast, by Form, 2020–2031
Table 3: Global Direct Reduced Iron Market Volume (Kilo Tons) Forecast, by Production Process, 2020–2031
Table 4: Global Direct Reduced Iron Market Value (US$ Mn) Forecast, by Production Process, 2020–2031
Table 5: Global Direct Reduced Iron Market Volume (Kilo Tons) Forecast, by Grade, 2020–2031
Table 6: Global Direct Reduced Iron Market Value (US$ Mn) Forecast, by Grade, 2020–2031
Table 7: Global Direct Reduced Iron Market Volume (Kilo Tons) Forecast, by Region, 2020–2031
Table 8: Global Direct Reduced Iron Market Value (US$ Mn) Forecast, by Region, 2020–2031
Table 9: North America Direct Reduced Iron Market Volume (Kilo Tons) Forecast, by Form, 2020–2031
Table 10: North America Direct Reduced Iron Market Value (US$ Mn) Forecast, by Form, 2020–2031
Table 11: North America Direct Reduced Iron Market Volume (Kilo Tons) Forecast, by Production Process, 2020–2031
Table 12: North America Direct Reduced Iron Market Value (US$ Mn) Forecast, by Production Process,2020–2031
Table 13: North America Direct Reduced Iron Market Volume (Kilo Tons) Forecast, by Grade, 2020–2031
Table 14: North America Direct Reduced Iron Market Value (US$ Mn) Forecast, by Grade, 2020–2031
Table 15: North America Direct Reduced Iron Market Volume (Kilo Tons) Forecast, by Country, 2020–2031
Table 16: North America Direct Reduced Iron Market Value (US$ Mn) Forecast, by Country, 2020–2031
Table 17: U.S. Direct Reduced Iron Market Volume (Kilo Tons) Forecast, by Form, 2020–2031
Table 18: U.S. Direct Reduced Iron Market Value (US$ Mn) Forecast, by Form, 2020–2031
Table 19: U.S. Direct Reduced Iron Market Volume (Kilo Tons) Forecast, by Production Process, 2020–2031
Table 20: U.S. Direct Reduced Iron Market Value (US$ Mn) Forecast, by Production Process, 2020–2031
Table 21: U.S. Direct Reduced Iron Market Volume (Kilo Tons) Forecast, by Grade, 2020–2031
Table 22: U.S. Direct Reduced Iron Market Value (US$ Mn) Forecast, by Grade, 2020–2031
Table 23: Canada Direct Reduced Iron Market Volume (Kilo Tons) Forecast, by Form, 2020–2031
Table 24: Canada Direct Reduced Iron Market Value (US$ Mn) Forecast, by Form, 2020–2031
Table 25: Canada Direct Reduced Iron Market Volume (Kilo Tons) Forecast, by Production Process, 2020–2031
Table 26: Canada Direct Reduced Iron Market Value (US$ Mn) Forecast, by Production Process, 2020–2031
Table 27: Canada Direct Reduced Iron Market Volume (Kilo Tons) Forecast, by Grade, 2020–2031
Table 28: Canada Direct Reduced Iron Market Value (US$ Mn) Forecast, by Grade, 2020–2031
Table 29: Europe Direct Reduced Iron Market Volume (Kilo Tons) Forecast, by Form, 2020–2031
Table 30: Europe Direct Reduced Iron Market Value (US$ Mn) Forecast, by Form, 2020–2031
Table 31: Europe Direct Reduced Iron Market Volume (Kilo Tons) Forecast, by Production Process ,2020–2031
Table 32: Europe Direct Reduced Iron Market Value (US$ Mn) Forecast, by Production Process, 2020–2031
Table 33: Europe Direct Reduced Iron Market Volume (Kilo Tons) Forecast, by Grade, 2020–2031
Table 34: Europe Direct Reduced Iron Market Value (US$ Mn) Forecast, by Grade, 2020–2031
Table 35: Europe Direct Reduced Iron Market Volume (Kilo Tons) Forecast, by Country and Sub-region, 2020–2031
Table 36: Europe Direct Reduced Iron Market Value (US$ Mn) Forecast, by Country and Sub-region, 2020–2031
Table 37: Germany Direct Reduced Iron Market Volume (Kilo Tons) Forecast, by Form, 2020–2031
Table 38: Germany Direct Reduced Iron Market Value (US$ Mn) Forecast, by Form, 2020–2031
Table 39: Germany Direct Reduced Iron Market Volume (Kilo Tons) Forecast, by Production Process, 2020–2031
Table 40: Germany Direct Reduced Iron Market Value (US$ Mn) Forecast, by Production Process, 2020–2031
Table 41: Germany Direct Reduced Iron Market Volume (Kilo Tons) Forecast, by Grade, 2020–2031
Table 42: Germany Direct Reduced Iron Market Value (US$ Mn) Forecast, by Grade, 2020–2031
Table 43: France Direct Reduced Iron Market Volume (Kilo Tons) Forecast, by Form, 2020–2031
Table 44: France Direct Reduced Iron Market Value (US$ Mn) Forecast, by Form, 2020–2031
Table 45: France Direct Reduced Iron Market Volume (Kilo Tons) Forecast, by Production Process, 2020–2031
Table 46: France Direct Reduced Iron Market Value (US$ Mn) Forecast, by Production Process, 2020–2031
Table 47: France Direct Reduced Iron Market Volume (Kilo Tons) Forecast, by Grade 2020–2031
Table 48: France Direct Reduced Iron Market Value (US$ Mn) Forecast, by Grade 2020–2031
Table 49: U.K. Direct Reduced Iron Market Volume (Kilo Tons) Forecast, by Form, 2020–2031
Table 50: U.K. Direct Reduced Iron Market Value (US$ Mn) Forecast, by Form, 2020–2031
Table 51: U.K. Direct Reduced Iron Market Volume (Kilo Tons) Forecast, by Production Process, 2020–2031
Table 52: U.K. Direct Reduced Iron Market Value (US$ Mn) Forecast, by Production Process, 2020–2031
Table 53: U.K. Direct Reduced Iron Market Volume (Kilo Tons) Forecast, by Grade, 2020–2031
Table 54: U.K. Direct Reduced Iron Market Value (US$ Mn) Forecast, by Grade, 2020–2031
Table 55: Italy Direct Reduced Iron Market Volume (Kilo Tons) Forecast, by Form, 2020–2031
Table 56: Italy Direct Reduced Iron Market Value (US$ Mn) Forecast, by Form, 2020–2031
Table 57: Italy Direct Reduced Iron Market Volume (Kilo Tons) Forecast, by Production Process, 2020–2031
Table 58: Italy Direct Reduced Iron Market Value (US$ Mn) Forecast, by Production Process, 2020–2031
Table 59: Italy Direct Reduced Iron Market Volume (Kilo Tons) Forecast, by Grade, 2020–2031
Table 60: Italy Direct Reduced Iron Market Value (US$ Mn) Forecast, by Grade, 2020–2031
Table 61: Russia & CIS Direct Reduced Iron Market Volume (Kilo Tons) Forecast, by Form, 2020–2031
Table 62: Russia & CIS Direct Reduced Iron Market Value (US$ Mn) Forecast, by Form, 2020–2031
Table 63: Russia & CIS Direct Reduced Iron Market Volume (Kilo Tons) Forecast, by Production Process, 2020–2031
Table 64: Russia & CIS Direct Reduced Iron Market Value (US$ Mn) Forecast, by Production Process, 2020–2031
Table 65: Russia & CIS Direct Reduced Iron Market Volume (Kilo Tons) Forecast, by Grade, 2020–2031
Table 66: Russia & CIS Direct Reduced Iron Market Value (US$ Mn) Forecast, by Grade, 2020–2031
Table 67: Rest of Europe Direct Reduced Iron Market Volume (Kilo Tons) Forecast, by Form, 2020–2031
Table 68: Rest of Europe Direct Reduced Iron Market Value (US$ Mn) Forecast, by Form, 2020–2031
Table 69: Rest of Europe Direct Reduced Iron Market Volume (Kilo Tons) Forecast, by Production Process, 2020–2031
Table 70: Rest of Europe Direct Reduced Iron Market Value (US$ Mn) Forecast, by Production Process,2020–2031
Table 71: Rest of Europe Direct Reduced Iron Market Volume (Kilo Tons) Forecast, by Grade, 2020–2031
Table 72: Rest of Europe Direct Reduced Iron Market Value (US$ Mn) Forecast, by Grade, 2020–2031
Table 73: Asia Pacific Direct Reduced Iron Market Volume (Kilo Tons) Forecast, by Form, 2020–2031
Table 74: Asia Pacific Direct Reduced Iron Market Value (US$ Mn) Forecast, by Form, 2020–2031
Table 75: Asia Pacific Direct Reduced Iron Market Volume (Kilo Tons) Forecast, by Production Process, 2020–2031
Table 76: Asia Pacific Direct Reduced Iron Market Value (US$ Mn) Forecast, by Production Process, 2020–2031
Table 77: Asia Pacific Direct Reduced Iron Market Volume (Kilo Tons) Forecast, by Grade 2020–2031
Table 78: Asia Pacific Direct Reduced Iron Market Value (US$ Mn) Forecast, by Grade 2020–2031
Table 79: Asia Pacific Direct Reduced Iron Market Volume (Kilo Tons) Forecast, by Country and Sub-region, 2020–2031
Table 80: Asia Pacific Direct Reduced Iron Market Value (US$ Mn) Forecast, by Country and Sub-region, 2020–2031
Table 81: China Direct Reduced Iron Market Volume (Kilo Tons) Forecast, by Form, 2020–2031
Table 82: China Direct Reduced Iron Market Value (US$ Mn) Forecast, by Form, 2020–2031
Table 83: China Direct Reduced Iron Market Volume (Kilo Tons) Forecast, by Production Process, 2020–2031
Table 84: China Direct Reduced Iron Market Value (US$ Mn) Forecast, by Production Process, 2020–2031
Table 85: China Direct Reduced Iron Market Volume (Kilo Tons) Forecast, by Grade, 2020–2031
Table 86: China Direct Reduced Iron Market Value (US$ Mn) Forecast, by Grade, 2020–2031
Table 87: Japan Direct Reduced Iron Market Volume (Kilo Tons) Forecast, by Form, 2020–2031
Table 88: Japan Direct Reduced Iron Market Value (US$ Mn) Forecast, by Form, 2020–2031
Table 89: Japan Direct Reduced Iron Market Volume (Kilo Tons) Forecast, by Production Process, 2020–2031
Table 90: Japan Direct Reduced Iron Market Value (US$ Mn) Forecast, by Production Process, 2020–2031
Table 91: Japan Direct Reduced Iron Market Volume (Kilo Tons) Forecast, by Grade, 2020–2031
Table 92: Japan Direct Reduced Iron Market Value (US$ Mn) Forecast, by Grade, 2020–2031
Table 93: India Direct Reduced Iron Market Volume (Kilo Tons) Forecast, by Form, 2020–2031
Table 94: India Direct Reduced Iron Market Value (US$ Mn) Forecast, by Form, 2020–2031
Table 95: India Direct Reduced Iron Market Volume (Kilo Tons) Forecast, by Production Process, 2020–2031
Table 96: India Direct Reduced Iron Market Value (US$ Mn) Forecast, by Production Process, 2020–2031
Table 97: India Direct Reduced Iron Market Volume (Kilo Tons) Forecast, by Grade, 2020–2031
Table 98: India Direct Reduced Iron Market Value (US$ Mn) Forecast, by Grade, 2020–2031
Table 99: ASEAN Direct Reduced Iron Market Volume (Kilo Tons) Forecast, by Form, 2020–2031
Table 100: ASEAN Direct Reduced Iron Market Value (US$ Mn) Forecast, by Form, 2020–2031
Table 101: ASEAN Direct Reduced Iron Market Volume (Kilo Tons) Forecast, by Production Process,2020–2031
Table 102: ASEAN Direct Reduced Iron Market Value (US$ Mn) Forecast, by Production Process, 2020–2031
Table 103: ASEAN Direct Reduced Iron Market Volume (Kilo Tons) Forecast, by Grade, 2020–2031
Table 104: ASEAN Direct Reduced Iron Market Value (US$ Mn) Forecast, by Grade, 2020–2031
Table 105: Rest of Asia Pacific Direct Reduced Iron Market Volume (Kilo Tons) Forecast, by Form, 2020–2031
Table 106: Rest of Asia Pacific Direct Reduced Iron Market Value (US$ Mn) Forecast, by Form, 2020–2031
Table 107: Rest of Asia Pacific Direct Reduced Iron Market Volume (Kilo Tons) Forecast, by Production Process, 2020–2031
Table 108: Rest of Asia Pacific Direct Reduced Iron Market Value (US$ Mn) Forecast, by Production Process, 2020–2031
Table 109: Rest of Asia Pacific Direct Reduced Iron Market Volume (Kilo Tons) Forecast, by Grade, 2020–2031
Table 110: Rest of Asia Pacific Direct Reduced Iron Market Value (US$ Mn) Forecast, by Grade, 2020–2031
Table 111: Latin America Direct Reduced Iron Market Volume (Kilo Tons) Forecast, by Form, 2020–2031
Table 112: Latin America Direct Reduced Iron Market Value (US$ Mn) Forecast, by Form, 2020–2031
Table 113: Latin America Direct Reduced Iron Market Volume (Kilo Tons) Forecast, by Production Process, 2020–2031
Table 114: Latin America Direct Reduced Iron Market Value (US$ Mn) Forecast, by Production Process, 2020–2031
Table 115: Latin America Direct Reduced Iron Market Volume (Kilo Tons) Forecast, by Grade, 2020–2031
Table 116: Latin America Direct Reduced Iron Market Value (US$ Mn) Forecast, by Grade, 2020–2031
Table 117: Latin America Direct Reduced Iron Market Volume (Kilo Tons) Forecast, by Country and Sub-region, 2020–2031
Table 118: Latin America Direct Reduced Iron Market Value (US$ Mn) Forecast, by Country and Sub-region, 2020–2031
Table 119: Brazil Direct Reduced Iron Market Volume (Kilo Tons) Forecast, by Form, 2020–2031
Table 120: Brazil Direct Reduced Iron Market Value (US$ Mn) Forecast, by Form, 2020–2031
Table 121: Brazil Direct Reduced Iron Market Volume (Kilo Tons) Forecast, by Production Process, 2020–2031
Table 122: Brazil Direct Reduced Iron Market Value (US$ Mn) Forecast, by Production Process, 2020–2031
Table 123: Brazil Direct Reduced Iron Market Volume (Kilo Tons) Forecast, by Grade, 2020–2031
Table 124: Brazil Direct Reduced Iron Market Value (US$ Mn) Forecast, by Grade, 2020–2031
Table 125: Mexico Direct Reduced Iron Market Volume (Kilo Tons) Forecast, by Form, 2020–2031
Table 126: Mexico Direct Reduced Iron Market Value (US$ Mn) Forecast, by Form, 2020–2031
Table 127: Mexico Direct Reduced Iron Market Volume (Kilo Tons) Forecast, by Production Process,2020–2031
Table 128: Mexico Direct Reduced Iron Market Value (US$ Mn) Forecast, by Production Process, 2020–2031
Table 129: Mexico Direct Reduced Iron Market Volume (Kilo Tons) Forecast, by Grade, 2020–2031
Table 130: Mexico Direct Reduced Iron Market Value (US$ Mn) Forecast, by Grade, 2020–2031
Table 131: Rest of Latin America Direct Reduced Iron Market Volume (Kilo Tons) Forecast, by Form, 2020–2031
Table 132: Rest of Latin America Direct Reduced Iron Market Value (US$ Mn) Forecast, by Form, 2020–2031
Table 133: Rest of Latin America Direct Reduced Iron Market Volume (Kilo Tons) Forecast, by Production Process 2020–2031
Table 134: Rest of Latin America Direct Reduced Iron Market Value (US$ Mn) Forecast, by Production Process, 2020–2031
Table 135: Rest of Latin America Direct Reduced Iron Market Volume (Kilo Tons) Forecast, by Grade, 2020–2031
Table 136: Rest of Latin America Direct Reduced Iron Market Value (US$ Mn) Forecast, by Grade, 2020–2031
Table 137: Middle East & Africa Direct Reduced Iron Market Volume (Kilo Tons) Forecast, by Form, 2020–2031
Table 138: Middle East & Africa Direct Reduced Iron Market Value (US$ Mn) Forecast, by Form, 2020–2031
Table 139: Middle East & Africa Direct Reduced Iron Market Volume (Kilo Tons) Forecast, by Production Process, 2020–2031
Table 140: Middle East & Africa Direct Reduced Iron Market Value (US$ Mn) Forecast, by Production Process, 2020–2031
Table 141: Middle East & Africa Direct Reduced Iron Market Volume (Kilo Tons) Forecast, by Grade, 2020–2031
Table 142: Middle East & Africa Direct Reduced Iron Market Value (US$ Mn) Forecast, by Grade, 2020–2031
Table 143: Middle East & Africa Direct Reduced Iron Market Volume (Kilo Tons) Forecast, by Country and Sub-region, 2020–2031
Table 144: Middle East & Africa Direct Reduced Iron Market Value (US$ Mn) Forecast, by Country and Sub-region, 2020–2031
Table 145: GCC Direct Reduced Iron Market Volume (Kilo Tons) Forecast, by Form, 2020–2031
Table 146: GCC Direct Reduced Iron Market Value (US$ Mn) Forecast, by Form, 2020–2031
Table 147: GCC Direct Reduced Iron Market Volume (Kilo Tons) Forecast, by Production Process, 2020–2031
Table 148: GCC Direct Reduced Iron Market Value (US$ Mn) Forecast, by Production Process, 2020–2031
Table 149: GCC Direct Reduced Iron Market Volume (Kilo Tons) Forecast, by Grade, 2020–2031
Table 150: GCC Direct Reduced Iron Market Value (US$ Mn) Forecast, by Grade, 2020–2031
Table 151: South Africa Direct Reduced Iron Market Volume (Kilo Tons) Forecast, by Form, 2020–2031
Table 152: South Africa Direct Reduced Iron Market Value (US$ Mn) Forecast, by Form, 2020–2031
Table 153: South Africa Direct Reduced Iron Market Volume (Kilo Tons) Forecast, by Production Process,,2020–2031
Table 154: South Africa Direct Reduced Iron Market Value (US$ Mn) Forecast, by Production Process, 2020–2031
Table 155: South Africa Direct Reduced Iron Market Volume (Kilo Tons) Forecast, by Grade, 2020–2031
Table 156: South Africa Direct Reduced Iron Market Value (US$ Mn) Forecast, by Grade, 2020–2031
Table 157: Rest of Middle East & Africa Direct Reduced Iron Market Volume (Kilo Tons) Forecast, by Form, 2020–2031
Table 158: Rest of Middle East & Africa Direct Reduced Iron Market Value (US$ Mn) Forecast, by Form, 2020–2031
Table 159: Rest of Middle East & Africa Direct Reduced Iron Market Volume (Kilo Tons) Forecast, by Production Process, 2020–2031
Table 160: Rest of Middle East & Africa Direct Reduced Iron Market Value (US$ Mn) Forecast, by Production Process, 2020–2031
Table 161: Rest of Middle East & Africa Direct Reduced Iron Market Volume (Kilo Tons) Forecast, by Grade, 2020–2031
Table 162: Rest of Middle East & Africa Direct Reduced Iron Market Value (US$ Mn) Forecast, by Grade, 2020–2031
List of Figures
Figure 1: Global Direct Reduced Iron Market Volume Share Analysis, by Form, 2020, 2025, and 2031
Figure 2: Global Direct Reduced Iron Market Attractiveness, by Form
Figure 3: Global Direct Reduced Iron Market Volume Share Analysis, by Production Process, 2020, 2025, and 2031
Figure 4: Global Direct Reduced Iron Market Attractiveness, by Production Process
Figure 5: Global Direct Reduced Iron Market Volume Share Analysis, by Grade, 2020, 2025, and 2031
Figure 6: Global Direct Reduced Iron Market Attractiveness, by Grade
Figure 7: Global Direct Reduced Iron Market Volume Share Analysis, by Region, 2020, 2025, and 2031
Figure 8: Global Direct Reduced Iron Market Attractiveness, by Region
Figure 9: North America Direct Reduced Iron Market Volume Share Analysis, by Form, 2020, 2025, and 2031
Figure 10: North America Direct Reduced Iron Market Attractiveness, by Form
Figure 11: North America Direct Reduced Iron Market Volume Share Analysis, by Production Process, 2020, 2025, and 2031
Figure 12: North America Direct Reduced Iron Market Attractiveness, by Production Process
Figure 13: North America Direct Reduced Iron Market Volume Share Analysis, by Grade, 2020, 2025, and 2031
Figure 14: North America Direct Reduced Iron Market Attractiveness, by Grade
Figure 15: North America Direct Reduced Iron Market Volume Share Analysis, by Region, 2020, 2025, and 2031
Figure 16: North America Direct Reduced Iron Market Attractiveness, by Country
Figure 17: Europe Direct Reduced Iron Market Volume Share Analysis, by Form, 2020, 2025, and 2031
Figure 18: Europe Direct Reduced Iron Market Attractiveness, by Form
Figure 19: Europe Direct Reduced Iron Market Volume Share Analysis, by Production Process, 2020, 2025, and 2031
Figure 20: Europe Direct Reduced Iron Market Attractiveness, by Production Process
Figure 21: Europe Direct Reduced Iron Market Volume Share Analysis, by Grade, 2020, 2025, and 2031
Figure 22: Europe Direct Reduced Iron Market Attractiveness, by Grade
Figure 23: Europe Direct Reduced Iron Market Volume Share Analysis, by Region, 2020, 2025, and 2031
Figure 24: Europe Direct Reduced Iron Market Attractiveness, by Country and Sub-region
Figure 25: Asia Pacific Direct Reduced Iron Market Volume Share Analysis, by Form, 2020, 2025, and 2031
Figure 26: Asia Pacific Direct Reduced Iron Market Attractiveness, by Form
Figure 27: Asia Pacific Direct Reduced Iron Market Volume Share Analysis, by Production Process, 2020, 2025, and 2031
Figure 28: Asia Pacific Direct Reduced Iron Market Attractiveness, by Production Process
Figure 29: Asia Pacific Direct Reduced Iron Market Volume Share Analysis, by Country and Sub-region, 2020, 2025, and 2031
Figure 30: Asia Pacific Direct Reduced Iron Market Attractiveness, by Country and Sub-region
Figure 31: Latin America Direct Reduced Iron Market Volume Share Analysis, by Form, 2020, 2025, and 2031
Figure 32: Latin America Direct Reduced Iron Market Attractiveness, by Form
Figure 33: Latin America Direct Reduced Iron Market Volume Share Analysis, by Production Process, 2020, 2025, and 2031
Figure 34: Latin America Direct Reduced Iron Market Attractiveness, by Production Process
Figure 35: Latin America Direct Reduced Iron Market Volume Share Analysis, by Grade, 2020, 2025, and 2031
Figure 36: Latin America Direct Reduced Iron Market Attractiveness, by Grade
Figure 37: Latin America Direct Reduced Iron Market Volume Share Analysis, by Country and Sub-region, 2020, 2025, and 2031
Figure 38: Latin America Direct Reduced Iron Market Attractiveness, by Country and Sub-region
Figure 39: Middle East & Africa Direct Reduced Iron Market Volume Share Analysis, by Form, 2020, 2025, and 2031
Figure 40: Middle East & Africa Direct Reduced Iron Market Attractiveness, by Form
Figure 41: Middle East & Africa Direct Reduced Iron Market Volume Share Analysis, by Production Process, 2020, 2025, and 2031
Figure 42: Middle East & Africa Direct Reduced Iron Market Attractiveness, by Production Process
Figure 43: Middle East & Africa Direct Reduced Iron Market Volume Share Analysis, by Grade, 2020, 2025, and 2031
Figure 44: Middle East & Africa Direct Reduced Iron Market Attractiveness, by Grade
Figure 15: Middle East & Africa Direct Reduced Iron Market Volume Share Analysis, by Region, 2020, 2025, and 2031
Figure 46: Middle East & Africa Direct Reduced Iron Market Attractiveness, by Country and Sub-region
Copyright © Transparency Market Research, Inc. All Rights reserved
Trust Online

Direct Reduced Iron (DRI) Market
