Analysts’ Viewpoint on Digital Dentistry Materials & Systems Market Scenario
The CAD/CAM technology holds potential for limiting coronavirus infection risk and enables prosthetic restoration, which is transported by the deliveryman to the dentist and delivered to the patient. Although AR and VR systems are enabling better simulation of the 3D digital model, it poses ethical issues, as the dental practitioner & auxiliary teams are responsible for data handling with potential risks of data privacy and security breaches. Hence, participants in the digital dentistry materials & systems market should improve their infrastructure support such as computing power, which facilitates smooth processing of data and ensures its security & privacy. In order to achieve this, stakeholders should increase R&D in quantum supercomputing.
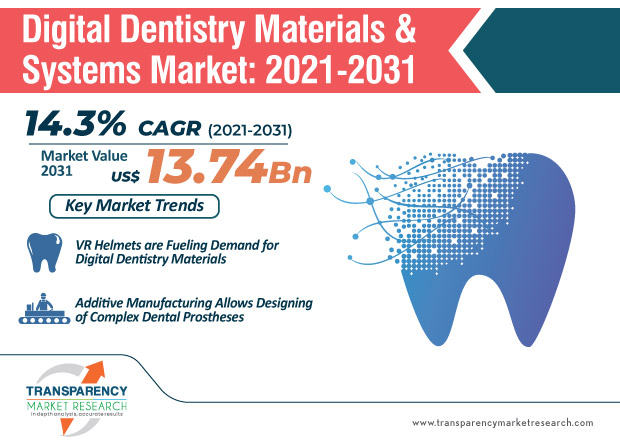
Augmented reality (AR) and virtual reality (VR) are significantly changing the digital dentistry materials & systems market. VR systems in the real world normally utilize a device such as helmets with the aim to stimulate responses from the user for further exploration based on virtual recreated three and four dimensions. Both systems and techniques are implemented through the user’s sensations either individually or in a combination of all haptic, auditory, hearing, and motor sensations.
AR and VR are paving the way for a plethora of applications and software that are enhancing the ability and capacity of dental practitioners.
Since dental professionals are at a high risk of contracting the novel coronavirus infections, computer‐aided design/computer‐aided manufacturing (CAD/CAM) technology and digital prosthetic workflows are being adopted. These workflows hold promising potentials to limit infection risk in dental practice. These workflows help to significantly reduce costs & working time and require fewer steps as compared to traditional workflows.
The digital prosthetic workflow has several benefits in terms of infection prevention and eliminates the need for impression disinfection. Companies in the digital dentistry materials & systems market are capitalizing on this opportunity to adapt with changing workflows. In digital prosthetic workflow, the dentist takes the digital impression from a potentially infectious patient and the STL (Standard Triangle Language) file is received by the laboratory in real-time and with no human contact.
Tele-dentistry and remote consultation are gaining prominence in the digital dentistry materials & systems market. However, challenges involving multiple chronic oral diseases and complex treatment in ageing population are emerging as hindrances for rapid adoption of teledentistry. Nevertheless, advantages such as bridging the gap for dental care disparities between urban and rural remote communities are contributing to the expansion of the tele-dentistry sector.
Tele-dentistry holds potential for new dentistry students to practice from any part of the world.
Additive manufacturing is gaining prominence in the digital dentistry materials & systems market. This is a rapid production process of any 3 dimensional (3D) object using 3D printers. The process allows a complex geometrical design to be produced with additional benefits such as the reduction of unnecessary raw material wastage and fast production of dental prostheses as compared to subtractive manufacturing.
Companies in the digital dentistry materials & systems market are increasing R&D in the production of a chairside dental model through a 3D printing method, which allows a quick reference to the dentist after the virtual designing is completed. This facilitates efficient treatment planning and communication between the dentist & patient.
The proliferation of IoMT (Internet of Medical Things) is translating into revenue opportunities for participants in the digital dentistry materials & systems market. IoMT is playing a key role in the management of digital oral health records. Health data can be derived from conventional medical and dental screening, routine check-ups, and hospitalization, along with other determinants such as socio-economic aspects including income and jobs. The exponential usage of digital devices such as smartphones, smartwatches, and online applications is providing an impetus to IoMT.
Public information such as participation of individuals in online surveys, research, and forums is helping to expand the IoMT sector.
|
Attribute |
Detail |
|
Market Size Value in 2020 (Base Year) |
US$ 2.9 Bn |
|
Market Forecast Value in 2031 |
US$ 13.7 Bn |
|
Growth Rate (CAGR) |
14.3% |
|
Forecast Period |
2021–2031 |
|
Quantitative Units |
US$ Mn for Value |
|
Market Analysis |
It includes cross segment analysis at regional level. Moreover, qualitative analysis includes drivers, restraints, opportunities, key trends, pricing analysis, and parent industry overview. |
|
Format |
Electronic (PDF) |
|
Market Segmentation |
|
|
Regions Covered |
|
|
Countries Covered |
|
|
Customization Scope |
Available upon request |
|
Pricing |
Available upon request |
Digital dentistry materials & systems market is expected to surpass the value of US$ 13.7 Bn by 2031
Digital dentistry materials & systems market is estimated to expand at a CAGR of 14.3% from 2021 to 2031
Digital dentistry materials & systems market is driven by rise in prevalence of dental diseases, and increase in geriatric population in need of dental surgeries
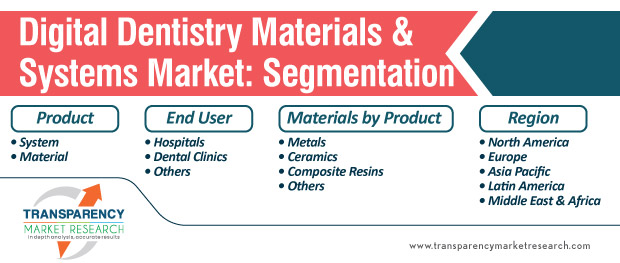
The systems segment is likely to account for major share of the global digital Dentistry Materials & Systems Market by 2031
Key players operating in the global digital dentistry materials & systems market include 3D Systems, Inc., VITA North America, Planmeca Oy, Carestream Dental LLC., Dentsply Sirona
1. Preface
1.1. Market Definition and Scope
1.2. Market Segmentation
1.3. Key Research Objectives
1.4. Research Highlights
2. Assumptions and Research Methodology
3. Executive Summary: Global Digital Dentistry Materials & Systems Market
4. Market Overview
4.1. Introduction
4.1.1. Definition
4.2. Overview
4.3. Market Dynamics
4.3.1. Drivers
4.3.2. Restraints
4.3.3. Opportunities
4.4. Global Digital Dentistry Materials & Systems Market Analysis and Forecast, 2017–2031
4.4.1. Market Revenue Projections (US$ Mn)
5. Key Insights
5.1. List of Raw Material Suppliers
5.2. Porter's Five Force Analysis
5.2.1. By Systems Manufacturers
5.2.2. By Dental Materials Suppliers/Manufacturer
5.3. Technological Advancement in Digital Dentistry: Overview
5.4. Key Industry Development in Dental Industry (investment, product launch, etc.)
5.5. Common Restorative Materials for Digital Dental: Overview
5.6. COVID-19 Impact Analysis
6. Global Digital Dentistry Materials & Systems Market Analysis and Forecast, by Product Type
6.1. Introduction & Definition
6.2. Key Findings / Developments
6.3. Market Value Forecast, by Product Type, 2017–2031
6.3.1. Systems
6.3.1.1. Dental 3D Printers
6.3.1.2. CAD/CAM system
6.3.1.2.1. Chairside CAD/CAM Systems
6.3.1.2.2. Laboratory-based CAD/CAM Systems
6.3.1.3. Tooth Shade System
6.3.1.4. 2D & 3D Dental Imaging Device
6.3.1.5. Intraoral Scanners
6.3.1.6. Others
6.3.2. Materials
6.3.2.1. Metals
6.3.2.2. Ceramic
6.3.2.3. Composite Resins
6.3.2.4. Others
6.4. Market Attractiveness Analysis, by Product
7. Global Digital Dentistry Materials & Systems Market Analysis and Forecast, by End-user
7.1. Introduction & Definition
7.2. Key Findings / Developments
7.3. Market Value Forecast, by End-user, 2017–2031
7.3.1. Hospitals
7.3.2. Dental Clinic
7.3.3. Others
7.4. Market Attractiveness Analysis, by End-user
8. Global Digital Dentistry Materials & Systems Market Analysis and Forecast, by Materials by Product
8.1. Introduction & Definition
8.2. Key Findings / Developments
8.3. Market Value Forecast, by Materials by Product, 2017–2031
8.3.1. Metals
8.3.1.1. Chairside CAD/CAM Systems
8.3.1.2. Lab CAD/CAM Systems
8.3.1.3. Dental 3D Printers
8.3.2. Ceramics
8.3.2.1. Chairside CAD/CAM Systems
8.3.2.2. Lab CAD/CAM Systems
8.3.2.3. Dental 3D Printers
8.3.3. Composite Resins
8.3.3.1. Chairside CAD/CAM Systems
8.3.3.2. Lab CAD/CAM Systems
8.3.3.3. Dental 3D Printers
8.3.4. Others
8.3.4.1. Chairside CAD/CAM Systems
8.3.4.2. Lab CAD/CAM Systems
8.3.4.3. Dental 3D Printers
8.4. Market Attractiveness Analysis, by Materials by Product
9. Global Digital Dentistry Materials & Systems Market Analysis and Forecast, by Region
9.1. Key Findings
9.2. Market Value Forecast, by Region
9.2.1. North America
9.2.2. Europe
9.2.3. Asia Pacific
9.2.4. Latin America
9.2.5. Middle East & Africa
9.3. Market Attractiveness Analysis, by Country/Region
10. North America Digital Dentistry Materials & Systems Market Analysis and Forecast
10.1. Introduction
10.1.1. Key Findings
10.2. Market Value Forecast, by Product, 2017–2031
10.2.1. Systems
10.2.1.1. Dental 3D Printers
10.2.1.2. CAD/CAM system
10.2.1.2.1. Chairside CAD/CAM Systems
10.2.1.2.2. Laboratory-based CAD/CAM Systems
10.2.1.3. Tooth Shade System
10.2.1.4. 2D & 3D Dental Imaging Device
10.2.1.5. Intraoral Scanners
10.2.1.6. Others
10.2.2. Materials
10.2.2.1. Metals
10.2.2.2. Ceramic
10.2.2.3. Composite Resins
10.2.2.4. Others
10.3. Market Value Forecast, by End-user, 2017–2031
10.3.1. Hospitals
10.3.2. Dental Clinic
10.3.3. Others
10.4. Market Value Forecast, by Materials by Product, 2017–2031
10.4.1. Metals
10.4.1.1. Chairside CAD/CAM Systems
10.4.1.2. Lab CAD/CAM Systems
10.4.1.3. Dental 3D Printers
10.4.2. Ceramic
10.4.2.1. Chairside CAD/CAM Systems
10.4.2.2. Lab CAD/CAM Systems
10.4.2.3. Dental 3D Printers
10.4.3. Composite Resins
10.4.3.1. Chairside CAD/CAM Systems
10.4.3.2. Lab CAD/CAM Systems
10.4.3.3. Dental 3D Printers
10.4.4. Others
10.4.4.1. Chairside CAD/CAM Systems
10.4.4.2. Lab CAD/CAM Systems
10.4.4.3. Dental 3D Printers
10.5. Market Value Forecast, by Country, 2017–2031
10.5.1. U.S.
10.5.2. Canada
10.6. Market Attractiveness Analysis
10.6.1. By Product
10.6.2. By End-user
10.6.3. By Materials by Product
10.6.4. By Country
11. Europe Digital Dentistry Materials & Systems Market Analysis and Forecast
11.1. Introduction
11.1.1. Key Findings
11.2. Market Value Forecast, by Product, 2017–2031
11.2.1. Systems
11.2.1.1. Dental 3D Printers
11.2.1.2. CAD/CAM system
11.2.1.2.1. Chairside CAD/CAM Systems
11.2.1.2.2. Laboratory-based CAD/CAM Systems
11.2.1.3. Tooth Shade System
11.2.1.4. 2D & 3D Dental Imaging Device
11.2.1.5. Intraoral Scanners
11.2.1.6. Others
11.2.2. Materials
11.2.2.1. Metals
11.2.2.2. Ceramic
11.2.2.3. Composite Resins
11.2.2.4. Others
11.3. Market Value Forecast, by End-user, 2017–2031
11.3.1. Hospitals
11.3.2. Dental Clinic
11.3.3. Others
11.4. Market Value Forecast, by Materials by Product, 2017–2031
11.4.1. Metals
11.4.1.1. Chairside CAD/CAM Systems
11.4.1.2. Lab CAD/CAM Systems
11.4.1.3. Dental 3D Printers
11.4.2. Ceramic
11.4.2.1. Chairside CAD/CAM Systems
11.4.2.2. Lab CAD/CAM Systems
11.4.2.3. Dental 3D Printers
11.4.3. Composite Resins
11.4.3.1. Chairside CAD/CAM Systems
11.4.3.2. Lab CAD/CAM Systems
11.4.3.3. Dental 3D Printers
11.4.4. Others
11.4.4.1. Chairside CAD/CAM Systems
11.4.4.2. Lab CAD/CAM Systems
11.4.4.3. Dental 3D Printers
11.5. Market Value Forecast, by Country/Sub-Region, 2017–2031
11.5.1. Germany
11.5.2. U.K.
11.5.3. France
11.5.4. Italy
11.5.5. Spain
11.5.6. Rest of Europe
11.6. Market Attractiveness Analysis
11.6.1. By Product
11.6.2. By End-user
11.6.3. By Materials by Product
11.6.4. By Country/Sub-Region
12. Asia Pacific Digital Dentistry Materials & Systems Market Analysis and Forecast
12.1. Introduction
12.1.1. Key Findings
12.2. Market Value Forecast, by Product, 2017–2031
12.2.1. Systems
12.2.1.1. Dental 3D Printers
12.2.1.2. CAD/CAM system
12.2.1.2.1. Chairside CAD/CAM Systems
12.2.1.2.2. Laboratory-based CAD/CAM Systems
12.2.1.3. Tooth Shade System
12.2.1.4. 2D & 3D Dental Imaging Device
12.2.1.5. Intraoral Scanners
12.2.1.6. Others
12.2.2. Materials
12.2.2.1. Metals
12.2.2.2. Ceramic
12.2.2.3. Composite Resins
12.2.2.4. Others
12.3. Market Value Forecast, by End-user, 2017–2031
12.3.1. Hospitals
12.3.2. Dental Clinic
12.3.3. Others
12.4. Market Value Forecast, by Materials by Product, 2017–2031
12.4.1. Metals
12.4.1.1. Chairside CAD/CAM Systems
12.4.1.2. Lab CAD/CAM Systems
12.4.1.3. Dental 3D Printers
12.4.2. Ceramic
12.4.2.1. Chairside CAD/CAM Systems
12.4.2.2. Lab CAD/CAM Systems
12.4.2.3. Dental 3D Printers
12.4.3. Composite Resins
12.4.3.1. Chairside CAD/CAM Systems
12.4.3.2. Lab CAD/CAM Systems
12.4.3.3. Dental 3D Printers
12.4.4. Others
12.4.4.1. Chairside CAD/CAM Systems
12.4.4.2. Lab CAD/CAM Systems
12.4.4.3. Dental 3D Printers
12.5. Market Value Forecast, by Country/Sub-Region, 2017–2031
12.5.1. Japan
12.5.2. China
12.5.3. India
12.5.4. Australia & New Zealand
12.5.5. Rest of APAC
12.6. Market Attractiveness Analysis
12.6.1. By Product
12.6.2. By End-user
12.6.3. By Materials by Product
12.6.4. By Country/Sub-Region
13. Latin America Digital Dentistry Materials & Systems Market Analysis and Forecast
13.1. Introduction
13.1.1. Key Findings
13.2. Market Value Forecast, by Product, 2017–2031
13.2.1. Systems
13.2.1.1. Dental 3D Printers
13.2.1.2. CAD/CAM system
13.2.1.2.1. Chairside CAD/CAM Systems
13.2.1.2.2. Laboratory-based CAD/CAM Systems
13.2.1.3. Tooth Shade System
13.2.1.4. 2D & 3D Dental Imaging Device
13.2.1.5. Intraoral Scanners
13.2.1.6. Others
13.2.2. Materials
13.2.2.1. Metals
13.2.2.2. Ceramic
13.2.2.3. Composite Resins
13.2.2.4. Others
13.3. Market Value Forecast, by End-user, 2017–2031
13.3.1. Hospitals
13.3.2. Dental Clinic
13.3.3. Others
13.4. Market Value Forecast, by Materials by Product, 2017–2031
13.4.1. Metals
13.4.1.1. Chairside CAD/CAM Systems
13.4.1.2. Lab CAD/CAM Systems
13.4.1.3. Dental 3D Printers
13.4.2. Ceramic
13.4.2.1. Chairside CAD/CAM Systems
13.4.2.2. Lab CAD/CAM Systems
13.4.2.3. Dental 3D Printers
13.4.3. Composite Resins
13.4.3.1. Chairside CAD/CAM Systems
13.4.3.2. Lab CAD/CAM Systems
13.4.3.3. Dental 3D Printers
13.4.4. Others
13.4.4.1. Chairside CAD/CAM Systems
13.4.4.2. Lab CAD/CAM Systems
13.4.4.3. Dental 3D Printers
13.5. Market Value Forecast, by Country/Sub-Region, 2017–2031
13.5.1. Brazil
13.5.2. Mexico
13.5.3. Rest of LATAM
13.6. Market Attractiveness Analysis
13.6.1. By Product
13.6.2. By End-user
13.6.3. By Materials by Product
13.6.4. By Country/Sub-Region
14. Middle East & Africa Digital Dentistry Materials & Systems Market Analysis and Forecast
14.1. Introduction
14.1.1. Key Findings
14.2. Market Value Forecast, by Product, 2017–2031
14.2.1. Systems
14.2.1.1. Dental 3D Printers
14.2.1.2. CAD/CAM system
14.2.1.2.1. Chairside CAD/CAM Systems
14.2.1.2.2. Laboratory-based CAD/CAM Systems
14.2.1.3. Tooth Shade System
14.2.1.4. 2D & 3D Dental Imaging Device
14.2.1.5. Intraoral Scanners
14.2.1.6. Others
14.2.2. Materials
14.2.2.1. Metals
14.2.2.2. Ceramic
14.2.2.3. Composite Resins
14.2.2.4. Others
14.3. Market Value Forecast, by End-user, 2017–2031
14.3.1. Hospitals
14.3.2. Dental Clinic
14.3.3. Others
14.4. Market Value Forecast, by Materials by Product, 2017–2031
14.4.1. Metals
14.4.1.1. Chairside CAD/CAM Systems
14.4.1.2. Lab CAD/CAM Systems
14.4.1.3. Dental 3D Printers
14.4.2. Ceramic
14.4.2.1. Chairside CAD/CAM Systems
14.4.2.2. Lab CAD/CAM Systems
14.4.2.3. Dental 3D Printers
14.4.3. Composite Resins
14.4.3.1. Chairside CAD/CAM Systems
14.4.3.2. Lab CAD/CAM Systems
14.4.3.3. Dental 3D Printers
14.4.4. Others
14.4.4.1. Chairside CAD/CAM Systems
14.4.4.2. Lab CAD/CAM Systems
14.4.4.3. Dental 3D Printers
14.5. Market Value Forecast, by Country/Sub-Region, 2017–2031
14.5.1. GCC Countries
14.5.2. South Africa
14.5.3. Rest of MEA
14.6. Market Attractiveness Analysis
14.6.1. By Product
14.6.2. By End-user
14.6.3. By Materials by Product
14.6.4. By Country/Sub-Region
15. Competition Landscape
15.1. Company Profiles
15.1.1. 3D Systems, Inc.
15.1.1.1. Company Overview (HQ, Business Segments, Employee Strength)
15.1.1.2. Product Portfolio
15.1.1.3. SWOT Analysis
15.1.1.4. Strategic Overview
15.1.2. VITA North America
15.1.2.1. Company Overview (HQ, Business Segments, Employee Strength)
15.1.2.2. Product Portfolio
15.1.2.3. SWOT Analysis
15.1.2.4. Strategic Overview
15.1.3. PLANMECA OY
15.1.3.1. Company Overview (HQ, Business Segments, Employee Strength)
15.1.3.2. Product Portfolio
15.1.3.3. SWOT Analysis
15.1.3.4. Strategic Overview
15.1.4. Carestream Dental LLC.
15.1.4.1. Company Overview (HQ, Business Segments, Employee Strength)
15.1.4.2. Product Portfolio
15.1.4.3. SWOT Analysis
15.1.4.4. Strategic Overview
15.1.5. Dentsply Sirona
15.1.5.1. Company Overview (HQ, Business Segments, Employee Strength)
15.1.5.2. Product Portfolio
15.1.5.3. SWOT Analysis
15.1.5.4. Strategic Overview
15.1.6. Ivoclar Vivadent
15.1.6.1. Company Overview (HQ, Business Segments, Employee Strength)
15.1.6.2. Product Portfolio
15.1.6.3. SWOT Analysis
15.1.6.4. Strategic Overview
15.1.7. Institut Straumann AG (Straumann Group)
15.1.7.1. Company Overview (HQ, Business Segments, Employee Strength)
15.1.7.2. Product Portfolio
15.1.7.3. SWOT Analysis
15.1.7.4. Strategic Overview
15.1.8. 3M
15.1.8.1. Company Overview (HQ, Business Segments, Employee Strength)
15.1.8.2. Product Portfolio
15.1.8.3. SWOT Analysis
15.1.8.4. Strategic Overview
15.1.9. Biolase
15.1.9.1. Company Overview (HQ, Business Segments, Employee Strength)
15.1.9.2. Product Portfolio
15.1.9.3. SWOT Analysis
15.1.9.4. Strategic Overview
15.1.10. Zimmer Biomet Holdings, Inc.
15.1.10.1. Company Overview (HQ, Business Segments, Employee Strength)
15.1.10.2. Product Portfolio
15.1.10.3. SWOT Analysis
15.1.10.4. Strategic Overview
15.1.11. BEGO GmbH & Co. KG
15.1.11.1. Company Overview (HQ, Business Segments, Employee Strength)
15.1.11.2. Product Portfolio
15.1.11.3. SWOT Analysis
15.1.11.4. Strategic Overview
15.1.12. Asiga
15.1.12.1. Company Overview (HQ, Business Segments, Employee Strength)
15.1.12.2. Product Portfolio
15.1.12.3. SWOT Analysis
15.1.12.4. Strategic Overview
15.1.13. Envista Holdings Corporation
15.1.13.1. Company Overview (HQ, Business Segments, Employee Strength)
15.1.13.2. Product Portfolio
15.1.13.3. SWOT Analysis
15.1.13.4. Strategic Overview
15.1.14. Carestream Health, Inc.
15.1.14.1. Company Overview (HQ, Business Segments, Employee Strength)
15.1.14.2. Product Portfolio
15.1.14.3. SWOT Analysis
15.1.14.4. Strategic Overview
15.1.15. Formlabs, Inc.
15.1.15.1. Company Overview (HQ, Business Segments, Employee Strength)
15.1.15.2. Product Portfolio
15.1.15.3. SWOT Analysis
15.1.15.4. Strategic Overview
15.1.16. Align Technology
15.1.16.1. Company Overview (HQ, Business Segments, Employee Strength)
15.1.16.2. Product Portfolio
15.1.16.3. SWOT Analysis
15.1.16.4. Strategic Overview
15.1.17. Stratasys Ltd.
15.1.17.1. Company Overview (HQ, Business Segments, Employee Strength)
15.1.17.2. Product Portfolio
15.1.17.3. SWOT Analysis
15.1.17.4. Strategic Overview
15.1.18. vhf camfacture AG
15.1.18.1. Company Overview (HQ, Business Segments, Employee Strength)
15.1.18.2. Product Portfolio
15.1.18.3. SWOT Analysis
15.1.18.4. Strategic Overview
15.1.19. Zirkonzahn
15.1.19.1. Company Overview (HQ, Business Segments, Employee Strength)
15.1.19.2. Product Portfolio
15.1.19.3. SWOT Analysis
15.1.19.4. Strategic Overview
15.1.20. SprintRay, Inc.
15.1.20.1. Company Overview (HQ, Business Segments, Employee Strength)
15.1.20.2. Product Portfolio
15.1.20.3. SWOT Analysis
15.1.20.4. Strategic Overview
15.1.21. Roland DG Corporation
15.1.21.1. Company Overview (HQ, Business Segments, Employee Strength)
15.1.21.2. Product Portfolio
15.1.21.3. SWOT Analysis
15.1.21.4. Strategic Overview
15.1.22. imes-icore GmbH
15.1.22.1. Company Overview (HQ, Business Segments, Employee Strength)
15.1.22.2. Product Portfolio
15.1.22.3. SWOT Analysis
15.1.22.4. Strategic Overview
15.1.23. Medit Corp.
15.1.23.1. Company Overview (HQ, Business Segments, Employee Strength)
15.1.23.2. Product Portfolio
15.1.23.3. SWOT Analysis
15.1.23.4. Strategic Overview
List of Tables
Table 01: Global Digital Dentistry Materials & Systems Market Value (US$ Mn) Forecast, by Product, 2017–2031
Table 02: Global Digital Dentistry Materials & Systems Market Value (US$ Mn) Forecast, by Systems, 2017–2031
Table 03: Global Digital Dentistry Materials & Systems Market Value (US$ Mn) Forecast, by CAD/CAM system, 2017–2031
Table 04: Global Digital Dentistry Materials & Systems Market Value (US$ Mn) Forecast, by Material 2017–2031
Table 05: Global Digital Dentistry Materials & Systems Market Value (US$ Mn) Forecast, by End-user, 2017–2031
Table 06: Global Digital Dentistry Materials & Systems Market Value (US$ Mn) Forecast, Materials by Product, (Metals) 2017–2031
Table 07: Global Digital Dentistry Materials & Systems Market Value (US$ Mn) Forecast, Materials by Product, (Ceramic) 2017–2031
Table 08: Global Digital Dentistry Materials & Systems Market Value (US$ Mn) Forecast, Materials by Product, (Composite Resins) 2017–2031
Table 09: Global Digital Dentistry Materials & Systems Market Value (US$ Mn) Forecast, Materials by Product, (Others) 2017–2031
Table 10: Global Digital Dentistry Materials & Systems Market Value (US$ Mn) Forecast, by Region, 2017–2031
Table 11: North America Digital Dentistry Materials & Systems Market Value (US$ Mn) Forecast, by Country, 2017–2031
Table 12: North America Digital Dentistry Materials & Systems Market Value (US$ Mn) Forecast, by Product, 2017‒2031
Table 13: North America Digital Dentistry Materials & Systems Market Value (US$ Mn) Forecast, by Systems, 2017‒2031
Table 14: North America Digital Dentistry Materials & Systems Market Value (US$ Mn) Forecast, by CAD/CAM System, 2017‒2031
Table 15: North America Digital Dentistry Materials & Systems Market Value (US$ Mn) Forecast, by Material, 2017‒2031
Table 16: North America Digital Dentistry Materials & Systems Market Value (US$ Mn) Forecast, by Materials by Product (Metals), 2017–2031
Table 17: North America Digital Dentistry Materials & Systems Market Value (US$ Mn) Forecast, Materials by Product (Ceramic), 2017–2031
Table 18: North America Digital Dentistry Materials & Systems Market Value (US$ Mn) Forecast, Materials by Product (Composite Resins), 2017–2031
Table 19: North America Digital Dentistry Materials & Systems Market Value (US$ Mn) Forecast, Materials by Product (Others), 2017–2031
Table 20: North America Digital Dentistry Materials & Systems Market Value (US$ Mn) Forecast, by End-user, 2017–2031
Table 21: Europe Digital Dentistry Materials & Systems Market Value (US$ Mn) Forecast, by Country/Sub-Region, 2017–2031
Table 22: Europe Digital Dentistry Materials & Systems Market Value (US$ Mn) Forecast, by Product, 2017‒2031
Table 23: Europe Digital Dentistry Materials & Systems Market Value (US$ Mn) Forecast, by Systems, 2017‒2031
Table 24: Europe Digital Dentistry Materials & Systems Market Value (US$ Mn) Forecast, by CAD/CAM System 2017‒2031
Table 25: Europe Digital Dentistry Materials & Systems Market Value (US$ Mn) Forecast, by Material, 2017‒2031
Table 26: Europe Digital Dentistry Materials & Systems Market Value (US$ Mn) Forecast, Materials by Product (Metals), 2017–2031
Table 27: Europe Digital Dentistry Materials & Systems Market Value (US$ Mn) Forecast, Materials by Product (Ceramic), 2017–2031
Table 28: Europe Digital Dentistry Materials & Systems Market Value (US$ Mn) Forecast, Materials by Product (Composite Resins), 2017–2031
Table 29: Europe Digital Dentistry Materials & Systems Market Value (US$ Mn) Forecast, Materials by Product (Others), 2017–2031
Table 30: Europe Digital Dentistry Materials & Systems Market Value (US$ Mn) Forecast, by End-user, 2017–2031
Table 31: Asia Pacific Digital Dentistry Materials & Systems Market Value (US$ Mn) Forecast, by Country/Sub-Region, 2017–2031
Table 32: Asia Pacific Digital Dentistry Materials & Systems Market Value (US$ Mn) Forecast, by Product, 2017‒2031
Table 33: Asia Pacific Digital Dentistry Materials & Systems Market Value (US$ Mn) Forecast, by Systems, 2017‒2031
Table 34: Asia Pacific Digital Dentistry Materials & Systems Market Value (US$ Mn) Forecast, by CAD/CAM system, 2017‒2031
Table 35: Asia Pacific Digital Dentistry Materials & Systems Market Value (US$ Mn) Forecast, by Material, 2017‒2031
Table 36: Asia Pacific Digital Dentistry Materials & Systems Market Value (US$ Mn) Forecast, Materials by Product (Metals), 2017–2031
Table 37: Asia Pacific Digital Dentistry Materials & Systems Market Value (US$ Mn) Forecast, Materials by Product (Ceramic), 2017–2031
Table 38: Asia Pacific Digital Dentistry Materials & Systems Market Value (US$ Mn) Forecast, Materials by Product (Composite Resins), 2017–2031
Table 39: Asia Pacific Digital Dentistry Materials & Systems Market Value (US$ Mn) Forecast, Materials by Product (Others), 2017–2031
Table 40: Asia Pacific Digital Dentistry Materials & Systems Market Value (US$ Mn) Forecast, by End-user, 2017–2031
Table 41: Latin America Digital Dentistry Materials & Systems Market Value (US$ Mn) Forecast, by Country/Sub-Region, 2017–2031
Table 42: Latin America Digital Dentistry Materials & Systems Market Value (US$ Mn) Forecast, by Product, 2017‒2031
Table 43: Latin America Digital Dentistry Materials & Systems Market Value (US$ Mn) Forecast, by Systems, 2017‒2031
Table 44: Latin America Digital Dentistry Materials & Systems Market Value (US$ Mn) Forecast, by CAD/CAM system, 2017‒2031
Table 45: Latin America Digital Dentistry Materials & Systems Market Value (US$ Mn) Forecast, by Material, 2017‒2031
Table 46: Latin America Digital Dentistry Materials & Systems Market Value (US$ Mn) Forecast, Materials by Product (Metals), 2017–2031
Table 47: Latin America Digital Dentistry Materials & Systems Market Value (US$ Mn) Forecast, Materials by Product (Ceramic), 2017–2031
Table 48: Latin America Digital Dentistry Materials & Systems Market Value (US$ Mn) Forecast, Materials by Product (Composite Resins), 2017–2031
Table 49: Latin America Digital Dentistry Materials & Systems Market Value (US$ Mn) Forecast, Materials by Product (Others), 2017–2031
Table 50: Latin America Digital Dentistry Materials & Systems Market Value (US$ Mn) Forecast, by End-user, 2017–2031
Table 51: Middle East & Africa Digital Dentistry Materials & Systems Market Value (US$ Mn) Forecast, by Country/Sub-Region, 2017–2031
Table 52: Middle East & Africa Digital Dentistry Materials & Systems Market Value (US$ Mn) Forecast, by Product, 2017‒2031
Table 53: Middle East & Africa Digital Dentistry Materials & Systems Market Value (US$ Mn) Forecast, by Systems, 2017‒2031
Table 54: Middle East & Africa Digital Dentistry Materials & Systems Market Value (US$ Mn) Forecast, by CAD/CAM system, 2017‒2031
Table 55: Middle East & Africa Digital Dentistry Materials & Systems Market Value (US$ Mn) Forecast, by Material, 2017‒2031
Table 56: Middle East & Africa Digital Dentistry Materials & Systems Market Value (US$ Mn) Forecast, by Materials by Product (Metals), 2017–2031
Table 57: Middle East & Africa Digital Dentistry Materials & Systems Market Value (US$ Mn) Forecast, by Materials by Product (Ceramic), 2017–2031
Table 58: Middle East & Africa Digital Dentistry Materials & Systems Market Value (US$ Mn) Forecast, by Materials by Product (Composite Resins), 2017–2031
Table 59: Middle East & Africa Digital Dentistry Materials & Systems Market Value (US$ Mn) Forecast, by Materials by Product (Others), 2017–2031
Table 60: Middle East & Africa Digital Dentistry Materials & Systems Market Value (US$ Mn) Forecast, by End-user, 2017–2031
List of Figures
Figure 01: Global Digital Dentistry Materials & Systems Market Value (US$ Mn) Forecast, 2017–2031
Figure 02: Global Digital Dentistry Materials & Systems Market Value Share, by Product, 2020
Figure 03: Global Digital Dentistry Materials & Systems Market Value Share, by End-user, 2020
Figure 04: Global Digital Dentistry Materials & Systems Market Value Share, by Region, 2020
Figure 05: Global Digital Dentistry Materials & Systems Market Value Share Analysis, by Product, 2020 and 2031
Figure 06: Global Digital Dentistry Materials & Systems Market Attractiveness Analysis, by Product, 2021–2031
Figure 07: Global Digital Dentistry Materials & Systems Market Value (US$ Mn), by Systems, 2017–2031
Figure 08: Global Digital Dentistry Materials & Systems Market Value (US$ Mn), by Material, 2017–2031
Figure 09: Global Digital Dentistry Materials & Systems Market Value Share Analysis, by End-user, 2020 and 2031
Figure 10: Global Digital Dentistry Materials & Systems Market Attractiveness Analysis, by End-user, 2021–2031
Figure 11: Global Digital Dentistry Materials & Systems Market Value (US$ Mn), by Hospitals, 2017–2031
Figure 12: Global Digital Dentistry Materials & Systems Market Value (US$ Mn), by Dental Clinics, 2017–2031
Figure 13: Global Digital Dentistry Materials & Systems Market Value (US$ Mn), by Others, 2017–2031
Figure 14: Global Digital Dentistry Materials & Systems Market Attractiveness Analysis, Materials by Product, (Metals) 2021–2031
Figure 15: Global Digital Dentistry Materials & Systems Market Value Share Analysis, Materials by Product, (Metals) 2020 and 2031
Figure 16: Global Digital Dentistry Materials & Systems Market Attractiveness Analysis, Materials by Product, (Ceramic) 2021–2031
Figure 17: Global Digital Dentistry Materials & Systems Market Value Share Analysis, Materials by Product, (Ceramic) 2020 and 2031
Figure 18: Global Digital Dentistry Materials & Systems Market Attractiveness Analysis, Materials by Product, (Composite Resins) 2021–2031
Figure 19: Global Digital Dentistry Materials & Systems Market Value Share Analysis, Materials by Product, (Composite Resins) 2020 and 2031
Figure 20: Global Digital Dentistry Materials & Systems Market Attractiveness Analysis, Materials by Product, (Others) 2021–2031
Figure 21: Global Digital Dentistry Materials & Systems Market Value Share Analysis, Materials by Product, (Others) 2020 and 2031
Figure 22: Global Digital Dentistry Materials & Systems Market Value Share Analysis, by Region, 2020 and 2031
Figure 23: Global Digital Dentistry Materials & Systems Market Attractiveness Analysis, by Region, 2021–2031
Figure 24: North America Digital Dentistry Materials & Systems Market Value (US$ Mn) Forecast, 2017–2031
Figure 25: North America Digital Dentistry Materials & Systems Market Attractiveness Analysis, by Country, 2021–2031
Figure 26: North America Digital Dentistry Materials & Systems Market Value Share Analysis, by Country, 2020 and 2031
Figure 27: North America Digital Dentistry Materials & Systems Market Attractiveness Analysis, by Product, 2021–2031
Figure 28: North America Digital Dentistry Materials & Systems Market Value Share Analysis, by Product, 2020 and 2031
Figure 29: North America Digital Dentistry Materials & Systems Market Attractiveness Analysis, by Materials by Product, (Metals) 2021–2031
Figure 30: North America Digital Dentistry Materials & Systems Market Value Share Analysis, Materials by Product, (Metals), 2020 and 2031
Figure 31: North America Digital Dentistry Materials & Systems Market Attractiveness Analysis, Materials by Product, (Ceramic) 2021–2031
Figure 32: North America Digital Dentistry Materials & Systems Market Value Share Analysis, Materials by Product, (Ceramic) 2020 and 2031
Figure 33: North America Digital Dentistry Materials & Systems Market Attractiveness Analysis, by Materials by Product, (Composite Resins) 2021–2031
Figure 34: North America Digital Dentistry Materials & Systems Market Value Share Analysis, by Materials by Product, (Composite Resins) 2020 and 2031
Figure 35: North America Digital Dentistry Materials & Systems Market Attractiveness Analysis, by Materials by Product, (Others) 2021–2031
Figure 36: North America Digital Dentistry Materials & Systems Market Value Share Analysis, by Materials by Product, (Others) 2020 and 2031
Figure 37: North America Digital Dentistry Materials & Systems Market Attractiveness Analysis, by End-user, 2021–2031
Figure 38: North America Digital Dentistry Materials & Systems Market Value Share Analysis, by End-user, 2020 and 2031
Figure 39: Europe Digital Dentistry Materials & Systems Market Value (US$ Mn) Forecast, 2017–2031
Figure 40: Europe Digital Dentistry Materials & Systems Market Attractiveness Analysis, by Country/Sub-Region, 2021–2031
Figure 41: Europe Digital Dentistry Materials & Systems Market Value Share Analysis, by Country/Sub-Region, 2020 and 2031
Figure 42: Europe Digital Dentistry Materials & Systems Market Attractiveness Analysis, by Product, 2021–2031
Figure 43: Europe Digital Dentistry Materials & Systems Market Value Share Analysis, by Product, 2020 and 2031
Figure 44: Europe Digital Dentistry Materials & Systems Market Attractiveness Analysis, Materials by Product, (Metals) 2021–2031
Figure 45: Europe Digital Dentistry Materials & Systems Market Value Share Analysis, Materials by Product, (Metals) 2020 and 2031
Figure 46: Europe Digital Dentistry Materials & Systems Market Attractiveness Analysis, Materials by Product, (Ceramic) 2021–2031
Figure 47: Europe Digital Dentistry Materials & Systems Market Value Share Analysis, Materials by Product, (Ceramic) 2020 and 2031
Figure 48: Europe Digital Dentistry Materials & Systems Market Attractiveness Analysis, Materials by Product, (Composite Resins) 2021–2031
Figure 49: Europe Digital Dentistry Materials & Systems Market Value Share Analysis, Materials by Product, (Composite Resins) 2020 and 2031
Figure 50: Europe Digital Dentistry Materials & Systems Market Attractiveness Analysis, Materials by Product, (Others) 2021–2031
Figure 51: Europe Digital Dentistry Materials & Systems Market Value Share Analysis, Materials by Product, (Others) 2020 and 2031
Figure 52: Europe Digital Dentistry Materials & Systems Market Attractiveness Analysis, by End-user, 2021–2031
Figure 53: Europe Digital Dentistry Materials & Systems Market Value Share Analysis, by End-user, 2020 and 2031
Figure 54: Asia Pacific Digital Dentistry Materials & Systems Market Value (US$ Mn) Forecast, 2017–2031
Figure 55: Asia Pacific Digital Dentistry Materials & Systems Market Attractiveness Analysis, by Country/Sub-Region, 2021–2031
Figure 56: Asia Pacific Digital Dentistry Materials & Systems Market Value Share Analysis, by Country/Sub-Region, 2020 and 2031
Figure 57: Asia Pacific Digital Dentistry Materials & Systems Market Attractiveness Analysis, by Product, 2021–2031
Figure 58: Asia Pacific Digital Dentistry Materials & Systems Market Value Share Analysis, by Product, 2020 and 2031
Figure 59: Asia Pacific Digital Dentistry Materials & Systems Market Attractiveness Analysis, Materials by Product, (Metals) 2021–2031
Figure 60: Asia Pacific Digital Dentistry Materials & Systems Market Value Share Analysis, Materials by Product, (Metals) 2020 and 2031
Figure 61: Asia Pacific Digital Dentistry Materials & Systems Market Attractiveness Analysis, Materials by Product, (Ceramic) 2021–2031
Figure 62: Asia Pacific Digital Dentistry Materials & Systems Market Value Share Analysis, Materials by Product, (Ceramic) 2020 and 2031
Figure 63: Asia Pacific Digital Dentistry Materials & Systems Market Attractiveness Analysis, Materials by Product, (Composite Resins) 2021–2031
Figure 64: Asia Pacific Digital Dentistry Materials & Systems Market Value Share Analysis, Materials by Product, (Composite Resins) 2020 and 2031
Figure 65: Asia Pacific Digital Dentistry Materials & Systems Market Attractiveness Analysis, Materials by Product, (Others) 2021–2031
Figure 66: Asia Pacific Digital Dentistry Materials & Systems Market Value Share Analysis, Materials by Product, (Others) 2020 and 2031
Figure 67: Asia Pacific Digital Dentistry Materials & Systems Market Attractiveness Analysis, by End-user, 2021–2031
Figure 68: Asia Pacific Digital Dentistry Materials & Systems Market Value Share Analysis, by End-user, 2020 and 2031
Figure 69: Latin America Digital Dentistry Materials & Systems Market Value (US$ Mn) Forecast, 2017–2031
Figure 70: Latin America Digital Dentistry Materials & Systems Market Attractiveness Analysis, by Country/Sub-Region, 2021–2031
Figure 71: Latin America Digital Dentistry Materials & Systems Market Value Share Analysis, by Country/Sub-Region, 2020 and 2031
Figure 72: Latin America Digital Dentistry Materials & Systems Market Attractiveness Analysis, by Product, 2021–2031
Figure 73: Latin America Digital Dentistry Materials & Systems Market Value Share Analysis, by Product, 2020 and 2031
Figure 74: Latin America Digital Dentistry Materials & Systems Market Attractiveness Analysis, Materials by Product, (Metals) 2021–2031
Figure 75: Latin America Digital Dentistry Materials & Systems Market Value Share Analysis, Materials by Product, (Metals) 2020 and 2031
Figure 76: Latin America Digital Dentistry Materials & Systems Market Attractiveness Analysis, Materials by Product, (Ceramic) 2021–2031
Figure 77: Latin America Digital Dentistry Materials & Systems Market Value Share Analysis, Materials by Product, (Ceramic) 2020 and 2031
Figure 78: Latin America Digital Dentistry Materials & Systems Market Attractiveness Analysis, Materials by Product, (Composite Resins) 2021–2031
Figure 79: Latin America Digital Dentistry Materials & Systems Market Value Share Analysis, Materials by Product, (Composite Resins) 2020 and 2031
Figure 80: Latin America Digital Dentistry Materials & Systems Market Attractiveness Analysis, Materials by Product, (Others) 2021–2031
Figure 81: Latin America Digital Dentistry Materials & Systems Market Value Share Analysis, Materials by Product, (Others) 2020 and 2031
Figure 82: Latin America Digital Dentistry Materials & Systems Market Attractiveness Analysis, by End-user, 2021–2031
Figure 83: Latin America Digital Dentistry Materials & Systems Market Value Share Analysis, by End-user, 2020 and 2031
Figure 84: Middle East & Africa Digital Dentistry Materials & Systems Market Value (US$ Mn) Forecast, 2017–2031
Figure 85: Middle East & Africa Digital Dentistry Materials & Systems Market Attractiveness Analysis, by Country/Sub-Region, 2021–2031
Figure 86: Middle East & Africa Digital Dentistry Materials & Systems Market Value Share Analysis, by Country/Sub-Region, 2020 and 2031
Figure 87: Middle East & Africa Digital Dentistry Materials & Systems Market Attractiveness Analysis, by Product, 2021–2031
Figure 88: Middle East & Africa Digital Dentistry Materials & Systems Market Value Share Analysis, by Product, 2020 and 2031
Figure 89: Middle East & Africa Digital Dentistry Materials & Systems Market Attractiveness Analysis, by Materials by Product, (Metals) 2021–2031
Figure 90: Middle East & Africa Digital Dentistry Materials & Systems Market Value Share Analysis, by Materials by Product, (Metals) 2020 and 2031
Figure 91: Middle East & Africa Digital Dentistry Materials & Systems Market Attractiveness Analysis, by Materials by Product, (Ceramic) 2021–2031
Figure 92: Middle East & Africa Digital Dentistry Materials & Systems Market Value Share Analysis, by Materials by Product, (Ceramic) 2020 and 2031
Figure 93: Middle East & Africa Digital Dentistry Materials & Systems Market Attractiveness Analysis, by Materials by Product, (Composite Resins) 2021–2031
Figure 94: Middle East & Africa Digital Dentistry Materials & Systems Market Value Share Analysis, by Materials by Product, (Composite Resins) 2020 and 2031
Figure 95: Middle East & Africa Digital Dentistry Materials & Systems Market Attractiveness Analysis, by Materials by Product, (Others) 2021–2031
Figure 96: Middle East & Africa Digital Dentistry Materials & Systems Market Value Share Analysis, by Materials by Product, (Others) 2020 and 2031
Figure 97: Middle East & Africa Digital Dentistry Materials & Systems Market Attractiveness Analysis, by End-user, 2021–2031
Figure 98: Middle East & Africa Digital Dentistry Materials & Systems Market Value Share Analysis, by End-user, 2020 and 2031
Copyright © Transparency Market Research, Inc. All Rights reserved
Trust Online

Digital Dentistry Materials & Systems Market
