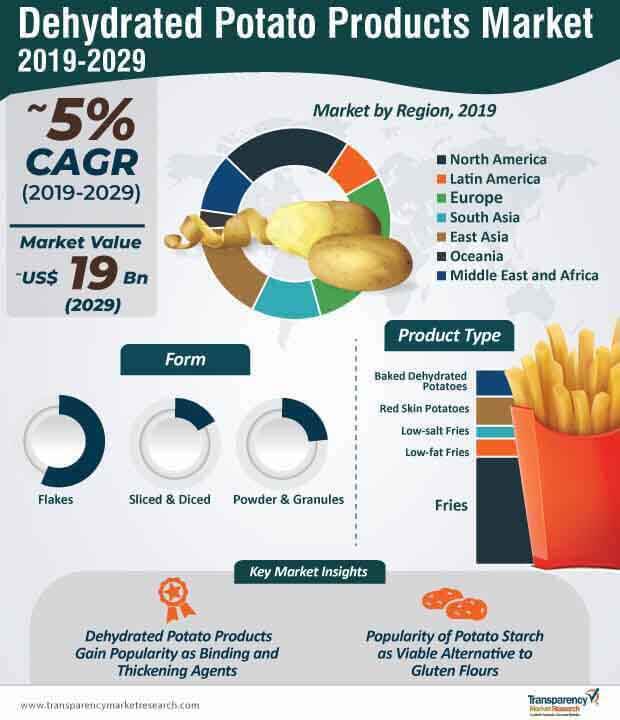
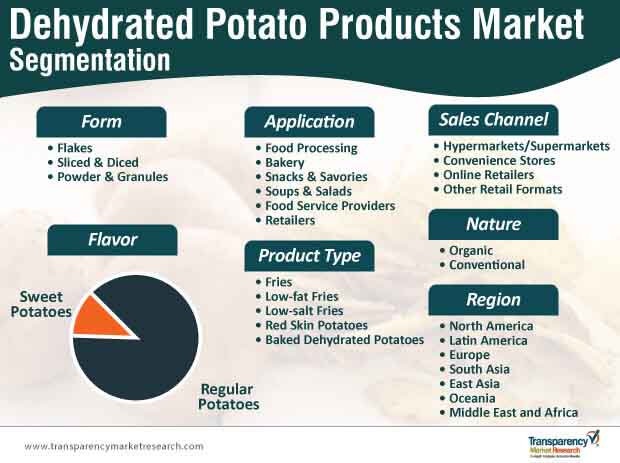
The process of dehydration and grinding of starchy root vegetables has been widely attested around the world, mainly due to convenience and portability. Dehydrated potatoes, in particular, find application in a variety of end uses, making them a highly versatile product. By form, dehydrated potatoes are available as flakes, sliced and diced pieces, and powder and granules, which have varied, distinct applications in food processing and preparation. Dehydrated potatoes are gaining popularity as a food additive due to their thickening and binding properties. Dehydrated potato products are also gaining popularity in recent years as a food additive, as they add nutritional value to various foods. The functional and nutritional properties of dehydrated potatoes, coupled with the convenience factor, has led to their rapid adoption, leading to a positive impact on the growth of the global dehydrated potato products market.
Of the several forms in which dehydrated potato products are available, potato flakes are the most popular, and accounted for over half of the total dehydrated potato products market in 2018. The segment is anticipated to expand at a moderate CAGR of ~4% by value over the forecast period, and will continue to retain its place at the top of the table. However, quickly gaining traction are sliced & diced dehydrated potato products, which accounted for around one-fifth of the market share in 2018, and this is expected to increase to ~25% of the total share by revenue by the end of the forecast period.
Organic food – a megatrend that is shaping the F&B industry has a whole, has had a significant impact on the global dehydrated potato products market as well. With organic foods and ingredients becoming increasingly popular, organic dehydrated potato products have gathered interest in recent years. They accounted for one-tenth of the total market share in 2018, witnessing sales of ~131 thousand tons. By the end of the forecast period, the sales of organic dehydrated potato products are expected to hit the ~200 thousand ton mark, increasing at a CAGR of ~4%.
However, conventional dehydrated potato products, which accounted for a lion’s share of the total market share by value and volume in 2018, are expected to continue to remain popular during the forecast period. By revenue, this type is likely to expand at a faster pace of 4.5%, and reach the ~US$ 15 Mn threshold by the end of 2029.
In 2018, Europe held the most significant share of the global dehydrated potato products market, accounting for close to one-third of the total revenue share. Even as the market in this region expands at a slow CAGR of ~4% by value, it is expected to retain its place at the top in 2029. This can be attributed to the presence of a significant number of producers and manufacturers in the region. North America, which also occupies a prominent share in the global market, witnessed sales of ~2.4 Mn tons in 2018, and the market is expected grow 1.5 times by the end of the forecast period. The rising demand for dehydrated potato products in the region can be attributed to the presence of larger, well-established players and smaller producers, coupled with rising awareness about organic products and consumer demand for the same.
However, expanding the fastest at a value CAGR of ~8%, the market in Oceania is emerging to offer a plethora of opportunities for manufacturers in the global dehydrated potato products market. This increased demand comes from the growing consumption of packaged and processed foods in the region, in the production of which, dehydrated potato products are extensively used.
Analysts’ Overview of Dehydrated Potato Products Market
The dehydrated potato products market, which is estimated to be valued at ~US$ 12 Mn in 2019, is expected to expand at a moderate CAGR of 5% during the forecast period of 2019-2029. According to analysts at Transparency Market Research, this can be attributed to changing food consumption patterns around the world, as the demand for processed and pre-packaged foods gains traction. Manufacturers in this market, focusing on improving product quality for application in food processing, bakery products, soups and salads, and more, are likely to experience the most gains over the forecast period.
The regional markets of Europe and North America are likely to remain significant in the foreseeable future, while that of Oceania is set to expand rapidly, as urbanization continues to influence the food choices of consumers. Manufacturers looking to exploit this trend and expand into these regions are likely to benefit from lucrative opportunities, even as they strengthen their geographical presence.
Dehydrated Potato Products Market: Overview
Dehydrated Potato Products Market: Global Demand for Gluten-free Products to Shape Growth
Dehydrated Potato Products Market: Diverse Applications Ensure Continued Demand for Dehydrated Potatoes
Dehydrated Potato Products Market: Growing Preference for Dehydrated Potato Products Due to Long Shelf Life
Dehydrated Potato Products Market: Demand for Ethical and Sustainable Products
Dehydrated Potato Products Market: Competitive Landscape
Dehydrated Potato Products Market: Key Developments
1. Executive Summary
1.1. Global Market Outlook
1.2. Demand Side Trends
1.3. Supply Side Trends
1.4. Technology Roadmap
1.5. Analysis and Recommendations
2. Market Overview
2.1. Market Coverage / Taxonomy
2.2. Market Definition / Scope / Limitations
3. Key Market Trends
3.1. Key Trends Impacting the Market
3.1.1. Marketers Reach Out to Millennial
3.1.2. Rising preference for additional attributes such as gluten free, sugar free etc.
3.1.3. Heightened M&A Activity
3.1.4. Shortened Product Launch Frequency
3.2. Product Innovation / Development Trends
3.2.1. Transformed Packaging to Suit Customer Orientation
3.2.2. Brand Differentiation through Packaging
3.2.3. Shift Toward Natural Ingredients
4. Associated Industry Assessment
4.1. Enlightened Eating - Indulging Smarter
4.1.1. Gluten Free – An Overview
4.1.1.1. Gluten Free – Market Trends
4.1.1.2. Grain Free: The new Gluten Free?
4.1.1.3. Claims Displayed on Gluten-Free Food Product Launches
4.1.2. Lactose Free – An Overview
4.1.2.1. Lactose Free: the Market
4.1.2.2. Claims Displayed on Lactose-Free Food Product Launches
4.1.3. Sugar Free – An Overview
4.2. Demand (%) Assessment by Claims, 2019 & 2029
4.2.1. Gluten-Free
4.2.2. Low Fat
4.2.3. Cholesterol-Free
4.2.4. Fat-Free
4.2.5. Kosher
4.2.6. Natural
4.2.7. Trans Fat-Free
4.2.8. Sugar-Free
5. Market Background
5.1. Regulatory Framework
5.1.1. Key Identified Regulations
5.1.2. Guidelines on Food Safety & Labelling
5.2. Macro-Economic Factors
5.2.1. Global GDP Growth Outlook
5.2.2. Global Food Industry Outlook
5.2.3. Rise in Consumption of Food Items across Globe
5.2.4. Global and Regional Per Capita Food Consumption (Kcal per capita per day)
5.2.5. Population Growth by Key Countries
5.2.6. Per Capita Plant-Based Protein Consumption
5.2.7. Dairy Health Impacts
5.2.8. Global Modern Trade Penetration and Grocery Market by Key Countries
5.2.9. Change in Consumer Price Indexes (Percentage Change) 2018 (Forecast)
5.2.10. Penetration of e commerce in F & B sector
5.2.11. Rise in Disposable Income
5.2.12. Others
5.3. Forecast Factors - Relevance & Impact
5.3.1. Adoption of public and private Safety Standards by manufactures
5.3.2. Transparency – the embracing trend
5.3.3. Foodborne Illness
5.3.4. Label Claims
5.3.5. Balance of Trade
5.3.6. Rising demand for safe and quality food products among consumers
5.3.7. Demand for ethical and sustainable products
5.3.8. Local Food Movement
5.3.9. Top 10 Players Historical Growth Rate
5.3.10. Continuous Consolidations
5.3.11. Others
5.4. Value Chain
5.4.1. Profitability and Gross Margin Analysis By Competition
5.4.2. List of Active Participants
5.4.3. Raw Material Suppliers
5.4.4. Key Manufacturers
5.4.5. Key Distributor/Retailers
5.5. Market Dynamics
5.5.1. Drivers
5.5.2. Restraints
5.5.3. Opportunity Analysis
5.6. Consumer Sentimental Analysis
5.6.1. Factors influencing target market behaviour
5.6.2. Which specific brand is preferred by the consumers and why?
5.6.3. How consumers perceive the existing target market brands in terms of value for money and how important is brand for a customer?
5.6.4. Which factor would consumers like to change among the currently available target market products
5.6.5. Are consumers ready to pay premium price for target market product type?
5.6.6. Does social media influence customer’s decision making?
5.6.7. Which mode of advertisement does vendors prefer?
5.6.8. Which of the social media platforms does companies prefers for branding?
5.6.9. What are the key challenges associated with the target market suppliers?
5.6.10. Others
5.7. Social Media Sentimental Analysis
5.7.1. Consumer perception for products on social media platforms- Positive and Negative Mentions
5.7.2. Trending Brands
5.7.3. Social Media Platform Mentions (% of total mentions)
5.7.4. Region-wise Social Media Mentions (% total mentions)
5.7.5. Overall Sentiment on Social Media Platforms- By End Use Applications
5.7.6. Others
6. Global Dehydrated Potato Products Market Demand Analysis 2014 – 2018 and Forecast, 2019 – 2029
6.1. Historical Market Volume (MT) Analysis, 2014 – 2018
6.2. Current and Future Market Volume (MT) Projections, 2019 – 2029
6.3. Y-o-Y Growth Trend Analysis
7. Global Dehydrated Potato Products Market - Pricing Analysis
7.1. Regional Pricing Analysis By Product Type
7.2. Pricing Break-up
7.2.1. Manufacturer Level Pricing
7.2.2. Distributor Level Pricing
7.3. Global Average Pricing Analysis Benchmark
8. Global Dehydrated Potato Products Market Demand (US$ Mn) Analysis 2014 – 2018 and Forecast, 2019 – 2029
8.1. Historical Market Value (US$ Mn) Analysis, 2014 – 2018
8.2. Current and Future Market Value (US$ Mn) Projections, 2019 – 2029
8.2.1. Y-o-Y Growth Trend Analysis
8.2.2. Absolute $ Opportunity Analysis
9. Global Dehydrated Potato Products Market Analysis 2014 – 2018 and Forecast 2019 – 2029, By Form
9.1. Introduction / Key Findings
9.2. Historical Market Size (US$ Mn) and Volume Analysis By Form, 2014 – 2018
9.3. Current and Future Market Size (US$ Mn) and Volume Analysis and Forecast By Form, 2019 – 2029
9.4. Flake
9.5. Sliced & Diced
9.6. Powder & Granule
9.7. Market Attractiveness Analysis By Form
10. Global Dehydrated Potato Products Market Analysis 2014 – 2018 and Forecast 2019 – 2029, By Product Type
10.1. Introduction / Key Findings
10.2. Historical Market Size (US$ Mn) and Volume Analysis By Product Type, 2014 – 2018
10.3. Current and Future Market Size (US$ Mn) and Volume Analysis and Forecast By Product Type, 2019 – 2029
10.3.1. Fries
10.3.2. Low-Fat Fries
10.3.3. Low-Salt Fries
10.3.4. Red Skin Potato
10.3.5. Baked Dehydrated Potato
10.4. Market Attractiveness Analysis By Product Type
11. Global Dehydrated Potato Products Market Analysis 2014 – 2018 and Forecast 2019 – 2029, By Nature
11.1. Introduction / Key Findings
11.2. Historical Market Size (US$ Mn) and Volume Analysis By Nature, 2014 – 2018
11.3. Current and Future Market Size (US$ Mn) and Volume Analysis and Forecast By Nature, 2019 – 2029
11.3.1. Organic
11.3.2. Conventional
11.4. Market Attractiveness Analysis By Nature
12. Global Dehydrated Potato Products Market Analysis 2014 – 2018 and Forecast 2019 – 2029, By Application
12.1. Introduction / Key Findings
12.2. Historical Market Size (US$ Mn) and Volume Analysis By Application, 2014 – 2018
12.3. Current and Future Market Size (US$ Mn) and Volume Analysis and Forecast By Application, 2019 – 2029
12.3.1. Food Processing
12.3.2. Bakery
12.3.3. Snacks & Savory
12.3.4. Food Service Provider
12.3.5. Retail
12.4. Market Attractiveness Analysis By Application
13. Global Dehydrated Potato Products Market Analysis 2014 – 2018 and Forecast 2019 – 2029, By Sales Channel
13.1. Introduction / Key Findings
13.2. Historical Market Size (US$ Mn) and Volume Analysis By Sales Channel, 2014 – 2018
13.3. Current and Future Market Size (US$ Mn) and Volume Analysis and Forecast By Sales Channel, 2019 – 2029
13.3.1.1. Hypermarket/Supermarket
13.3.1.2. Convenience Store
13.3.1.3. Online Retailer
13.3.1.4. Other Retail Format
13.4. Market Attractiveness Analysis By Sales Channel
14. Global Dehydrated Potato Products Market Analysis 2014 – 2018 and Forecast 2019 – 2029, By Flavor
14.1. Introduction / Key Findings
14.2. Historical Market Size (US$ Mn) and Volume Analysis By Flavor, 2014 – 2018
14.3. Current and Future Market Size (US$ Mn) and Volume Analysis and Forecast By Flavor, 2019 – 2029
14.3.1. Regular
14.3.2. Sweet Potato
14.4. Market Attractiveness Analysis By Flavor
15. Global Dehydrated Potato Products Market Analysis 2014 – 2018 and Forecast 2019 – 2029, by Region
15.1. Introduction
15.2. Historical Market Size (US$ Mn) and Volume Analysis By Region, 2014 – 2018
15.3. Current Market Size (US$ Mn) and Volume Analysis and Forecast By Region, 2019 – 2029
15.3.1. North America
15.3.2. Latin America
15.3.3. Europe
15.3.4. South Asia
15.3.5. East Asia
15.3.6. Oceania
15.3.7. Middle East & Africa
15.4. Market Attractiveness Analysis By Region
16. North America Dehydrated Potato Products Market Analysis 2014 – 2018 and Forecast 2019 – 2029
16.1. Introduction
16.2. Pricing Analysis
16.3. Historical Market Size (US$ Mn) and Volume Trend Analysis By Market Taxonomy, 2014 – 2018
16.4. Market Size (US$ Mn) and Volume Forecast By Market Taxonomy, 2019 – 2029
16.4.1. By Country
16.4.1.1. U.S.
16.4.1.2. Canada
16.4.2. By Form
16.4.3. By Application
16.4.4. By Sales Channels
16.4.5. By Product Type
16.4.6. By Flavor
16.4.7. By Nature
16.5. Market Attractiveness Analysis
16.5.1. By Country
16.5.2. By Form
16.5.3. By Application
16.5.4. By Sales Channels
16.5.5. By Product Type
16.5.6. By Flavor
16.5.7. By Nature
16.6. Market Trends
16.7. Key Market Participants - Intensity Mapping
16.8. Drivers and Restraints - Impact Analysis
17. Latin America Dehydrated Potato Products Market Analysis 2014 – 2018 and Forecast 2019 – 2029
17.1. Introduction
17.2. Pricing Analysis
17.3. Historical Market Size (US$ Mn) and Volume Trend Analysis By Market Taxonomy, 2014 – 2018
17.4. Market Size (US$ Mn) and Volume Forecast By Market Taxonomy, 2019 – 2029
17.4.1. By Country
17.4.1.1. Brazil
17.4.1.2. Mexico
17.4.1.3. Rest of Latin America
17.4.2. By Form
17.4.3. By Application
17.4.4. By Sales Channels
17.4.5. By Product Type
17.4.6. By Flavor
17.4.7. By Nature
17.5. Market Attractiveness Analysis
17.5.1. By Country
17.5.2. By Form
17.5.3. By Application
17.5.4. By Sales Channels
17.5.5. By Product Type
17.5.6. By Flavor
17.5.7. By Nature
17.6. Market Trends
17.7. Key Market Participants - Intensity Mapping
17.8. Drivers and Restraints - Impact Analysis
18. Europe Dehydrated Potato Products Market Analysis 2014 – 2018 and Forecast 2019 – 2029
18.1. Introduction
18.2. Pricing Analysis
18.3. Historical Market Size (US$ Mn) and Volume Trend Analysis By Market Taxonomy, 2014 – 2018
18.4. Market Size (US$ Mn) and Volume Forecast By Market Taxonomy, 2019 – 2029
18.4.1. By Country
18.4.1.1. Germany
18.4.1.2. Italy
18.4.1.3. France
18.4.1.4. U.K.
18.4.1.5. Spain
18.4.1.6. BENELUX
18.4.1.7. Russia
18.4.1.8. Rest of Europe
18.4.2. By Form
18.4.3. By Application
18.4.4. By Sales Channels
18.4.5. By Product Type
18.4.6. By Flavor
18.4.7. By Nature
18.5. Market Attractiveness Analysis
18.5.1. By Country
18.5.2. By Form
18.5.3. By Application
18.5.4. By Sales Channels
18.5.5. By Product Type
18.5.6. By Flavor
18.5.7. By Nature
18.6. Market Trends
18.7. Key Market Participants - Intensity Mapping
18.8. Drivers and Restraints - Impact Analysis
19. South Asia Dehydrated Potato Products Market Analysis 2014 – 2018 and Forecast 2019 – 2029
19.1. Introduction
19.2. Pricing Analysis
19.3. Historical Market Size (US$ Mn) and Volume Trend Analysis By Market Taxonomy, 2014 – 2018
19.4. Market Size (US$ Mn) and Volume Forecast By Market Taxonomy, 2019 – 2029
19.4.1. By Country
19.4.1.1. India
19.4.1.2. Thailand
19.4.1.3. Indonesia
19.4.1.4. Malaysia
19.4.1.5. Rest of South Asia
19.4.2. By Form
19.4.3. By Application
19.4.4. By Sales Channels
19.4.5. By Product Type
19.4.6. By Flavor
19.4.7. By Nature
19.5. Market Attractiveness Analysis
19.5.1. By Country
19.5.2. By Form
19.5.3. By Application
19.5.4. By Sales Channels
19.5.5. By Product Type
19.5.6. By Flavor
19.5.7. By Nature
19.6. Market Trends
19.7. Key Market Participants - Intensity Mapping
19.8. Drivers and Restraints - Impact Analysis
20. East Asia Dehydrated Potato Products Market Analysis 2014 – 2018 and Forecast 2019 – 2029
20.1. Introduction
20.2. Pricing Analysis
20.3. Historical Market Size (US$ Mn) and Volume Trend Analysis By Market Taxonomy, 2014 – 2018
20.4. Market Size (US$ Mn) and Volume Forecast By Market Taxonomy, 2019 – 2029
20.4.1. By Country
20.4.1.1. China
20.4.1.2. Japan
20.4.1.3. South Korea
20.4.2. By Form
20.4.3. By Application
20.4.4. By Sales Channels
20.4.5. By Product Type
20.4.6. By Flavor
20.4.7. By Nature
20.5. Market Attractiveness Analysis
20.5.1. By Country
20.5.2. By Form
20.5.3. By Application
20.5.4. By Sales Channels
20.5.5. By Product Type
20.5.6. By Flavor
20.5.7. By Nature
20.6. Market Trends
20.7. Key Market Participants - Intensity Mapping
20.8. Drivers and Restraints - Impact Analysis
21. Oceania Dehydrated Potato Products Market Analysis 2014 – 2018 and Forecast 2019 – 2029
21.1. Introduction
21.2. Pricing Analysis
21.3. Historical Market Size (US$ Mn) and Volume Trend Analysis By Market Taxonomy, 2014 – 2018
21.4. Market Size (US$ Mn) and Volume Forecast By Market Taxonomy, 2019 – 2029
21.4.1. By Country
21.4.1.1. Australia
21.4.1.2. New Zealand
21.4.2. By Form
21.4.3. By Application
21.4.4. By Sales Channels
21.4.5. By Product Type
21.4.6. By Flavor
21.4.7. By Nature
21.5. Market Attractiveness Analysis
21.5.1. By Country
21.5.2. By Form
21.5.3. By Application
21.5.4. By Sales Channels
21.5.5. By Product Type
21.5.6. By Flavor
21.5.7. By Nature
21.6. Market Trends
21.7. Key Market Participants - Intensity Mapping
21.8. Drivers and Restraints - Impact Analysis
22. Middle East and Africa Dehydrated Potato Products Market Analysis 2014 – 2018 and Forecast 2019 – 2029
22.1. Introduction
22.2. Pricing Analysis
22.3. Historical Market Size (US$ Mn) and Volume Trend Analysis By Market Taxonomy, 2014 – 2018
22.4. Market Size (US$ Mn) and Volume Forecast By Market Taxonomy, 2019 – 2029
22.4.1. By Country
22.4.1.1. GCC Countries
22.4.1.2. South Africa
22.4.1.3. Rest of Middle East and Africa
22.4.2. By Form
22.4.3. By Application
22.4.4. By Sales Channels
22.4.5. By Product Type
22.4.6. By Flavor
22.4.7. By Nature
22.5. Market Attractiveness Analysis
22.5.1. By Country
22.5.2. By Form
22.5.3. By Application
22.5.4. By Sales Channels
22.5.5. By Product Type
22.5.6. By Flavor
22.5.7. By Nature
22.6. Market Trends
22.7. Key Market Participants - Intensity Mapping
22.8. Drivers and Restraints - Impact Analysis
23. Emerging Countries Dehydrated Potato Products Market Analysis 2014-2018 and Forecast 2019-2029
23.1. Introduction
23.1.1. Market Value Proportion Analysis, By Key Countries
23.1.2. Growth Comparison of Global Market v/s Emerging Countries
23.2. Mexico Dehydrated Potato Products Market Analysis
23.2.1. Market Value Proportion Analysis by Market Taxonomy
23.2.2. Market Volume (MT) and Value (US$ Mn) Analysis and Forecast by Market Taxonomy
23.2.2.1. By Form
23.2.2.2. By Application
23.2.2.3. By Sales Channels
23.2.2.4. By Product Type
23.2.2.5. By Flavor
23.2.3. Mexico Dehydrated Potato Products Market - Competition Landscape
23.3. South Korea Dehydrated Potato Products Market Analysis
23.3.1. Market Value Proportion Analysis by Market Taxonomy
23.3.2. Market Volume (MT) and Value (US$ Mn) Analysis and Forecast by Market Taxonomy
23.3.2.1. By Form
23.3.2.2. By Application
23.3.2.3. By Sales Channels
23.3.2.4. By Product Type
23.3.2.5. By Flavor
23.3.3. South Korea Dehydrated Potato Products Market - Competition Landscape
24. Market Structure Analysis
24.1. Market Analysis by Tier of Companies
24.2. Market Concentration
24.3. Market Presence Analysis
25. Competition Analysis
25.1. Competition Dashboard
25.2. Competition Benchmarking
25.3. Competition Deep Dive
25.3.1. Basic American Foods (US)
25.3.1.1. Overview
25.3.1.2. Product Portfolio
25.3.1.3. Production Footprint
25.3.1.4. Sales Footprint
25.3.1.5. Strategy Overview
25.3.2. Idahoan Foods (US)
25.3.2.1. Overview
25.3.2.2. Product Portfolio
25.3.2.3. Production Footprint
25.3.2.4. Sales Footprint
25.3.2.5. Strategy Overview
25.3.3. Mccain Foods (Canada)
25.3.3.1. Overview
25.3.3.2. Product Portfolio
25.3.3.3. Production Footprint
25.3.3.4. Sales Footprint
25.3.3.5. Strategy Overview
25.3.4. Lamb Weston (US)
25.3.4.1. Overview
25.3.4.2. Product Portfolio
25.3.4.3. Production Footprint
25.3.4.4. Sales Footprint
25.3.4.5. Strategy Overview
25.3.5. Aviko (Nederland)
25.3.5.1. Overview
25.3.5.2. Product Portfolio
25.3.5.3. Production Footprint
25.3.5.4. Sales Footprint
25.3.5.5. Strategy Overview
25.3.6. Augason Farms (US)
25.3.6.1. Overview
25.3.6.2. Product Portfolio
25.3.6.3. Production Footprint
25.3.6.4. Sales Footprint
25.3.6.5. Strategy Overview
25.3.7. Birkamidon Rohstoffhandels GmbH (Germany)
25.3.7.1. Overview
25.3.7.2. Product Portfolio
25.3.7.3. Production Footprint
25.3.7.4. Sales Footprint
25.3.7.5. Strategy Overview
25.3.8. Pacific Valley Foods (US)
25.3.8.1. Overview
25.3.8.2. Product Portfolio
25.3.8.3. Production Footprint
25.3.8.4. Sales Footprint
25.3.8.5. Strategy Overview
25.3.9. Simplot (US)
25.3.9.1. Overview
25.3.9.2. Product Portfolio
25.3.9.3. Production Footprint
25.3.9.4. Sales Footprint
25.3.9.5. Strategy Overview
25.3.10. Unisur Alimentos Ltda (Chile)
25.3.10.1. Overview
25.3.10.2. Product Portfolio
25.3.10.3. Production Footprint
25.3.10.4. Sales Footprint
25.3.10.5. Strategy Overview
25.3.11. Intersnack Group (France)
25.3.11.1. Overview
25.3.11.2. Product Portfolio
25.3.11.3. Production Footprint
25.3.11.4. Sales Footprint
25.3.11.5. Strategy Overview
25.3.12. J.R. Short Milling (US)
25.3.12.1. Overview
25.3.12.2. Product Portfolio
25.3.12.3. Production Footprint
25.3.12.4. Sales Footprint
25.3.12.5. Strategy Overview
25.3.13. Emsland Group (Germany)
25.3.13.1. Overview
25.3.13.2. Product Portfolio
25.3.13.3. Production Footprint
25.3.13.4. Sales Footprint
25.3.13.5. Strategy Overview
25.3.14. Idaho Supreme Potatoes (US)
25.3.14.1. Overview
25.3.14.2. Product Portfolio
25.3.14.3. Production Footprint
25.3.14.4. Sales Footprint
25.3.14.5. Strategy Overview
25.3.15. Chengde Kuixian Food (CN)
25.3.15.1. Overview
25.3.15.2. Product Portfolio
25.3.15.3. Production Footprint
25.3.15.4. Sales Footprint
25.3.15.5. Strategy Overview
26. Assumptions and Acronyms Used
27. Research Methodology
List of Tables
Table 1: Global Dehydrated Potato Products Market – Scenario Forecast, 2019–2029 (US$ Mn)
Table 2: Global Dehydrated Potato Products Market Size Forecast in terms of Value (US$ Mn) 2019-2029
Table 3: Global Dehydrated Potato Products Market, by Region (US$ Mn), 2019 and 2029
Table 4: Global Dehydrated Potato Products Market Value BPS Analysis, by Nature, 2019 & 2029
Table 5: Global Dehydrated Potato Products Market Value Y-o-Y Growth (%), by Nature, 2019–2029
Table 6: Global Dehydrated Potato Products Market Attractiveness Analysis, by Nature, 2019 & 2029
Table 7: Global Dehydrated Potato Products Market Value BPS Analysis, by Form, 2019 & 2029
Table 8: Global Dehydrated Potato Products Market Value Y-o-Y Growth (%), by Form, 2019–2029
Table 9: Global Dehydrated Potato Products Market Attractiveness Analysis, By Form, 2019 & 2029
Table 10: Global Dehydrated Potato Products Market Value BPS Analysis, by application, 2019 & 2029
Table 11: Global Dehydrated Potato Products Market Value Y-o-Y Growth (%), by application, 2019–2029
Table 12: Global Dehydrated Potato Products Market Attractiveness Analysis, by application, 2019 & 2029
Table 13: Global Dehydrated Potato Products Market Value BPS Analysis, by Product Type, 2019 & 2029
Table 14: Global Dehydrated Potato Products Market Value Y-o-Y Growth (%), by Product Type, 2019–2029
Table 15: Global Dehydrated Potato Products Market Attractiveness Analysis, By Product Type, 2019 & 2029
Table 16: Global Dehydrated Potato Products Market Value BPS Analysis, by Flavor, 2019 & 2029
Table 17: Global Dehydrated Potato Products Market Value Y-o-Y Growth (%), by Flavor, 2019–2029
Table 18: Global Dehydrated Potato Products Market Attractiveness Analysis, By Flavor, 2019 & 2029
Table 19: Global Dehydrated Potato Products Market Value BPS Analysis, by Sales Channel, 2019 & 2029
Table 20: Global Dehydrated Potato Products Market Value Y-o-Y Growth (%), by Sales Channel, 2019–2029
Table 21: Global Dehydrated Potato Products Market Attractiveness Analysis, By Sales Channel, 2019 & 2029
Table 22: Global Dehydrated Potato Products Market Value BPS Analysis, by Region, 2019 & 2029
Table 23: Global Dehydrated Potato Products Market Value Y-o-Y Growth (%), by Region, 2019–2029
Table 24: Global Dehydrated Potato Products Market Attractiveness Analysis, By Region, 2019 & 2029
Table 25: North America Dehydrated Potato Products Market – Scenario Forecast, 2019–2029 (US$ Mn)
Table 26: North America Dehydrated Potato Products Market Size Forecast in terms of Value (US$ Mn) 2019-2029
Table 27: North America Dehydrated Potato Products Market, by Country (US$ Mn), 2019 and 2029
Table 28: North America Dehydrated Potato Products Market Value BPS Analysis, by Nature, 2019 & 2029
Table 29: North America Dehydrated Potato Products Market Value Y-o-Y Growth (%), by Nature, 2019–2029
Table 30: North America Dehydrated Potato Products Market Attractiveness Analysis, by Nature, 2019 & 2029
Table 31: North America Dehydrated Potato Products Market Value BPS Analysis, by Form, 2019 & 2029
Table 32: North America Dehydrated Potato Products Market Value Y-o-Y Growth (%), by Form, 2019–2029
Table 33: North America Dehydrated Potato Products Market Attractiveness Analysis, By Form, 2019 & 2029
Table 34: North America Dehydrated Potato Products Market Value BPS Analysis, by application, 2019 & 2029
Table 35: North America Dehydrated Potato Products Market Value Y-o-Y Growth (%), by application, 2019–2029
Table 36: North America Dehydrated Potato Products Market Attractiveness Analysis, by application, 2019 & 2029
Table 37: North America Dehydrated Potato Products Market Value BPS Analysis, by Product Type, 2019 & 2029
Table 38: North America Dehydrated Potato Products Market Value Y-o-Y Growth (%), by Product Type, 2019–2029
Table 39: North America Dehydrated Potato Products Market Attractiveness Analysis, By Product Type, 2019 & 2029
Table 40: North America Dehydrated Potato Products Market Value BPS Analysis, by Flavor, 2019 & 2029
Table 41: North America Dehydrated Potato Products Market Value Y-o-Y Growth (%), by Flavor, 2019–2029
Table 42: North America Dehydrated Potato Products Market Attractiveness Analysis, By Flavor, 2019 & 2029
Table 43: North America Dehydrated Potato Products Market Value BPS Analysis, by Sales Channel, 2019 & 2029
Table 44: North America Dehydrated Potato Products Market Value Y-o-Y Growth (%), by Sales Channel, 2019–2029
Table 45: North America Dehydrated Potato Products Market Attractiveness Analysis, By Sales Channel, 2019 & 2029
Table 46: North America Dehydrated Potato Products Market Value BPS Analysis, by Country, 2019 & 2029
Table 47: North America Dehydrated Potato Products Market Value Y-o-Y Growth (%), by Country, 2019–2029
Table 48: North America Dehydrated Potato Products Market Attractiveness Analysis, By Country, 2019 & 2029
Table 49: Latin America Dehydrated Potato Products Market – Scenario Forecast, 2019–2029 (US$ Mn)
Table 50: Latin America Dehydrated Potato Products Market Size Forecast in terms of Value (US$ Mn) 2019-2029
Table 51: Latin America Dehydrated Potato Products Market, by Country (US$ Mn), 2019 and 2029
Table 52: Latin America Dehydrated Potato Products Market Value BPS Analysis, by Nature, 2019 & 2029
Table 53: Latin America Dehydrated Potato Products Market Value Y-o-Y Growth (%), by Nature, 2019–2029
Table 54: Latin America Dehydrated Potato Products Market Attractiveness Analysis, by Nature, 2019 & 2029
Table 55: Latin America Dehydrated Potato Products Market Value BPS Analysis, by Form, 2019 & 2029
Table 56: Latin America Dehydrated Potato Products Market Value Y-o-Y Growth (%), by Form, 2019–2029
Table 57: Latin America Dehydrated Potato Products Market Attractiveness Analysis, By Form, 2019 & 2029
Table 58: Latin America Dehydrated Potato Products Market Value BPS Analysis, by application, 2019 & 2029
Table 59: Latin America Dehydrated Potato Products Market Value Y-o-Y Growth (%), by application, 2019–2029
Table 60: Latin America Dehydrated Potato Products Market Attractiveness Analysis, by application, 2019 & 2029
Table 61: Latin America Dehydrated Potato Products Market Value BPS Analysis, by Product Type, 2019 & 2029
Table 62: Latin America Dehydrated Potato Products Market Value Y-o-Y Growth (%), by Product Type, 2019–2029
Table 63: Latin America Dehydrated Potato Products Market Attractiveness Analysis, By Product Type, 2019 & 2029
Table 64: Latin America Dehydrated Potato Products Market Value BPS Analysis, by Flavor, 2019 & 2029
Table 65: Latin America Dehydrated Potato Products Market Value Y-o-Y Growth (%), by Flavor, 2019–2029
Table 66: Latin America Dehydrated Potato Products Market Attractiveness Analysis, By Flavor, 2019 & 2029
Table 67: Latin America Dehydrated Potato Products Market Value BPS Analysis, by Sales Channel, 2019 & 2029
Table 68: Latin America Dehydrated Potato Products Market Value Y-o-Y Growth (%), by Sales Channel, 2019–2029
Table 69: Latin America Dehydrated Potato Products Market Attractiveness Analysis, By Sales Channel, 2019 & 2029
Table 70: Latin America Dehydrated Potato Products Market Value BPS Analysis, by Country, 2019 & 2029
Table 71: Latin America Dehydrated Potato Products Market Value Y-o-Y Growth (%), by Country, 2019–2029
Table 72: Latin America Dehydrated Potato Products Market Attractiveness Analysis, By Country, 2019 & 2029
Table 73: Europe Dehydrated Potato Products Market – Scenario Forecast, 2019–2029 (US$ Mn)
Table 74: Europe Dehydrated Potato Products Market Size Forecast in terms of Value (US$ Mn) 2019-2029
Table 75: Europe Dehydrated Potato Products Market, by Country (US$ Mn), 2019 and 2029
Table 76: Europe Dehydrated Potato Products Market Value BPS Analysis, by Nature, 2019 & 2029
Table 77: Europe Dehydrated Potato Products Market Value Y-o-Y Growth (%), by Nature, 2019–2029
Table 78: Europe Dehydrated Potato Products Market Attractiveness Analysis, by Nature, 2019 & 2029
Table 79: Europe Dehydrated Potato Products Market Value BPS Analysis, by Form, 2019 & 2029
Table 80: Europe Dehydrated Potato Products Market Value Y-o-Y Growth (%), by Form, 2019–2029
Table 81: Europe Dehydrated Potato Products Market Attractiveness Analysis, By Form, 2019 & 2029
Table 82: Europe Dehydrated Potato Products Market Value BPS Analysis, by application, 2019 & 2029
Table 83: Europe Dehydrated Potato Products Market Value Y-o-Y Growth (%), by application, 2019–2029
Table 84: Europe Dehydrated Potato Products Market Attractiveness Analysis, by application, 2019 & 2029
Table 85: Europe Dehydrated Potato Products Market Value BPS Analysis, by Product Type, 2019 & 2029
Table 86: Europe Dehydrated Potato Products Market Value Y-o-Y Growth (%), by Product Type, 2019–2029
Table 87: Europe Dehydrated Potato Products Market Attractiveness Analysis, By Product Type, 2019 & 2029
Table 88: Europe Dehydrated Potato Products Market Value BPS Analysis, by Flavor, 2019 & 2029
Table 89: Europe Dehydrated Potato Products Market Value Y-o-Y Growth (%), by Flavor, 2019–2029
Table 90: Europe Dehydrated Potato Products Market Attractiveness Analysis, By Flavor, 2019 & 2029
Table 91: Europe Dehydrated Potato Products Market Value BPS Analysis, by Sales Channel, 2019 & 2029
Table 92: Europe Dehydrated Potato Products Market Value Y-o-Y Growth (%), by Sales Channel, 2019–2029
Table 93: Europe Dehydrated Potato Products Market Attractiveness Analysis, By Sales Channel, 2019 & 2029
Table 94: Europe Dehydrated Potato Products Market Value BPS Analysis, by Country, 2019 & 2029
Table 95: Europe Dehydrated Potato Products Market Value Y-o-Y Growth (%), by Country, 2019–2029
Table 96: Europe Dehydrated Potato Products Market Attractiveness Analysis, By Country, 2019 & 2029
Table 97: South Asia Dehydrated Potato Products Market – Scenario Forecast, 2019–2029 (US$ Mn)
Table 98: South Asia Dehydrated Potato Products Market Size Forecast in terms of Value (US$ Mn) 2019-2029
Table 99: South Asia Dehydrated Potato Products Market, by Country (US$ Mn), 2019 and 2029
Table 100: South Asia Dehydrated Potato Products Market Value BPS Analysis, by Nature, 2019 & 2029
Table 101: South Asia Dehydrated Potato Products Market Value Y-o-Y Growth (%), by Nature, 2019–2029
Table 102: South Asia Dehydrated Potato Products Market Attractiveness Analysis, by Nature, 2019 & 2029
Table 103: South Asia Dehydrated Potato Products Market Value BPS Analysis, by Form, 2019 & 2029
Table 104: South Asia Dehydrated Potato Products Market Value Y-o-Y Growth (%), by Form, 2019–2029
Table 105: South Asia Dehydrated Potato Products Market Attractiveness Analysis, By Form, 2019 & 2029
Table 106: South Asia Dehydrated Potato Products Market Value BPS Analysis, by application, 2019 & 2029
Table 107: South Asia Dehydrated Potato Products Market Value Y-o-Y Growth (%), by application, 2019–2029
Table 108: South Asia Dehydrated Potato Products Market Attractiveness Analysis, by application, 2019 & 2029
Table 109: South Asia Dehydrated Potato Products Market Value BPS Analysis, by Product Type, 2019 & 2029
Table 110: South Asia Dehydrated Potato Products Market Value Y-o-Y Growth (%), by Product Type, 2019–2029
Table 111: South Asia Dehydrated Potato Products Market Attractiveness Analysis, By Product Type, 2019 & 2029
Table 112: South Asia Dehydrated Potato Products Market Value BPS Analysis, by Flavor, 2019 & 2029
Table 113: South Asia Dehydrated Potato Products Market Value Y-o-Y Growth (%), by Flavor, 2019–2029
Table 114: South Asia Dehydrated Potato Products Market Attractiveness Analysis, By Flavor, 2019 & 2029
Table 115: South Asia Dehydrated Potato Products Market Value BPS Analysis, by Sales Channel, 2019 & 2029
Table 116: South Asia Dehydrated Potato Products Market Value Y-o-Y Growth (%), by Sales Channel, 2019–2029
Table 117: South Asia Dehydrated Potato Products Market Attractiveness Analysis, By Sales Channel, 2019 & 2029
Table 118: South Asia Dehydrated Potato Products Market Value BPS Analysis, by Country, 2019 & 2029
Table 119: South Asia Dehydrated Potato Products Market Value Y-o-Y Growth (%), by Country, 2019–2029
Table 120: South Asia Dehydrated Potato Products Market Attractiveness Analysis, By Country, 2019 & 2029
Table 121: East Asia Dehydrated Potato Products Market – Scenario Forecast, 2019–2029 (US$ Mn)
Table 122: East Asia Dehydrated Potato Products Market Size Forecast in terms of Value (US$ Mn) 2019-2029
Table 123: East Asia Dehydrated Potato Products Market, by Country (US$ Mn), 2019 and 2029
Table 124: East Asia Dehydrated Potato Products Market Value BPS Analysis, by Nature, 2019 & 2029
Table 125: East Asia Dehydrated Potato Products Market Value Y-o-Y Growth (%), by Nature, 2019–2029
Table 126: East Asia Dehydrated Potato Products Market Attractiveness Analysis, by Nature, 2019 & 2029
Table 127: East Asia Dehydrated Potato Products Market Value BPS Analysis, by Form, 2019 & 2029
Table 128: East Asia Dehydrated Potato Products Market Value Y-o-Y Growth (%), by Form, 2019–2029
Table 129: East Asia Dehydrated Potato Products Market Attractiveness Analysis, By Form, 2019 & 2029
Table 130: East Asia Dehydrated Potato Products Market Value BPS Analysis, by application, 2019 & 2029
Table 131: East Asia Dehydrated Potato Products Market Value Y-o-Y Growth (%), by application, 2019–2029
Table 132: East Asia Dehydrated Potato Products Market Attractiveness Analysis, by application, 2019 & 2029
Table 133: East Asia Dehydrated Potato Products Market Value BPS Analysis, by Product Type, 2019 & 2029
Table 134: East Asia Dehydrated Potato Products Market Value Y-o-Y Growth (%), by Product Type, 2019–2029
Table 135: East Asia Dehydrated Potato Products Market Attractiveness Analysis, By Product Type, 2019 & 2029
Table 136: East Asia Dehydrated Potato Products Market Value BPS Analysis, by Flavor, 2019 & 2029
Table 137: East Asia Dehydrated Potato Products Market Value Y-o-Y Growth (%), by Flavor, 2019–2029
Table 138: East Asia Dehydrated Potato Products Market Attractiveness Analysis, By Flavor, 2019 & 2029
Table 139: East Asia Dehydrated Potato Products Market Value BPS Analysis, by Sales Channel, 2019 & 2029
Table 140: East Asia Dehydrated Potato Products Market Value Y-o-Y Growth (%), by Sales Channel, 2019–2029
Table 141: East Asia Dehydrated Potato Products Market Attractiveness Analysis, By Sales Channel, 2019 & 2029
Table 142: East Asia Dehydrated Potato Products Market Value BPS Analysis, by Country, 2019 & 2029
Table 143: East Asia Dehydrated Potato Products Market Value Y-o-Y Growth (%), by Country, 2019–2029
Table 144: East Asia Dehydrated Potato Products Market Attractiveness Analysis, By Country, 2019 & 2029
Table 145: Oceania Dehydrated Potato Products Market – Scenario Forecast, 2019–2029 (US$ Mn)
Table 146: Oceania Dehydrated Potato Products Market Size Forecast in terms of Value (US$ Mn) 2019-2029
Table 147: Oceania Dehydrated Potato Products Market, by Country (US$ Mn), 2019 and 2029
Table 148: Oceania Dehydrated Potato Products Market Value BPS Analysis, by Nature, 2019 & 2029
Table 149: Oceania Dehydrated Potato Products Market Value Y-o-Y Growth (%), by Nature, 2019–2029
Table 150: Oceania Dehydrated Potato Products Market Attractiveness Analysis, by Nature, 2019 & 2029
Table 151: Oceania Dehydrated Potato Products Market Value BPS Analysis, by Form, 2019 & 2029
Table 152: Oceania Dehydrated Potato Products Market Value Y-o-Y Growth (%), by Form, 2019–2029
Table 153: Oceania Dehydrated Potato Products Market Attractiveness Analysis, By Form, 2019 & 2029
Table 154: Oceania Dehydrated Potato Products Market Value BPS Analysis, by application, 2019 & 2029
Table 155: Oceania Dehydrated Potato Products Market Value Y-o-Y Growth (%), by application, 2019–2029
Table 156: Oceania Dehydrated Potato Products Market Attractiveness Analysis, by application, 2019 & 2029
Table 157: Oceania Dehydrated Potato Products Market Value BPS Analysis, by Product Type, 2019 & 2029
Table 158: Oceania Dehydrated Potato Products Market Value Y-o-Y Growth (%), by Product Type, 2019–2029
Table 159: Oceania Dehydrated Potato Products Market Attractiveness Analysis, By Product Type, 2019 & 2029
Table 160: Oceania Dehydrated Potato Products Market Value BPS Analysis, by Flavor, 2019 & 2029
Table 161: Oceania Dehydrated Potato Products Market Value Y-o-Y Growth (%), by Flavor, 2019–2029
Table 162: Oceania Dehydrated Potato Products Market Attractiveness Analysis, By Flavor, 2019 & 2029
Table 163: Oceania Dehydrated Potato Products Market Value BPS Analysis, by Sales Channel, 2019 & 2029
Table 164: Oceania Dehydrated Potato Products Market Value Y-o-Y Growth (%), by Sales Channel, 2019–2029
Table 165: Oceania Dehydrated Potato Products Market Attractiveness Analysis, By Sales Channel, 2019 & 2029
Table 166: Oceania Dehydrated Potato Products Market Value BPS Analysis, by Country, 2019 & 2029
Table 167: Oceania Dehydrated Potato Products Market Value Y-o-Y Growth (%), by Country, 2019–2029
Table 168: Oceania Dehydrated Potato Products Market Attractiveness Analysis, By Country, 2019 & 2029
Table 169: MEA Dehydrated Potato Products Market – Scenario Forecast, 2019–2029 (US$ Mn)
Table 170: MEA Dehydrated Potato Products Market Size Forecast in terms of Value (US$ Mn) 2019-2029
Table 171: MEA Dehydrated Potato Products Market, by Country (US$ Mn), 2019 and 2029
Table 172: MEA Dehydrated Potato Products Market Value BPS Analysis, by Nature, 2019 & 2029
Table 173: MEA Dehydrated Potato Products Market Value Y-o-Y Growth (%), by Nature, 2019–2029
Table 174: MEA Dehydrated Potato Products Market Attractiveness Analysis, by Nature, 2019 & 2029
Table 175: MEA Dehydrated Potato Products Market Value BPS Analysis, by Form, 2019 & 2029
Table 176: MEA Dehydrated Potato Products Market Value Y-o-Y Growth (%), by Form, 2019–2029
Table 177: MEA Dehydrated Potato Products Market Attractiveness Analysis, By Form, 2019 & 2029
Table 178: MEA Dehydrated Potato Products Market Value BPS Analysis, by application, 2019 & 2029
Table 179: MEA Dehydrated Potato Products Market Value Y-o-Y Growth (%), by application, 2019–2029
Table 180: MEA Dehydrated Potato Products Market Attractiveness Analysis, by application, 2019 & 2029
Table 181: MEA Dehydrated Potato Products Market Value BPS Analysis, by Product Type, 2019 & 2029
Table 182: MEA Dehydrated Potato Products Market Value Y-o-Y Growth (%), by Product Type, 2019–2029
Table 183: MEA Dehydrated Potato Products Market Attractiveness Analysis, By Product Type, 2019 & 2029
Table 184: MEA Dehydrated Potato Products Market Value BPS Analysis, by Flavor, 2019 & 2029
Table 185: MEA Dehydrated Potato Products Market Value Y-o-Y Growth (%), by Flavor, 2019–2029
Table 186: MEA Dehydrated Potato Products Market Attractiveness Analysis, By Flavor, 2019 & 2029
Table 187: MEA Dehydrated Potato Products Market Value BPS Analysis, by Sales Channel, 2019 & 2029
Table 188: MEA Dehydrated Potato Products Market Value Y-o-Y Growth (%), by Sales Channel, 2019–2029
Table 189: MEA Dehydrated Potato Products Market Attractiveness Analysis, By Sales Channel, 2019 & 2029
Table 190: MEA Dehydrated Potato Products Market Value BPS Analysis, by Country, 2019 & 2029
Table 191: MEA Dehydrated Potato Products Market Value Y-o-Y Growth (%), by Country, 2019–2029
Table 192: MEA Dehydrated Potato Products Market Attractiveness Analysis, By Country, 2019 & 2029
List of Figures
Figure 1: Global Dehydrated Potato Products Market – Scenario Forecast, 2019–2029 (US$ Mn)
Figure 2: Global Dehydrated Potato Products Market Size Forecast in terms of Value (US$ Mn) 2019-2029
Figure 3: Global Dehydrated Potato Products Market, by Region (US$ Mn), 2019 and 2029
Figure 4: Global Dehydrated Potato Products Market Value BPS Analysis, by Nature, 2019 & 2029
Figure 5: Global Dehydrated Potato Products Market Value Y-o-Y Growth (%), by Nature, 2019–2029
Figure 6: Global Dehydrated Potato Products Market Attractiveness Analysis, by Nature, 2019 & 2029
Figure 7: Global Dehydrated Potato Products Market Value BPS Analysis, by Form, 2019 & 2029
Figure 8: Global Dehydrated Potato Products Market Value Y-o-Y Growth (%), by Form, 2019–2029
Figure 9: Global Dehydrated Potato Products Market Attractiveness Analysis, By Form, 2019 & 2029
Figure 10: Global Dehydrated Potato Products Market Value BPS Analysis, by application, 2019 & 2029
Figure 11: Global Dehydrated Potato Products Market Value Y-o-Y Growth (%), by application, 2019–2029
Figure 12: Global Dehydrated Potato Products Market Attractiveness Analysis, by application, 2019 & 2029
Figure 13: Global Dehydrated Potato Products Market Value BPS Analysis, by Product Type, 2019 & 2029
Figure 14: Global Dehydrated Potato Products Market Value Y-o-Y Growth (%), by Product Type, 2019–2029
Figure 15: Global Dehydrated Potato Products Market Attractiveness Analysis, By Product Type, 2019 & 2029
Figure 16: Global Dehydrated Potato Products Market Value BPS Analysis, by Flavor, 2019 & 2029
Figure 17: Global Dehydrated Potato Products Market Value Y-o-Y Growth (%), by Flavor, 2019–2029
Figure 18: Global Dehydrated Potato Products Market Attractiveness Analysis, By Flavor, 2019 & 2029
Figure 19: Global Dehydrated Potato Products Market Value BPS Analysis, by Sales Channel, 2019 & 2029
Figure 20: Global Dehydrated Potato Products Market Value Y-o-Y Growth (%), by Sales Channel, 2019–2029
Figure 21: Global Dehydrated Potato Products Market Attractiveness Analysis, By Sales Channel, 2019 & 2029
Figure 22: Global Dehydrated Potato Products Market Value BPS Analysis, by Region, 2019 & 2029
Figure 23: Global Dehydrated Potato Products Market Value Y-o-Y Growth (%), by Region, 2019–2029
Figure 24: Global Dehydrated Potato Products Market Attractiveness Analysis, By Region, 2019 & 2029
Figure 25: North America Dehydrated Potato Products Market – Scenario Forecast, 2019–2029 (US$ Mn)
Figure 26: North America Dehydrated Potato Products Market Size Forecast in terms of Value (US$ Mn) 2019-2029
Figure 27: North America Dehydrated Potato Products Market, by Country (US$ Mn), 2019 and 2029
Figure 28: North America Dehydrated Potato Products Market Value BPS Analysis, by Nature, 2019 & 2029
Figure 29: North America Dehydrated Potato Products Market Value Y-o-Y Growth (%), by Nature, 2019–2029
Figure 30: North America Dehydrated Potato Products Market Attractiveness Analysis, by Nature, 2019 & 2029
Figure 31: North America Dehydrated Potato Products Market Value BPS Analysis, by Form, 2019 & 2029
Figure 32: North America Dehydrated Potato Products Market Value Y-o-Y Growth (%), by Form, 2019–2029
Figure 33: North America Dehydrated Potato Products Market Attractiveness Analysis, By Form, 2019 & 2029
Figure 34: North America Dehydrated Potato Products Market Value BPS Analysis, by application, 2019 & 2029
Figure 35: North America Dehydrated Potato Products Market Value Y-o-Y Growth (%), by application, 2019–2029
Figure 36: North America Dehydrated Potato Products Market Attractiveness Analysis, by application, 2019 & 2029
Figure 37: North America Dehydrated Potato Products Market Value BPS Analysis, by Product Type, 2019 & 2029
Figure 38: North America Dehydrated Potato Products Market Value Y-o-Y Growth (%), by Product Type, 2019–2029
Figure 39: North America Dehydrated Potato Products Market Attractiveness Analysis, By Product Type, 2019 & 2029
Figure 40: North America Dehydrated Potato Products Market Value BPS Analysis, by Flavor, 2019 & 2029
Figure 41: North America Dehydrated Potato Products Market Value Y-o-Y Growth (%), by Flavor, 2019–2029
Figure 42: North America Dehydrated Potato Products Market Attractiveness Analysis, By Flavor, 2019 & 2029
Figure 43: North America Dehydrated Potato Products Market Value BPS Analysis, by Sales Channel, 2019 & 2029
Figure 44: North America Dehydrated Potato Products Market Value Y-o-Y Growth (%), by Sales Channel, 2019–2029
Figure 45: North America Dehydrated Potato Products Market Attractiveness Analysis, By Sales Channel, 2019 & 2029
Figure 46: North America Dehydrated Potato Products Market Value BPS Analysis, by Country, 2019 & 2029
Figure 47: North America Dehydrated Potato Products Market Value Y-o-Y Growth (%), by Country, 2019–2029
Figure 48: North America Dehydrated Potato Products Market Attractiveness Analysis, By Country, 2019 & 2029
Figure 49: Latin America Dehydrated Potato Products Market – Scenario Forecast, 2019–2029 (US$ Mn)
Figure 50: Latin America Dehydrated Potato Products Market Size Forecast in terms of Value (US$ Mn) 2019-2029
Figure 51: Latin America Dehydrated Potato Products Market, by Country (US$ Mn), 2019 and 2029
Figure 52: Latin America Dehydrated Potato Products Market Value BPS Analysis, by Nature, 2019 & 2029
Figure 53: Latin America Dehydrated Potato Products Market Value Y-o-Y Growth (%), by Nature, 2019–2029
Figure 54: Latin America Dehydrated Potato Products Market Attractiveness Analysis, by Nature, 2019 & 2029
Figure 55: Latin America Dehydrated Potato Products Market Value BPS Analysis, by Form, 2019 & 2029
Figure 56: Latin America Dehydrated Potato Products Market Value Y-o-Y Growth (%), by Form, 2019–2029
Figure 57: Latin America Dehydrated Potato Products Market Attractiveness Analysis, By Form, 2019 & 2029
Figure 58: Latin America Dehydrated Potato Products Market Value BPS Analysis, by application, 2019 & 2029
Figure 59: Latin America Dehydrated Potato Products Market Value Y-o-Y Growth (%), by application, 2019–2029
Figure 60: Latin America Dehydrated Potato Products Market Attractiveness Analysis, by application, 2019 & 2029
Figure 61: Latin America Dehydrated Potato Products Market Value BPS Analysis, by Product Type, 2019 & 2029
Figure 62: Latin America Dehydrated Potato Products Market Value Y-o-Y Growth (%), by Product Type, 2019–2029
Figure 63: Latin America Dehydrated Potato Products Market Attractiveness Analysis, By Product Type, 2019 & 2029
Figure 64: Latin America Dehydrated Potato Products Market Value BPS Analysis, by Flavor, 2019 & 2029
Figure 65: Latin America Dehydrated Potato Products Market Value Y-o-Y Growth (%), by Flavor, 2019–2029
Figure 66: Latin America Dehydrated Potato Products Market Attractiveness Analysis, By Flavor, 2019 & 2029
Figure 67: Latin America Dehydrated Potato Products Market Value BPS Analysis, by Sales Channel, 2019 & 2029
Figure 68: Latin America Dehydrated Potato Products Market Value Y-o-Y Growth (%), by Sales Channel, 2019–2029
Figure 69: Latin America Dehydrated Potato Products Market Attractiveness Analysis, By Sales Channel, 2019 & 2029
Figure 70: Latin America Dehydrated Potato Products Market Value BPS Analysis, by Country, 2019 & 2029
Figure 71: Latin America Dehydrated Potato Products Market Value Y-o-Y Growth (%), by Country, 2019–2029
Figure 72: Latin America Dehydrated Potato Products Market Attractiveness Analysis, By Country, 2019 & 2029
Figure 73: Europe Dehydrated Potato Products Market – Scenario Forecast, 2019–2029 (US$ Mn)
Figure 74: Europe Dehydrated Potato Products Market Size Forecast in terms of Value (US$ Mn) 2019-2029
Figure 75: Europe Dehydrated Potato Products Market, by Country (US$ Mn), 2019 and 2029
Figure 76: Europe Dehydrated Potato Products Market Value BPS Analysis, by Nature, 2019 & 2029
Figure 77: Europe Dehydrated Potato Products Market Value Y-o-Y Growth (%), by Nature, 2019–2029
Figure 78: Europe Dehydrated Potato Products Market Attractiveness Analysis, by Nature, 2019 & 2029
Figure 79: Europe Dehydrated Potato Products Market Value BPS Analysis, by Form, 2019 & 2029
Figure 80: Europe Dehydrated Potato Products Market Value Y-o-Y Growth (%), by Form, 2019–2029
Figure 81: Europe Dehydrated Potato Products Market Attractiveness Analysis, By Form, 2019 & 2029
Figure 82: Europe Dehydrated Potato Products Market Value BPS Analysis, by application, 2019 & 2029
Figure 83: Europe Dehydrated Potato Products Market Value Y-o-Y Growth (%), by application, 2019–2029
Figure 84: Europe Dehydrated Potato Products Market Attractiveness Analysis, by application, 2019 & 2029
Figure 85: Europe Dehydrated Potato Products Market Value BPS Analysis, by Product Type, 2019 & 2029
Figure 86: Europe Dehydrated Potato Products Market Value Y-o-Y Growth (%), by Product Type, 2019–2029
Figure 87: Europe Dehydrated Potato Products Market Attractiveness Analysis, By Product Type, 2019 & 2029
Figure 88: Europe Dehydrated Potato Products Market Value BPS Analysis, by Flavor, 2019 & 2029
Figure 89: Europe Dehydrated Potato Products Market Value Y-o-Y Growth (%), by Flavor, 2019–2029
Figure 90: Europe Dehydrated Potato Products Market Attractiveness Analysis, By Flavor, 2019 & 2029
Figure 91: Europe Dehydrated Potato Products Market Value BPS Analysis, by Sales Channel, 2019 & 2029
Figure 92: Europe Dehydrated Potato Products Market Value Y-o-Y Growth (%), by Sales Channel, 2019–2029
Figure 93: Europe Dehydrated Potato Products Market Attractiveness Analysis, By Sales Channel, 2019 & 2029
Figure 94: Europe Dehydrated Potato Products Market Value BPS Analysis, by Country, 2019 & 2029
Figure 95: Europe Dehydrated Potato Products Market Value Y-o-Y Growth (%), by Country, 2019–2029
Figure 96: Europe Dehydrated Potato Products Market Attractiveness Analysis, By Country, 2019 & 2029
Figure 97: South Asia Dehydrated Potato Products Market – Scenario Forecast, 2019–2029 (US$ Mn)
Figure 98: South Asia Dehydrated Potato Products Market Size Forecast in terms of Value (US$ Mn) 2019-2029
Figure 99: South Asia Dehydrated Potato Products Market, by Country (US$ Mn), 2019 and 2029
Figure 100: South Asia Dehydrated Potato Products Market Value BPS Analysis, by Nature, 2019 & 2029
Figure 101: South Asia Dehydrated Potato Products Market Value Y-o-Y Growth (%), by Nature, 2019–2029
Figure 102: South Asia Dehydrated Potato Products Market Attractiveness Analysis, by Nature, 2019 & 2029
Figure 103: South Asia Dehydrated Potato Products Market Value BPS Analysis, by Form, 2019 & 2029
Figure 104: South Asia Dehydrated Potato Products Market Value Y-o-Y Growth (%), by Form, 2019–2029
Figure 105: South Asia Dehydrated Potato Products Market Attractiveness Analysis, By Form, 2019 & 2029
Figure 106: South Asia Dehydrated Potato Products Market Value BPS Analysis, by application, 2019 & 2029
Figure 107: South Asia Dehydrated Potato Products Market Value Y-o-Y Growth (%), by application, 2019–2029
Figure 108: South Asia Dehydrated Potato Products Market Attractiveness Analysis, by application, 2019 & 2029
Figure 109: South Asia Dehydrated Potato Products Market Value BPS Analysis, by Product Type, 2019 & 2029
Figure 110: South Asia Dehydrated Potato Products Market Value Y-o-Y Growth (%), by Product Type, 2019–2029
Figure 111: South Asia Dehydrated Potato Products Market Attractiveness Analysis, By Product Type, 2019 & 2029
Figure 112: South Asia Dehydrated Potato Products Market Value BPS Analysis, by Flavor, 2019 & 2029
Figure 113: South Asia Dehydrated Potato Products Market Value Y-o-Y Growth (%), by Flavor, 2019–2029
Figure 114: South Asia Dehydrated Potato Products Market Attractiveness Analysis, By Flavor, 2019 & 2029
Figure 115: South Asia Dehydrated Potato Products Market Value BPS Analysis, by Sales Channel, 2019 & 2029
Figure 116: South Asia Dehydrated Potato Products Market Value Y-o-Y Growth (%), by Sales Channel, 2019–2029
Figure 117: South Asia Dehydrated Potato Products Market Attractiveness Analysis, By Sales Channel, 2019 & 2029
Figure 118: South Asia Dehydrated Potato Products Market Value BPS Analysis, by Country, 2019 & 2029
Figure 119: South Asia Dehydrated Potato Products Market Value Y-o-Y Growth (%), by Country, 2019–2029
Figure 120: South Asia Dehydrated Potato Products Market Attractiveness Analysis, By Country, 2019 & 2029
Figure 121: East Asia Dehydrated Potato Products Market – Scenario Forecast, 2019–2029 (US$ Mn)
Figure 122: East Asia Dehydrated Potato Products Market Size Forecast in terms of Value (US$ Mn) 2019-2029
Figure 123: East Asia Dehydrated Potato Products Market, by Country (US$ Mn), 2019 and 2029
Figure 124: East Asia Dehydrated Potato Products Market Value BPS Analysis, by Nature, 2019 & 2029
Figure 125: East Asia Dehydrated Potato Products Market Value Y-o-Y Growth (%), by Nature, 2019–2029
Figure 126: East Asia Dehydrated Potato Products Market Attractiveness Analysis, by Nature, 2019 & 2029
Figure 127: East Asia Dehydrated Potato Products Market Value BPS Analysis, by Form, 2019 & 2029
Figure 128: East Asia Dehydrated Potato Products Market Value Y-o-Y Growth (%), by Form, 2019–2029
Figure 129: East Asia Dehydrated Potato Products Market Attractiveness Analysis, By Form, 2019 & 2029
Figure 130: East Asia Dehydrated Potato Products Market Value BPS Analysis, by application, 2019 & 2029
Figure 131: East Asia Dehydrated Potato Products Market Value Y-o-Y Growth (%), by application, 2019–2029
Figure 132: East Asia Dehydrated Potato Products Market Attractiveness Analysis, by application, 2019 & 2029
Figure 133: East Asia Dehydrated Potato Products Market Value BPS Analysis, by Product Type, 2019 & 2029
Figure 134: East Asia Dehydrated Potato Products Market Value Y-o-Y Growth (%), by Product Type, 2019–2029
Figure 135: East Asia Dehydrated Potato Products Market Attractiveness Analysis, By Product Type, 2019 & 2029
Figure 136: East Asia Dehydrated Potato Products Market Value BPS Analysis, by Flavor, 2019 & 2029
Figure 137: East Asia Dehydrated Potato Products Market Value Y-o-Y Growth (%), by Flavor, 2019–2029
Figure 138: East Asia Dehydrated Potato Products Market Attractiveness Analysis, By Flavor, 2019 & 2029
Figure 139: East Asia Dehydrated Potato Products Market Value BPS Analysis, by Sales Channel, 2019 & 2029
Figure 140: East Asia Dehydrated Potato Products Market Value Y-o-Y Growth (%), by Sales Channel, 2019–2029
Figure 141: East Asia Dehydrated Potato Products Market Attractiveness Analysis, By Sales Channel, 2019 & 2029
Figure 142: East Asia Dehydrated Potato Products Market Value BPS Analysis, by Country, 2019 & 2029
Figure 143: East Asia Dehydrated Potato Products Market Value Y-o-Y Growth (%), by Country, 2019–2029
Figure 144: East Asia Dehydrated Potato Products Market Attractiveness Analysis, By Country, 2019 & 2029
Figure 145: Oceania Dehydrated Potato Products Market – Scenario Forecast, 2019–2029 (US$ Mn)
Figure 146: Oceania Dehydrated Potato Products Market Size Forecast in terms of Value (US$ Mn) 2019-2029
Figure 147: Oceania Dehydrated Potato Products Market, by Country (US$ Mn), 2019 and 2029
Figure 148: Oceania Dehydrated Potato Products Market Value BPS Analysis, by Nature, 2019 & 2029
Figure 149: Oceania Dehydrated Potato Products Market Value Y-o-Y Growth (%), by Nature, 2019–2029
Figure 150: Oceania Dehydrated Potato Products Market Attractiveness Analysis, by Nature, 2019 & 2029
Figure 151: Oceania Dehydrated Potato Products Market Value BPS Analysis, by Form, 2019 & 2029
Figure 152: Oceania Dehydrated Potato Products Market Value Y-o-Y Growth (%), by Form, 2019–2029
Figure 153: Oceania Dehydrated Potato Products Market Attractiveness Analysis, By Form, 2019 & 2029
Figure 154: Oceania Dehydrated Potato Products Market Value BPS Analysis, by application, 2019 & 2029
Figure 155: Oceania Dehydrated Potato Products Market Value Y-o-Y Growth (%), by application, 2019–2029
Figure 156: Oceania Dehydrated Potato Products Market Attractiveness Analysis, by application, 2019 & 2029
Figure 157: Oceania Dehydrated Potato Products Market Value BPS Analysis, by Product Type, 2019 & 2029
Figure 158: Oceania Dehydrated Potato Products Market Value Y-o-Y Growth (%), by Product Type, 2019–2029
Figure 159: Oceania Dehydrated Potato Products Market Attractiveness Analysis, By Product Type, 2019 & 2029
Figure 160: Oceania Dehydrated Potato Products Market Value BPS Analysis, by Flavor, 2019 & 2029
Figure 161: Oceania Dehydrated Potato Products Market Value Y-o-Y Growth (%), by Flavor, 2019–2029
Figure 162: Oceania Dehydrated Potato Products Market Attractiveness Analysis, By Flavor, 2019 & 2029
Figure 163: Oceania Dehydrated Potato Products Market Value BPS Analysis, by Sales Channel, 2019 & 2029
Figure 164: Oceania Dehydrated Potato Products Market Value Y-o-Y Growth (%), by Sales Channel, 2019–2029
Figure 165: Oceania Dehydrated Potato Products Market Attractiveness Analysis, By Sales Channel, 2019 & 2029
Figure 166: Oceania Dehydrated Potato Products Market Value BPS Analysis, by Country, 2019 & 2029
Figure 167: Oceania Dehydrated Potato Products Market Value Y-o-Y Growth (%), by Country, 2019–2029
Figure 168: Oceania Dehydrated Potato Products Market Attractiveness Analysis, By Country, 2019 & 2029
Figure 169: MEA Dehydrated Potato Products Market – Scenario Forecast, 2019–2029 (US$ Mn)
Figure 170: MEA Dehydrated Potato Products Market Size Forecast in terms of Value (US$ Mn) 2019-2029
Figure 171: MEA Dehydrated Potato Products Market, by Country (US$ Mn), 2019 and 2029
Figure 172: MEA Dehydrated Potato Products Market Value BPS Analysis, by Nature, 2019 & 2029
Figure 173: MEA Dehydrated Potato Products Market Value Y-o-Y Growth (%), by Nature, 2019–2029
Figure 174: MEA Dehydrated Potato Products Market Attractiveness Analysis, by Nature, 2019 & 2029
Figure 175: MEA Dehydrated Potato Products Market Value BPS Analysis, by Form, 2019 & 2029
Figure 176: MEA Dehydrated Potato Products Market Value Y-o-Y Growth (%), by Form, 2019–2029
Figure 177: MEA Dehydrated Potato Products Market Attractiveness Analysis, By Form, 2019 & 2029
Figure 178: MEA Dehydrated Potato Products Market Value BPS Analysis, by application, 2019 & 2029
Figure 179: MEA Dehydrated Potato Products Market Value Y-o-Y Growth (%), by application, 2019–2029
Figure 180: MEA Dehydrated Potato Products Market Attractiveness Analysis, by application, 2019 & 2029
Figure 181: MEA Dehydrated Potato Products Market Value BPS Analysis, by Product Type, 2019 & 2029
Figure 182: MEA Dehydrated Potato Products Market Value Y-o-Y Growth (%), by Product Type, 2019–2029
Figure 183: MEA Dehydrated Potato Products Market Attractiveness Analysis, By Product Type, 2019 & 2029
Figure 184: MEA Dehydrated Potato Products Market Value BPS Analysis, by Flavor, 2019 & 2029
Figure 185: MEA Dehydrated Potato Products Market Value Y-o-Y Growth (%), by Flavor, 2019–2029
Figure 186: MEA Dehydrated Potato Products Market Attractiveness Analysis, By Flavor, 2019 & 2029
Figure 187: MEA Dehydrated Potato Products Market Value BPS Analysis, by Sales Channel, 2019 & 2029
Figure 188: MEA Dehydrated Potato Products Market Value Y-o-Y Growth (%), by Sales Channel, 2019–2029
Figure 189: MEA Dehydrated Potato Products Market Attractiveness Analysis, By Sales Channel, 2019 & 2029
Figure 190: MEA Dehydrated Potato Products Market Value BPS Analysis, by Country, 2019 & 2029
Figure 191: MEA Dehydrated Potato Products Market Value Y-o-Y Growth (%), by Country, 2019–2029
Figure 192: MEA Dehydrated Potato Products Market Attractiveness Analysis, By Country, 2019 & 2029
Copyright © Transparency Market Research, Inc. All Rights reserved
Trust Online

Dehydrated Potato Products Market
